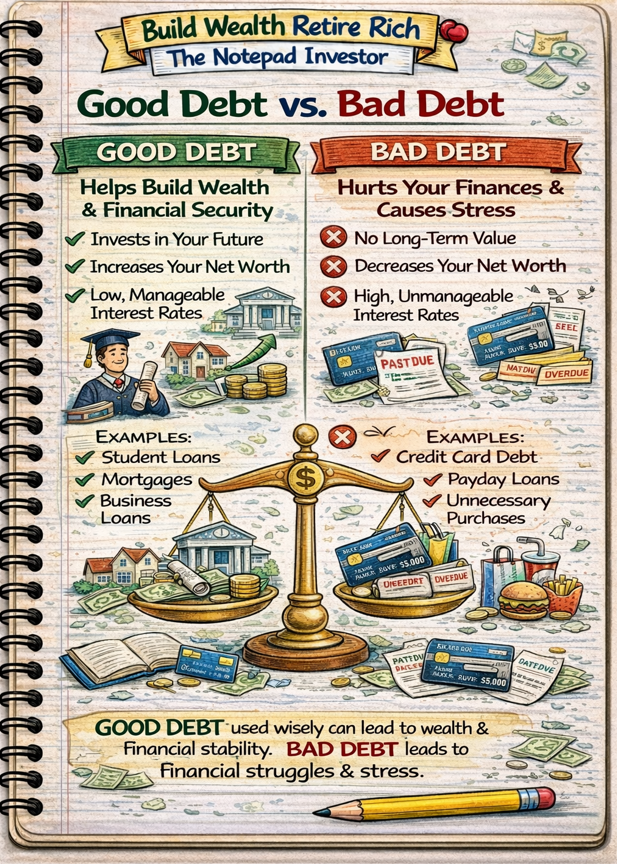
Good debt finances appreciating assets or income-generating investments where borrowed funds create value exceeding interest costs through equity building, earning capacity increases, or revenue generation—typically characterized by lower interest rates (under 8%), secured collateral enabling favorable terms, and tangible wealth-building outcomes measurable over time such as home equity accumulation, degree-enabled salary increases, or business profit growth. Bad debt funds consumption, depreciating purchases, or routine expenses through high-interest borrowing (over 15%) creating obligations without corresponding value—characterized by financing vacations, dining, entertainment, or lifestyle spending through credit cards, payday loans, or predatory personal loans where interest costs often exceed original purchase values while assets consumed or depreciated create zero lasting benefit making total costs pure wealth destruction through compound interest and opportunity costs. The fundamental distinction separates strategic leverage enabling major purchases impossible through cash-only approaches while building long-term wealth from irresponsible consumption borrowing creating perpetual payment obligations preventing wealth accumulation—though context matters enormously as same debt type can be good or bad depending on interest rates, repayment terms, asset characteristics, and whether borrowed funds enable wealth creation or merely facilitate overspending beyond sustainable income levels.
This article is designed for anyone evaluating borrowing decisions, individuals wanting framework distinguishing strategic from destructive debt, or those confused by conflicting advice about debt usage. You do not need financial expertise to understand good versus bad debt—core principles accessible through clear examples and decision frameworks, though requires honest self-assessment distinguishing between genuine needs and wants, essential investments and discretionary consumption, and realistic repayment capacity versus optimistic assumptions about future income enabling informed borrowing aligned with long-term wealth building rather than short-term gratification creating long-term financial burden through high-interest obligations exceeding benefits received.
Understanding good versus bad debt matters because single borrowing decision can either enable wealth accumulation through strategic leverage or create financial destruction through high-interest consumption, lifetime borrowing costs often totaling $200,000-500,000 making debt literacy essential for wealth optimization, and appropriate debt usage separates middle-class stagnation from millionaire wealth building when leverage applied strategically—while good-debt-literate individuals build home equity through mortgages, increase earning capacity through education loans, and maintain excellent credit enabling optimal rates, bad-debt users accumulate credit card balances for lifestyle maintenance, pay thousands in unnecessary interest for consumed purchases, and perpetuate cycles preventing wealth building through payment obligations consuming discretionary income that could otherwise compound through investments creating dramatically different lifetime financial outcomes from identical starting points.
Educational disclaimer: This article provides general educational information about debt evaluation frameworks. Individual borrowing situations, appropriate debt types, and optimal strategies vary significantly based on circumstances including income, assets, goals, and risk tolerance. “Good debt” terminology represents strategic borrowing concept not guarantee of positive outcomes—all debt carries risks. This is not financial advice or recommendation of specific borrowing actions. Consult qualified financial professionals for personalized guidance matching individual situations.
Defining Good Debt vs Bad Debt
Good Debt Characteristics
Core criteria for good debt:
- Finances appreciating assets: Purchases increasing in value over time (real estate typically)
- Generates income or increases earning capacity: Education, business investments, rental properties
- Lower interest rates: Typically under 8% APR (secured debt, prime rates)
- Value created exceeds interest costs: Benefits outweigh borrowing expenses measurably
- Strategic necessity: Enables essential purchases impractical through cash-only approach
- Comfortable repayment: Payments sustainable within budget without financial strain
Common good debt examples:
- Mortgages for primary residence (building equity, avoiding rent)
- Student loans for high-ROI degrees (engineering, medicine, law increasing lifetime earnings)
- Business loans generating revenue exceeding borrowing costs
- Real estate investment loans for rental properties creating cash flow
- Strategic auto loans enabling employment (low rates, necessary transportation)
Bad Debt Characteristics
Core criteria for bad debt:
- Finances consumption: Purchases consumed without lasting value (dining, entertainment, vacations)
- Depreciating assets at high rates: Rapidly losing value items financed expensively
- High interest rates: Typically over 15% APR (credit cards, payday loans, predatory lending)
- Cost exceeds benefits: Interest and fees outweigh value received from purchase
- Routine expense coverage: Indicates budget mismatch not strategic leverage
- Strained repayment: Payments create financial stress or require sacrifice of essentials
Common bad debt examples:
- Credit card balances for lifestyle spending (vacations, dining, shopping)
- Payday loans for routine expenses (groceries, utilities indicating budget gap)
- High-interest auto loans for luxury vehicles (12%+ on depreciating assets)
- Personal loans for consumption (weddings, home theater systems, non-essentials)
- Store financing for furniture, electronics, appliances at 20%+ APR
The Gray Area: Context-Dependent Debt
Debt that can be good OR bad depending on circumstances:
Auto loans:
- Good: $18,000 reliable vehicle at 5% enabling $45,000 job (essential transportation)
- Bad: $60,000 luxury SUV at 12% for status when $20,000 sedan adequate (lifestyle inflation)
Home equity borrowing:
- Good: HELOC at 7% funding kitchen renovation adding $30,000 home value for $20,000 cost
- Bad: HELOC at 8% funding $40,000 vacation risking home foreclosure for consumed experience
Credit cards:
- Good: Emergency $1,200 car repair on 0% promotional card, paid off within 6 months enabling job continuation
- Bad: $5,000 shopping and dining over 6 months at 22% APR paid over 3+ years costing $6,500+ total
Student loans:
- Good: $30,000 for engineering degree increasing income from $35,000 to $75,000 (paid back in 3 years from differential)
- Bad: $80,000 for art history degree leading to $32,000 retail job (payments consume 25% of income for 20+ years)

Good Debt Examples in Detail
Mortgages (Prime Example of Good Debt)
Why mortgages are typically good debt:
- Homes appreciate historically 3-5% annually on average
- Builds equity through principal payments and appreciation
- Alternative is rent (builds landlord’s equity not yours)
- Tax benefits (mortgage interest deduction for some taxpayers)
- Fixed housing costs (vs rent increases)
- Low interest rates (6-8% typical for prime borrowers)
Comprehensive mortgage example:
- Purchase: $300,000 home, $60,000 down (20%), $240,000 mortgage
- Terms: 30 years, 6.5% APR
- Monthly payment: $1,517 (principal + interest)
- Total paid over 30 years: $546,120
- Total interest: $306,120 ($546,120 – $240,000)
- Home value after 30 years: $729,000 (3.5% annual appreciation)
- Equity accumulated: $729,000 (all principal paid, appreciation)
- Net wealth created: $729,000 home minus $60,000 down minus $306,120 interest = $362,880 net gain
Rent alternative comparison:
- Rent comparable home: $2,000 monthly
- Total rent over 30 years: $720,000 ($2,000 × 360 months)
- Equity built: $0 (rent builds landlord’s wealth)
- Net wealth: -$720,000 (pure expense)
Total difference: $1,082,880 wealth swing (mortgage equity $362,880 vs rent -$720,000)
When mortgages become questionable:
- Payment exceeds 28-30% of gross income (strained affordability)
- Minimal down payment creating high loan-to-value ratio
- Adjustable rates in rising rate environment
- Home purchase in declining market or unsustainable price bubble
- Short holding period (under 5 years, transaction costs exceed benefits)
Education Loans for High-ROI Degrees
Why education loans can be good debt:
- Degree increases lifetime earning capacity
- Income differential exceeds debt repayment costs
- Career opportunities unavailable without degree
- Lower interest rates (federal 4-7%, private 7-12%)
- Income-driven repayment options for federal loans
High-ROI education example:
- Degree: Bachelor’s in Nursing, $40,000 total student loans
- Without degree income: $30,000 annually (retail, service work)
- With degree income: $75,000 annually (registered nurse)
- Income differential: $45,000 annually
- Loan payment: $430 monthly (10-year standard repayment at 5%)
- Annual debt service: $5,160
- Net benefit year 1: $45,000 – $5,160 = $39,840 additional income after loan payment
- Payback period: Debt paid in full year 10
- Lifetime benefit (40-year career): $1.8 million additional earnings ($45,000 × 40 years)
- ROI: 45:1 return ($1.8M benefit vs $40K debt)
When student loans become bad debt:
- Low-earning degree (median income under $40,000)
- Excessive debt (over 1x expected first-year salary)
- For-profit institutions with poor outcomes
- Degree completion unlikely (borrowing without finishing)
- Private loans at high rates (over 10%) when federal available
Low-ROI education example (bad debt):
- Degree: Bachelor’s in Liberal Arts, $80,000 total student loans
- Income: $38,000 annually (similar to no degree alternatives)
- Loan payment: $920 monthly (10-year repayment)
- Annual debt service: $11,040
- Debt service as percentage of gross income: 29% (unsustainable burden)
- Income-driven repayment: $200 monthly but extends to 20-25 years
- Total paid over 20 years: $48,000+ (debt growing through interest)
- Net benefit: Minimal income increase versus debt burden
Business Loans for Revenue Generation
Why business loans can be good debt:
- Investment in revenue-generating assets or capabilities
- Returns exceed borrowing costs
- Enables business growth impossible from cash flow alone
- Deductible interest expense reduces effective cost
Productive business loan example:
- Loan: $50,000 at 8% for equipment purchase
- Equipment enables new product line
- Additional revenue: $40,000 annually
- Additional expenses: $15,000 annually (materials, labor)
- Additional profit: $25,000 annually
- Loan payment: $607 monthly ($7,284 annually)
- Net benefit year 1: $25,000 profit – $7,284 debt service = $17,716
- Payback: Loan paid in 7 years, equipment continues generating profit years 8+
- 10-year total: $250,000 revenue – $150,000 expenses – $50,000 equipment = $50,000 net gain from $50,000 investment
Investment Property Loans
Why rental property loans can be good debt:
- Tenants pay mortgage through rent
- Property appreciates building equity
- Tax benefits (depreciation, expense deductions)
- Positive cash flow when managed properly
- Leverage multiplies returns (control $300,000 asset with $60,000 down)
Investment property example:
- Purchase: $250,000 rental property, $50,000 down, $200,000 mortgage at 7%
- Monthly mortgage: $1,331
- Rental income: $2,000 monthly
- Expenses: $500 monthly (taxes, insurance, maintenance reserve, management)
- Cash flow: $2,000 – $1,331 – $500 = $169 monthly positive
- Annual cash flow: $2,028
- Principal paydown: $3,500 annually (year 1)
- Appreciation: $8,750 annually (3.5%)
- Total annual return: $14,278 on $50,000 investment = 28.5% return
- After 10 years: Equity $100,000+, cash flow $24,000+, property worth $350,000+
Bad Debt Examples in Detail
Credit Card Debt for Consumption
Why credit card consumption debt is bad:
- High interest rates (18-25% typical)
- Finances items consumed without lasting value
- Minimum payments create perpetual debt
- Total costs often double purchase prices
- Opportunity cost prevents wealth building
Lifestyle credit card debt example:
- Accumulated purchases: $8,000 over 1 year (dining $2,500, shopping $3,000, entertainment $1,500, vacation $1,000)
- APR: 20%
- Minimum payment: $200 monthly (2.5% of balance)
- Payoff timeline: 6 years 3 months
- Total interest: $7,200
- Total paid: $15,200 for $8,000 consumed purchases
- Items remaining: Zero (vacation consumed, clothing worn out, meals digested)
- Net result: -$15,200 for temporary enjoyment, $7,200 pure interest waste
Alternative scenario (saved instead of borrowed):
- Delayed gratification: Save $200 monthly for 40 months
- Total saved: $8,000
- Purchase same items cash: $8,000 cost
- Interest paid: $0
- Time cost: 40 months vs immediate but paid for 75 months on credit
- Savings: $7,200 avoided interest
Payday Loans for Routine Expenses
Why payday loans represent bad debt:
- Extremely high APRs (300-400% typical)
- Covers routine expenses indicating budget failure
- Short terms create reborrow cycle
- Fees accumulate rapidly
- Perpetuates financial crisis instead of solving
Payday loan cycle example:
- Initial need: $500 for groceries and utilities
- Payday loan: $500 borrowed, $75 fee (15% for 2 weeks = 391% APR)
- Due amount: $575 in 2 weeks
- Next paycheck: Cannot afford $575, renews with another $75 fee
- Cycle repeats: Every 2 weeks pays $75 fee, still owes $500 principal
- After 6 months (13 renewals): Paid $975 in fees, still owes $500
- Total to escape: $1,475 paid for $500 borrowed
- Effective cost: 195% of borrowed amount
High-Interest Auto Loans for Luxury
Why luxury auto debt often bad:
- Rapid depreciation (30-40% in 3 years typical)
- High interest rates for subprime borrowers (12-20%)
- Long terms (72-84 months) underwater quickly
- Lifestyle inflation not wealth building
- Alternative adequate vehicles available cheaper
Luxury auto loan example:
- Vehicle: $50,000 luxury SUV
- Loan: $45,000 (10% down), 72 months, 14% APR
- Monthly payment: $891
- Total paid: $64,152
- Total interest: $19,152
- Vehicle value after 6 years: $15,000 (70% depreciation)
- Net result: Paid $64,152 ($5,000 down + $59,152 payments) for asset worth $15,000, lost $49,152
Reasonable alternative:
- Vehicle: $22,000 reliable sedan
- Loan: $20,000 (10% down), 60 months, 6% APR
- Monthly payment: $387
- Total paid: $25,220
- Total interest: $3,220
- Vehicle value after 5 years: $10,000
- Monthly savings: $504 ($891 – $387)
- Invest savings $504 monthly for 6 years at 8%: $47,800
- Net difference: $47,800 investment + $10,000 car = $57,800 versus $15,000 car on luxury path = $42,800 better position
Personal Loans for Consumption
Wedding financed with personal loan example:
- Wedding cost: $30,000
- Personal loan: $30,000 at 12% APR, 60 months
- Monthly payment: $668
- Total paid: $40,080
- Total interest: $10,080
- Asset remaining: $0 (event consumed)
- Marriage outcome: 50% end in divorce (potential $40,080 paid for failed union)
- Net result: $40,080 for single day, zero tangible assets
Alternative:
- Modest $10,000 wedding paid cash from savings
- Invest $668 monthly for 5 years at 7%: $47,500
- Down payment fund: $47,500 available for home purchase year 6
- Net difference: $47,500 home down payment vs $0 remaining from lavish wedding
Decision Framework: Evaluating Borrowing Opportunities
The 7-Question Test
Question 1: What am I buying?
- Good indicators: Home, education, business asset, essential reliable transportation
- Bad indicators: Vacation, dining, entertainment, luxury items, routine expenses
- Decision impact: Asset type fundamentally determines good vs bad classification
Question 2: Will this appreciate, depreciate, or be consumed?
- Appreciate: Real estate (typically), certain business assets → Supports good debt
- Depreciate slowly: Vehicles (if necessary), durable goods → Neutral to questionable
- Depreciate rapidly: Electronics, furniture, vehicles (luxury) → Bad debt territory
- Consumed: Experiences, food, entertainment → Always bad debt
Question 3: What’s the interest rate?
- Under 5%: Excellent, likely strategic borrowing opportunity
- 5-8%: Reasonable for mortgages, good for other secured debt
- 8-15%: Questionable unless essential, evaluate carefully
- 15-25%: Bad debt territory, avoid unless true emergency
- Over 25%: Predatory, almost never justifiable
Question 4: Will this generate income or increase my earning capacity?
- Yes: Strong good debt indicator (education, business investment, rental property)
- Indirectly: Consider carefully (reliable car enabling higher-paying job)
- No: Must meet other criteria to justify (primary residence builds equity)
Question 5: Can I comfortably afford the payments?
- Test: Payment under 10% of gross income for single debt, all debt under 36% total
- Comfortable: Payment sustainable without sacrificing essentials or savings
- Stretching: Requires sacrifice of other goals, red flag
- Unaffordable: Disrupts basic needs, absolutely avoid
Question 6: What happens if I save and wait instead?
- Significant consequences: Job loss, health deterioration, income opportunity missed → May justify borrowing
- Mere inconvenience: Temporary discomfort, delayed gratification → Save instead
- Nothing critical: Want not need → Definitely save instead
Question 7: Will this create value exceeding the total cost including interest?
- Calculate: Total payments (principal + all interest) vs expected value created
- Positive ROI: Home equity, income increase, business profit exceeding debt costs → Good debt
- Negative ROI: Total paid exceeds any measurable benefit → Bad debt
Applying the Framework
Example 1: $300,000 mortgage evaluation
- Q1 – What buying? Primary residence
- Q2 – Appreciate/depreciate? Appreciates 3-4% annually typical
- Q3 – Interest rate? 6.5% (reasonable)
- Q4 – Generate income? No, but builds equity and avoids rent
- Q5 – Affordable? Payment 25% of gross income (within 28% guideline)
- Q6 – If wait? Continue paying rent building landlord’s equity
- Q7 – Value exceeds cost? Equity $400,000+ in 30 years vs $306,000 interest = net positive
- Verdict: GOOD DEBT (meets multiple criteria, strategic wealth building)
Example 2: $5,000 vacation on credit card evaluation
- Q1 – What buying? Vacation experience (consumption)
- Q2 – Appreciate/depreciate? Consumed, zero residual value
- Q3 – Interest rate? 20% (high)
- Q4 – Generate income? No
- Q5 – Affordable? Requires 3+ years minimum payments (stretching)
- Q6 – If wait? Save 10 months, take same vacation debt-free
- Q7 – Value exceeds cost? Pay $6,500+ for $5,000 vacation, memories only lasting value
- Verdict: BAD DEBT (fails most criteria, pure consumption at high cost)
Example 3: $40,000 engineering degree evaluation
- Q1 – What buying? Bachelor’s degree in high-demand field
- Q2 – Appreciate/depreciate? Increases earning capacity permanently
- Q3 – Interest rate? 5% federal loans (low)
- Q4 – Generate income? Yes, $35,000 → $75,000 salary increase
- Q5 – Affordable? $430 monthly on $75,000 income = 6.8% (comfortable)
- Q6 – If wait? Delay career start, lose years of higher earning
- Q7 – Value exceeds cost? $1.6M lifetime additional earnings vs $40K debt = 40:1 ROI
- Verdict: GOOD DEBT (strong income generation, positive ROI, affordable)
The Interest Rate Threshold
Rate Guidelines for Good vs Bad Classification
Excellent rates (Under 5%):
- Often worth considering even for borderline purchases
- Interest cost low enough that inflation partially offsets
- May be worth maintaining debt while investing elsewhere
- Examples: Some mortgages, top-tier auto loans, federal student loans
Good rates (5-8%):
- Acceptable for productive debt (homes, education, business)
- Reasonable cost for strategic leverage
- Aggressive payoff optional, maintaining debt acceptable if invest wisely
- Examples: Most mortgages, good credit auto loans, credit union personal loans
Questionable rates (8-15%):
- Only justifiable for essential needs or clear income generation
- Aggressive payoff recommended
- Avoid for discretionary purchases
- Examples: Average credit cards (if paid off monthly acceptable), some auto loans, business lines of credit
Bad rates (15-25%):
- Almost never justifiable except true emergencies
- Immediate aggressive payoff essential
- Indicates lack of better options (credit issues)
- Examples: High-rate credit cards, subprime auto loans, some personal loans
Predatory rates (Over 25%):
- Never justifiable under normal circumstances
- Creates debt traps impossible to escape
- Seek alternatives at any cost
- Examples: Payday loans, title loans, rent-to-own arrangements
Rate Impact on Good vs Bad Classification
Same purchase, different rates:
$25,000 auto loan scenario:
- At 4% (60 months): Payment $460, total paid $27,600, interest $2,600 (10% of principal) = Acceptable for necessary vehicle
- At 12% (60 months): Payment $557, total paid $33,420, interest $8,420 (34% of principal) = Questionable, strong candidate for aggressive payoff
- At 20% (60 months): Payment $662, total paid $39,720, interest $14,720 (59% of principal) = Bad debt even for necessary vehicle, seek alternatives
Key insight: High rates transform otherwise reasonable purchases into bad debt through excessive interest costs
Why Understanding Good vs Bad Debt Matters
Without distinguishing good from bad debt, individuals treat all borrowing identically missing strategic leverage opportunities enabling wealth building through homeownership and education, accumulate high-interest consumption debt destroying wealth through compound interest on depreciating purchases, and make emotionally-driven borrowing decisions lacking framework evaluating long-term costs versus benefits—while good-debt-literate individuals build substantial home equity through strategic mortgages, invest in income-increasing education yielding 10-40x returns, and avoid lifestyle debt freeing cash flow for wealth-building investments, creating dramatically different lifetime financial outcomes where strategic debt users achieve millionaire status through appropriate leverage while bad-debt accumulators remain paycheck-to-paycheck despite identical incomes through interest payments consuming discretionary income preventing wealth accumulation impossible without understanding fundamental good versus bad debt distinctions.
Understanding good versus bad debt enables individuals to:
- Make strategic borrowing decisions aligned with long-term wealth building
- Calculate total costs including interest revealing true expense of purchases
- Recognize when debt enables wealth creation versus merely facilitating consumption
- Evaluate interest rates determining acceptable versus destructive borrowing costs
- Apply decision frameworks distinguishing needs from wants and essentials from luxuries
- Build substantial wealth through appropriate leverage (home equity, income generation)
- Avoid wealth destruction through consumption borrowing creating obligations without value
Good-versus-bad-debt knowledge transforms borrowing from feared taboo or unexamined habit into strategic wealth-building tool when applied appropriately to appreciating assets and income generation while avoided for consumption and depreciating purchases creating measured outcomes impossible without framework distinguishing strategic from destructive debt usage.
Common Misunderstandings
Many people assume all debt inherently bad requiring complete avoidance. In reality, strategic “good debt” enables major wealth-building purchases impossible through cash-only approaches—homeownership builds $200,000-500,000 equity over 30 years impossible for most through saving alone, education loans generate 10-40x returns through increased lifetime earnings, and business loans create revenue streams exceeding borrowing costs, proving appropriate leverage accelerates wealth building making complete debt avoidance counterproductive despite common debt-aversion advice treating all borrowing identically without distinguishing strategic from destructive usage.
Another common misconception is low interest rates automatically make debt “good.” However, 0% financing for furniture, electronics, or vehicles doesn’t transform consumption into productive investment—borrowed money still finances rapidly depreciating or consumed purchases creating obligations without corresponding wealth building regardless of rate, proving interest rate only one factor among many with asset type and purpose equally important determining good versus bad classification making context examination essential beyond simply evaluating APR percentages.
Some believe student loans always represent “good debt” investment in future. In practice, education ROI varies dramatically—$30,000 engineering debt enabling $40,000 income increase produces positive ROI within years while $80,000 liberal arts debt leading to $35,000 retail job creates burden consuming 25%+ of income for decades, proving degree field, debt amount relative to expected earnings, and completion likelihood all critical factors determining whether education loans strategic investment or destructive burden making blanket “student loans are good debt” advice oversimplified without ROI analysis and realistic earning potential evaluation.
How Good vs Bad Debt Understanding Fits Into Financial Success
Good versus bad debt understanding separates strategic wealth builders leveraging appropriate borrowing from wealth destroyers accumulating consumption debt, enables $200,000-500,000+ home equity accumulation impossible for most through saving alone, and creates framework preventing lifestyle debt consuming discretionary income that could otherwise compound through investments—making debt classification literacy essential component of financial success requiring strategic borrowing for appreciating assets and income generation while avoiding consumption borrowing for depreciating purchases and lifestyle maintenance, transforming debt from universal enemy into selective tool enabling major wealth-building purchases when applied appropriately versus creating financial destruction through high-interest obligations without corresponding value creation impossible without distinguishing strategic productive debt from destructive consumption borrowing.
For example, two 25-year-olds both earning $50,000 with similar spending patterns. Person A treats all debt as bad, avoids borrowing entirely using only cash and debit. Saves diligently accumulating $20,000 by age 28. Wants to buy home but denied mortgage—no credit history despite cash reserves and stable job. Continues renting $1,500 monthly. Age 35: Still renting despite $50,000 saved (insufficient for purchase plus denied financing), spent $126,000 on rent over 10 years building landlord’s wealth not own. Drives $5,000 cash-purchased vehicles needing constant repairs, $2,500 annually in maintenance. Zero credit card rewards despite $30,000 annual spending. Age 45: Paid $306,000 in rent over 20 years, owns aging vehicle, $80,000 saved but never qualified for mortgage due to credit invisibility, no home equity wealth. Person B understands good versus bad debt distinction, uses strategic borrowing while avoiding consumption debt. Age 25: Opens credit card using for routine spending paying full balance monthly building credit (zero interest, earns 2% cash back = $600 annually). Age 28: Excellent 760+ credit score, $20,000 saved, approved for $250,000 mortgage 6.5% with $20,000 down. Monthly payment $1,452 (similar to rent). Finances reliable $22,000 vehicle at 5% ($415 monthly) versus buying unreliable cash car. Age 35: Home worth $325,000 with $70,000 equity ($35,000 principal paid + $35,000 appreciation), total paid $122,472 in mortgage payments but owns appreciating asset, reliable vehicles through strategic financing saving repair costs. Age 45: Home worth $450,000 with $180,000 equity ($100,000 principal + $80,000 appreciation), total paid $313,344 in mortgage but owns $450,000 asset (net $136,656 wealth from $20,000 initial), earned $12,000 credit card rewards ($600 × 20 years), reliable transportation enabling career advancement to $75,000 income. Difference from Person A: Person B’s good debt literacy created $396,656 wealth difference ($136,656 home equity profit + $126,000 avoided rent payments + $12,000 rewards + $80,000 savings + $42,000 less in vehicle maintenance) versus Person A’s $80,000 saved minus continued rent expense creating dramatically different net worth from understanding strategic debt usage for appreciating assets while avoiding consumption borrowing—both started identical positions and spending levels, Person B achieved homeownership and substantial wealth through appropriate leverage while Person A remained financially stagnant through blanket debt avoidance preventing access to wealth-building opportunities requiring credit.
Good-versus-bad-debt understanding separates millionaire wealth builders leveraging appreciating assets from paycheck-to-paycheck strugglers accumulating consumption debt or missing strategic opportunities through blanket debt avoidance, requiring framework distinguishing productive from destructive borrowing enabling informed decisions maximizing wealth while minimizing financial destruction.
Recent Updates and Trends
In recent years, student loan debt has exceeded $1.7 trillion nationally creating policy debates around forgiveness and income-driven repayment, though fundamental education ROI principles unchanged requiring degree earning potential evaluation versus debt incurred making some student loans excellent investments while others create unsustainable burdens depending on field of study and total borrowing relative to expected income.
Housing affordability challenges have intensified in many markets with median home prices reaching 5-7x median household incomes versus historical 3-4x, though home equity building through mortgage paydown and appreciation still produces superior wealth outcomes versus renting long-term despite higher entry barriers requiring larger down payments and higher income thresholds for qualification.
Buy-now-pay-later services have proliferated offering 0% short-term financing as consumption debt enabler, though free interest doesn’t transform discretionary spending into productive investment—fundamentally remains consumption borrowing risking overspending beyond capacity despite convenient payment splitting and zero interest marketing obscuring cash flow impacts.
Interest rates have fluctuated with Federal Reserve policy affecting good-versus-bad thresholds marginally—what constituted “good rate” at 3% mortgages differs from 7% environment, though fundamental principles persist that lower rates better and borrowing for appreciating assets superior to consumption regardless of specific rate environment requiring context-adjusted evaluation.
Fundamental good-versus-bad-debt principles remain timeless: productive debt finances appreciating assets or income generation creating value exceeding interest costs, destructive debt funds consumption or depreciating purchases through high-interest borrowing creating obligations without corresponding wealth, interest rates critically impact classification transforming reasonable into destructive through excessive costs, and strategic debt usage enables major purchases and wealth building impossible through cash-only approaches—regardless of policy debates, housing affordability challenges, fintech innovation, or rate environment fluctuations, understanding asset type, purpose, interest cost, and value creation versus destruction produces superior borrowing decisions through framework distinguishing strategic wealth-building leverage from destructive consumption borrowing impossible without good-versus-bad classification literacy.
3 Things You Can Do Today
Ready to optimize debt strategy? Here are three simple steps you can take right now:
1. Categorize every current debt as good or bad using the 7-question framework creating strategic action plan – List all current debts: Credit cards (balances, APRs, what purchased), auto loans (terms, what purchased), student loans (degree, income impact), mortgage, personal loans. Apply framework to each: (1) What bought? (2) Appreciates, depreciates, or consumed? (3) Interest rate? (4) Generates income or increases earning? (5) Affordable payments? (6) Consequences if had saved instead? (7) Value exceeds total cost? Categorize results: GOOD DEBT list (mortgages on primary residence building equity, student loans for degrees increasing income, business loans generating revenue exceeding costs, low-rate auto loans for necessary transportation). BAD DEBT list (credit card balances for consumption at 18%+, payday loans, high-rate personal loans for discretionary spending, luxury auto loans over 12%). GRAY AREA list (context-dependent requiring evaluation). Create action priorities: GOOD DEBT—maintain scheduled payments, consider investing extra funds if rates under 5%, protect through on-time payments. BAD DEBT—aggressive elimination, debt avalanche method attacking highest APR first, temporary spending freeze redirecting all discretionary to payoff, consider balance transfers to 0% promotional rates. Example categorization outcomes: Mortgage $180,000 at 6% = GOOD (scheduled payments continue). Credit cards $6,000 at 22% = BAD (attack aggressively $400 monthly eliminating in 17 months saving $1,800 interest versus minimums). Auto $12,000 at 14% = BORDERLINE BAD (accelerate to $350 monthly versus $280 minimum). Takes 30 minutes creating strategic debt management approach distinguishing wealth-building from wealth-destroying obligations enabling appropriate action impossible when treating all debt identically.
2. Before any new borrowing, complete the 7-question evaluation determining good versus bad classification and alternatives – Upcoming borrowing consideration: Note specific purchase, amount, proposed terms (APR, payment, total cost including interest). Apply comprehensive framework: Question 1—What am I buying specifically? (Home, education, vehicle, vacation, furniture, etc.). Question 2—Will this appreciate, depreciate slowly, depreciate rapidly, or be consumed? (Research typical outcomes). Question 3—What’s the interest rate and how does it compare to benchmarks? (Under 5% excellent, 5-8% good, 8-15% questionable, 15-25% bad, over 25% predatory). Question 4—Will this generate income or measurably increase my earning capacity? (Quantify expected impact). Question 5—Can I comfortably afford payments without sacrificing essentials or other financial goals? (Calculate as percentage of gross income, all debt ideally under 36%). Question 6—What happens if I save and wait 6-18 months instead? (Job loss/health crisis/major consequence OR mere inconvenience/delayed gratification?). Question 7—Will total value created exceed total cost including all interest? (Calculate ROI: home equity gain, income increase, business profit versus total payments). Score results: 5-7 yes answers with appreciation/income generation = GOOD DEBT potentially justified. 2-4 yes answers or high rate = QUESTIONABLE requiring careful consideration. 0-1 yes answers with consumption/high rate = BAD DEBT avoid if possible. Example evaluation: $30,000 education loan for nursing degree at 5% enabling $35,000 to $70,000 income increase = Scores 6/7 yes (not consumption, appreciates through income, 5% reasonable, generates $35K additional income, $322 monthly affordable on $70K, delay costs years of higher earning, lifetime benefit $1.4M exceeds $36K total cost) = GOOD DEBT green light. $4,000 vacation on credit card at 20% paid over 3 years = Scores 0/7 yes (consumption, consumed, 20% high, no income, stretches budget, delay merely inconvenient, $5,200 total paid for $4,000 consumed) = BAD DEBT avoid. Takes 15 minutes preventing thousands in bad debt while enabling appropriate good debt impossible when borrowing reactively without systematic evaluation.
3. Calculate wealth difference between strategic good debt usage and all-debt avoidance or bad-debt accumulation revealing lifetime impact – Create three 30-year scenarios comparing outcomes: SCENARIO A (Strategic Good Debt)—Age 25 establish credit through card paid in full monthly ($600 annual rewards), age 28 purchase $250,000 home $50,000 down 6.5% mortgage ($1,485 monthly), home worth $650,000 age 58 (3.5% appreciation), equity $500,000+ (principal paid plus appreciation), rewards $18,000 over 30 years. Total wealth age 58: $500,000 home equity + $18,000 rewards + investments from career advancement = $650,000+ net worth. SCENARIO B (All-Debt Avoidance)—Age 25 avoid all borrowing including credit cards, save cash only, age 28 have $50,000 saved but denied mortgage (no credit), continue renting $1,800 monthly, age 58 paid $648,000 in rent over 30 years, no home equity, no rewards, savings $150,000 through disciplined saving. Total wealth age 58: $150,000 saved, zero home equity, zero rewards = $150,000 net worth. SCENARIO C (Bad Debt Accumulation)—Age 25 credit card debt for lifestyle $8,000 at 20% maintained through minimums, age 28 subprime mortgage attempt denied (credit damage), continues renting plus credit card debt, age 40 still $12,000 credit card debt cycling, paid $50,000+ in interest over 30 years, age 58 paid $648,000 rent plus $50,000 interest, minimal savings $40,000. Total wealth age 58: $40,000 saved, zero equity = $40,000 net worth. Wealth difference: Scenario A $650,000 versus Scenario B $150,000 = $500,000 wealth difference from strategic good debt versus avoidance despite equal earning and base spending. Scenario A $650,000 versus Scenario C $40,000 = $610,000 wealth difference from strategic good debt versus bad debt accumulation. Key insight: Strategic good debt creates $500,000-600,000+ additional wealth versus either blanket avoidance or bad debt patterns from understanding leverage appropriately applied to appreciating assets while avoiding consumption borrowing. Takes 20 minutes calculating lifetime impact creating visceral understanding of good-versus-bad distinction impossible through abstract concepts alone requiring quantified comparison revealing massive outcome differences from informed debt decisions.
These actions create good-versus-bad-debt mastery within 90 minutes—categorized current debts enabling strategic management approach ($2,000+ typical savings from appropriate prioritization), established systematic evaluation framework preventing future bad debt thousands in avoided interest, and calculated wealth impact revealing $500,000+ lifetime difference motivating strategic debt decisions—transforming debt from undifferentiated obligation or universal enemy into understood tool enabling wealth building through appropriate leverage while avoiding wealth destruction through consumption borrowing impossible without classification framework distinguishing strategic from destructive debt usage.
Quick FAQ
Is a mortgage always good debt?
Usually but not automatically—mortgages generally good debt when: (1) Home purchased as primary residence building equity versus rent alternative, (2) Price affordable with payment under 28-30% gross income, (3) Reasonable down payment (10-20%+) creating equity buffer, (4) Market stable or appreciating (not bubble), (5) Planning 5+ year occupancy allowing appreciation and transaction cost recovery. Mortgages become questionable or bad when: Payment exceeds 30% income creating financial strain, minimal down payment (under 5%) creating underwater risk, speculation on flipping short-term (transaction costs exceed benefits), declining market purchasing near peak, adjustable rates in rising rate environment creating payment shock risk. Example good mortgage: $250,000 home, $50,000 down, 6.5% fixed, payment $1,264 = 20% of $75,000 income, stable market, 10+ year planned occupancy = Builds $200,000+ equity over 30 years versus $540,000 rent paid. Example questionable mortgage: $400,000 home, $8,000 down (2%), 7% adjustable, payment $2,620 = 42% of $75,000 income, hot market near peak, 3-year flip plan = Underwater if market corrects, payment unsustainable, transaction costs exceed appreciation in short term. Context determines classification making automatic “mortgages are good debt” oversimplified without evaluating specific terms and circumstances.
Are student loans good debt or bad debt?
Depends entirely on degree ROI and debt amount relative to earning potential: GOOD when: Degree in high-earning field (engineering, nursing, computer science, accounting median $60,000-$80,000+), debt under 1x first-year expected salary ($40,000 debt for $45,000 starting salary acceptable), federal loans at reasonable rates (4-7%), clear employment path in degree field, high completion likelihood at reputable institution. Example good: $35,000 for engineering degree enabling $35,000 → $70,000 income increase, $377 monthly payment on $70,000 income = 6.4% (comfortable), debt paid in 10 years, lifetime benefit $1.4M additional earnings = 40:1 ROI. BAD when: Degree in low-earning field (median under $40,000), debt exceeds 1.5-2x first-year salary ($80,000 debt for $35,000 career), high-interest private loans (over 10%), uncertain employment in field, for-profit institution with poor outcomes, completion unlikely. Example bad: $75,000 for general studies degree leading to $32,000 retail management, $862 monthly payment = 32% of gross income (unsustainable), requires income-driven repayment extending to 20 years with growing balance through interest, lifetime struggling with debt burden versus benefit. Critical evaluation: Research median salaries in degree field, calculate debt-to-income ratio, evaluate federal versus private loan mix, assess employment rates and career paths for graduates—making informed decision requires honest ROI analysis not assumption that all education automatically good investment.
Can credit cards be good debt?
Only under specific usage creating zero interest costs: GOOD usage—Charge routine spending, pay FULL balance every month by due date avoiding interest entirely, earn 1-5% cash back rewards ($300-$600+ annually on $30,000 spending), build credit history through on-time payments, leverage superior fraud protection and purchase benefits. Total cost: $0 interest (grace period maintained), net benefit from rewards and protections. BAD usage—Carry balances paying interest ($5,000 average balance at 20% APR = $1,000 annual interest), minimum payments creating perpetual debt (15+ years payoff, interest exceeding principal), finance consumption through credit (vacations, dining, shopping paid over years). Total cost: Thousands in interest negating any rewards. Key distinction: Credit cards themselves neutral tools—strategic disciplined usage (pay in full monthly) creates net benefits through rewards without costs making “good,” while irresponsible usage (carrying balances) creates wealth destruction through high interest making “bad.” Same card, same person, different behavior creates opposite outcomes. Recommendation: Use credit cards ONLY if committed to full monthly payment discipline, otherwise stick to debit cards preventing debt accumulation through forced spending within means until discipline established.
What if I need to borrow but can only get high interest rates?
Indicates challenging credit situation requiring careful evaluation: Options ranked best to worst: (1) Improve credit first if possible delaying borrowing 6-12 months—often increases score enough for better rates saving thousands (example: 640 score to 700 score reduces auto loan from 14% to 7% saving $6,000 on $20,000 loan). (2) Credit union personal loans or payday alternative loans (28% max vs 200-400% payday loans) if emergency truly cannot wait. (3) Secured loans offering lower rates through collateral (home equity if homeowner, secured credit card if building credit). (4) Payment plans with creditors often zero interest better than any loan (medical bills, utilities, rent). (5) Side income generating cash avoiding borrowing entirely (DoorDash, selling items, overtime). AVOID: Payday loans (300-400% APR), title loans (200-300% risking vehicle), rent-to-own (effective 100%+ APR), cash advances (25-30% no grace period). If must borrow at high rate: Smallest amount possible, shortest term sustainable, immediate aggressive payoff plan, address root cause preventing future need (budget gaps, lack of emergency fund). Example: $1,000 emergency, only qualify for 18% personal loan—borrow $1,000, make $200 monthly payments (6 months payoff), total cost $1,057 ($57 interest). Simultaneously build $1,000 emergency fund over next 6 months preventing future high-rate borrowing. Better than payday loan costing $150-300 in fees for same $1,000. Reality check: High rates signal credit issues or predatory targeting—focus on credit improvement and emergency fund building making future borrowing unnecessary or enabling better rates through improved creditworthiness.
Should I pay off good debt early or invest the money instead?
Depends on debt interest rate versus investment return expectations creating mathematical decision: GENERALLY pay off debt early when: Interest rate exceeds 7-8% (guaranteed return through interest savings typically beats market risk-adjusted returns), debt creates emotional stress regardless of math (psychological benefit valuable), approaching retirement wanting debt-free status (risk reduction priority), variable rate debt in rising rate environment. GENERALLY invest instead when: Interest rate under 5% (market returns likely exceed guaranteed savings), mortgage under 4% especially (inflation partially offsets, tax deduction further reduces effective cost), decades until retirement (time for compounding), comfortable with debt psychologically, emergency fund established (investing beyond safety net not instead of). Example comparison: $20,000 extra available, $20,000 mortgage balance at 4% versus invest at 8% expected. Pay mortgage: Save $4,000 interest over remaining term (guaranteed). Invest: Grow to $43,000 in 20 years at 8% = $23,000 net gain versus mortgage payoff. Math favors investing by $19,000. Alternative: $20,000 credit card debt at 18% versus invest. Pay credit card: Save $18,000+ interest (guaranteed, high return). Invest: Might grow to $43,000 but paying 18% debt interest meanwhile (math favors debt payoff). Rule of thumb: Pay off debt over 7-8% aggressively, invest if debt under 5%, case-by-case evaluation 5-7% range based on risk tolerance and psychological factors. Always maintain emergency fund before aggressive debt payoff or investing—liquidity prevents forced borrowing in crisis.
Explore More in Money Basics
Disclosure
This article provides general educational information about debt evaluation frameworks and strategic borrowing concepts. Individual debt situations, appropriate borrowing decisions, and optimal strategies vary significantly based on circumstances including income, assets, credit, goals, and risk tolerance. “Good debt” and “bad debt” represent conceptual frameworks not guarantees of outcomes—all debt carries risks including potential default, credit damage, financial stress, and asset loss. This is not financial advice, recommendation of specific borrowing actions, or guarantee that any debt will produce positive outcomes. ROI examples and wealth projections represent hypothetical scenarios with assumptions about appreciation, income growth, and market returns—actual results vary and may differ substantially from examples. Home appreciation rates vary by market and time period. Education ROI depends on degree completion, field selection, job market conditions, and individual career trajectory. Business loan returns depend on business success. Consult qualified financial professionals for personalized guidance matching individual circumstances. Interest rate thresholds (good vs bad classifications) represent general guidelines not absolute rules—individual situations may warrant different evaluations. Tax implications vary by individual circumstances. Some “good debt” examples like mortgages and rental properties involve significant risks including market downturns, job loss, or property damage. Student loan examples assume degree completion and employment in field—dropout or career change alters outcomes. Debt-to-income ratios and affordability calculations represent general guidelines—individual budgets vary. Advertisements or sponsored content may appear within or alongside this content. All information presented independently for educational purposes only.