Category: Credit Management

  • 4.10 How to Avoid Debt Traps and Stay Financially Secure

    4.10 How to Avoid Debt Traps and Stay Financially Secure

    Debt traps are cyclical borrowing patterns where repayment becomes nearly impossible despite regular payments—characterized by high-interest rates, minimum payment structures favoring lender profits over principal reduction, and compounding mechanisms creating debt growth exceeding payment capacity making escape increasingly difficult over time. Common debt traps include credit card balances maintained through minimum-only payments taking 15+ years costing double original debt in interest, payday loans with 400% APRs requiring repeated borrowing creating perpetual debt cycles, buy-now-pay-later services stacking multiple payments creating cash flow crises, and predatory personal loans targeting desperate borrowers with 36% APRs plus origination fees compounding financial distress. Avoiding debt traps requires recognizing warning signs before borrowing (APRs over 20%, minimum payment options encouraging long repayment, fees exceeding 5% of borrowed amount, aggressive marketing to financially stressed populations), understanding true total costs through calculation revealing how $2,000 borrowed becomes $5,000 paid over years, and implementing alternative strategies addressing root causes of borrowing needs through emergency funds, budgeting, income increases, or strategic low-interest borrowing when absolutely necessary replacing high-cost predatory options destroying wealth through interest and fees.
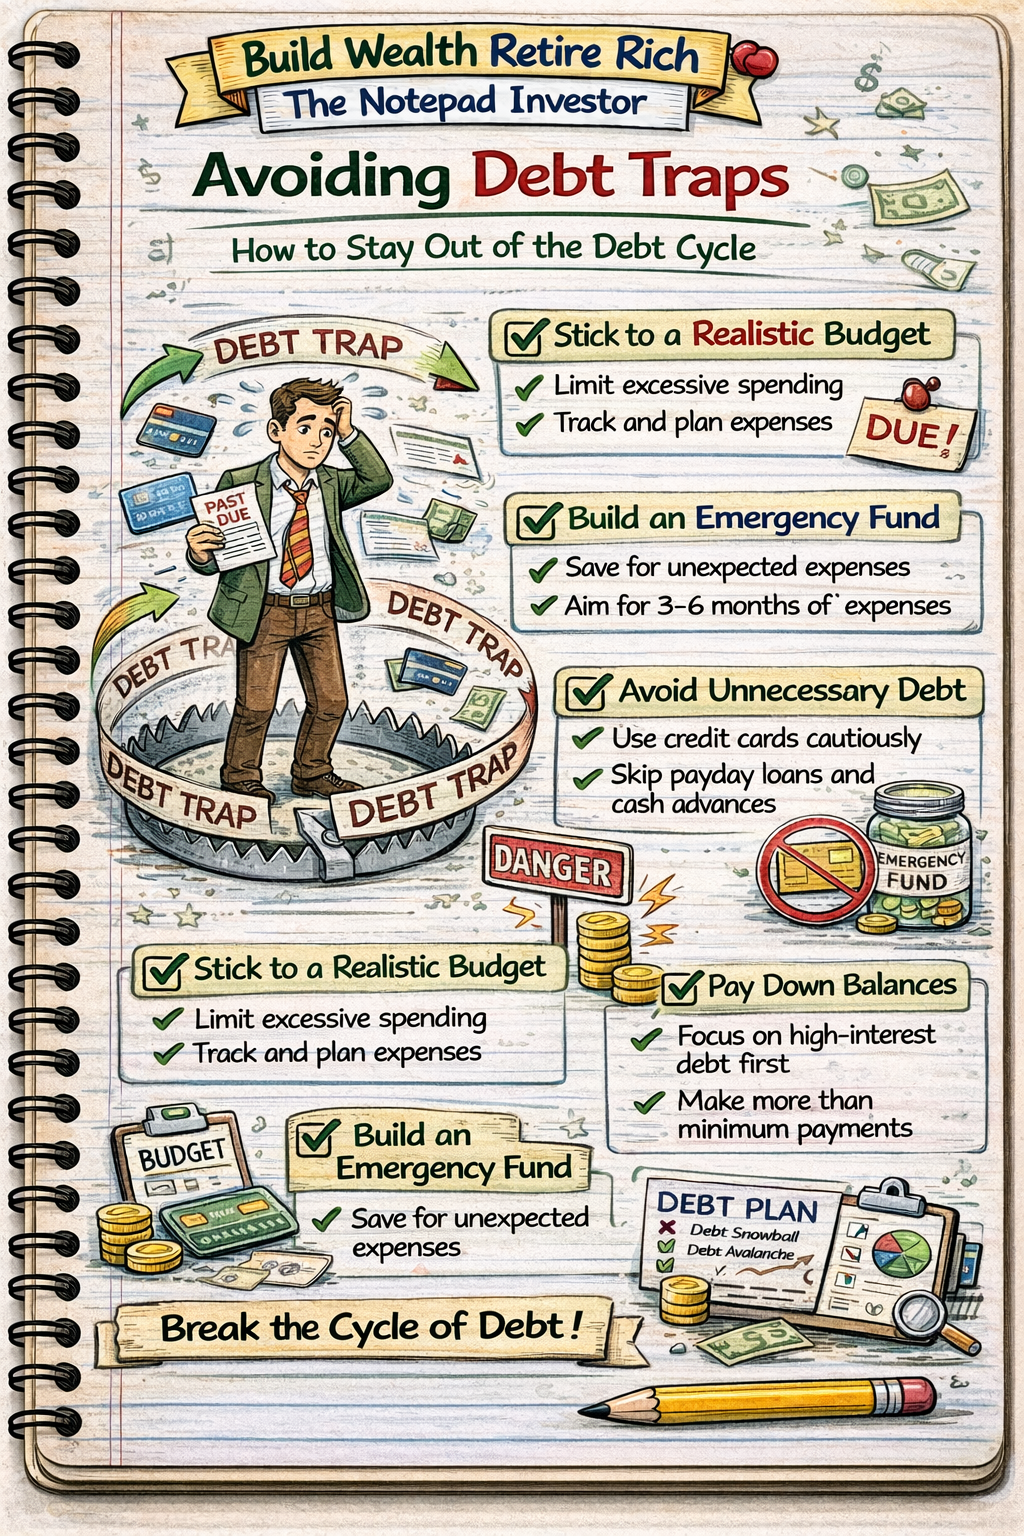
    Notebook sketch explaining personal finance

    This article is designed for anyone considering high-interest borrowing, individuals currently trapped in debt cycles seeking escape strategies, or those wanting comprehensive understanding of predatory lending tactics enabling avoidance. You do not need financial expertise to recognize debt traps—fundamental warning signs accessible through clear identification of high costs, impossible repayment structures, and predatory targeting, though requires willingness to examine borrowing decisions critically rejecting convenient high-cost options favoring delayed gratification and alternative solutions addressing underlying financial gaps through income increases, expense reductions, or emergency fund building preventing desperate borrowing creating long-term damage exceeding short-term relief provided by predatory debt products.

    Understanding debt trap avoidance matters because single payday loan often cascades into years of perpetual reborrowing costing thousands unnecessarily, credit card minimum payments create illusion of affordability while enriching issuers through compounding interest vastly exceeding purchases, and predatory personal loans target financial distress multiplying problems through fees and rates making repayment nearly impossible—while debt-trap-literate individuals recognize warning signs rejecting high-cost borrowing, implement emergency fund buffers preventing desperate borrowing decisions, and address root causes of financial gaps through sustainable solutions rather than temporary high-interest band-aids creating larger problems requiring additional borrowing perpetuating destructive cycles impossible to break without addressing underlying income-versus-expenses mismatches or lack of emergency reserves forcing crisis borrowing at predatory rates.

    Educational disclaimer: This article provides general educational information about predatory lending and debt trap avoidance. Individual borrowing situations, alternatives, and appropriate solutions vary significantly. This is not financial advice, debt counseling, or recommendation of specific actions. Consult qualified financial professionals for personalized guidance. Some borrowing situations may require professional intervention including credit counseling or bankruptcy consultation. Focus on addressing root causes of financial stress through sustainable solutions rather than symptom treatment through high-cost borrowing creating additional problems.

    Common Debt Traps Explained

    Credit Card Minimum Payment Trap

    How it works:

    • Minimum payment typically 1-3% of balance or $25-35 minimum
    • Appears affordable ($50 monthly on $2,000 debt seems manageable)
    • Majority of payment goes to interest not principal early in repayment
    • Compounding interest creates perpetual debt lasting decades

    Real cost example:

    • $5,000 credit card balance at 18% APR
    • Minimum payment: $125 monthly (2.5% of balance, decreasing over time)
    • Payoff timeline: 15 years, 3 months
    • Total interest paid: $6,068
    • Total amount paid: $11,068 (debt more than doubled)
    • Month 1 breakdown: $125 payment, $75 goes to interest, only $50 reduces principal

    Why it’s a trap:

    • Minimum payment deliberately designed to maximize issuer profits
    • Creates illusion of responsible debt management
    • Prevents meaningful principal reduction
    • Encourages continued spending while carrying balances
    • Escape requires aggressive payments 3-5x minimum amount

    Payday Loan Cycle

    How it works:

    • Short-term loan ($300-$500 typical) due next payday (2 weeks)
    • Flat fee structure: $15-30 per $100 borrowed
    • Appears small: “Just $45 fee to borrow $300”
    • Due in full on next payday including principal plus fee
    • Borrowers unable to repay renew loan paying fee again

    True cost calculation:

    • Borrow $300, fee $45 (15% for 2 weeks)
    • APR equivalent: 391% (15% × 26 two-week periods)
    • Next payday: Owe $345, can only afford to pay $45 fee and renew
    • Second renewal: Another $45 fee, still owe $300 principal
    • After 6 months (12 renewals): Paid $540 in fees, still owe $300 principal
    • Total cost to borrow $300 for 6 months: $840 ($300 + $540 fees)

    Why it’s a trap:

    • Average borrower takes 8-10 loans per year (repeat borrowing)
    • 73% of payday loan revenue from repeat borrowers
    • Borrowers physically unable to repay in 2 weeks (need money persists)
    • Creates cash flow crisis: Next paycheck minus loan payment leaves shortage forcing reborrow
    • Escape requires breaking cycle with alternative income or expense reduction

    Buy-Now-Pay-Later (BNPL) Stacking

    How it works:

    • Point-of-sale financing splitting purchases into 4 installments
    • Appears interest-free: “Pay $50 every 2 weeks for 8 weeks”
    • No credit check or minimal check encouraging usage
    • Easy to stack multiple BNPL across different merchants

    Stacking trap example:

    • Week 1: Buy $200 clothes (Afterpay), owe $50 every 2 weeks
    • Week 2: Buy $400 electronics (Klarna), owe $100 every 2 weeks
    • Week 3: Buy $300 furniture (Affirm), owe $75 every 2 weeks
    • Total biweekly obligation: $225 every 2 weeks for 8 weeks
    • Monthly cash flow impact: $450-500 from $900 total purchases
    • Income insufficient: Miss payment triggering $25-35 late fees per service

    Why it’s a trap:

    • Psychology: “Only $50” seems affordable ignoring cumulative effect
    • No centralized tracking across multiple BNPL providers
    • Autopay from checking creates overdraft risk when stacked
    • Late fees and potential credit reporting when payments missed
    • Encourages overspending beyond actual payment capacity

    Predatory Personal Loans

    Characteristics:

    • Target borrowers with poor credit unable to access traditional loans
    • APRs 24-36% (vs 8-18% for prime borrowers)
    • Origination fees 5-12% of loan amount deducted upfront
    • Short repayment periods (12-36 months) creating high monthly payments
    • Prepayment penalties discouraging early payoff

    Cost example:

    • Borrow $5,000 at 36% APR, 24-month term
    • Origination fee: $500 (10%), receive only $4,500
    • Monthly payment: $278
    • Total paid: $6,672 ($278 × 24 months)
    • Total cost: $6,672 paid minus $4,500 received = $2,172 in interest and fees
    • Effective cost: 48% of amount received

    Why it’s a trap:

    • High payments strain already stressed budgets
    • Borrowers often unable to complete repayment leading to default
    • Default triggers collections, credit damage, potential lawsuits
    • Marketing targets desperate financial situations
    • Creates additional financial stress rather than solving problems

    Auto Title Loans

    How it works:

    • Borrow against vehicle value (25-50% of value typical)
    • Surrender vehicle title as collateral
    • APRs 200-300% annualized
    • 30-day terms requiring full repayment or renewal
    • Failure to repay results in vehicle repossession

    Cost and risk example:

    • Vehicle worth $8,000, borrow $2,500
    • Monthly interest: 25% = $625
    • APR: 300%
    • Month 1: Owe $3,125, can only pay $625 interest and renew
    • After 6 months: Paid $3,750 in interest, still owe $2,500 principal
    • Miss payment: Vehicle repossessed, lose $8,000 asset to satisfy $2,500 debt

    Why it’s a trap:

    • Threatens essential asset (transportation for work)
    • Renewal cycle similar to payday loans
    • One in five borrowers loses vehicle to repossession
    • Creates transportation crisis compounding financial problems
    • Extremely high cost for small loan amounts

    Advertisement

    Financial Wellness Planner

    Warning Signs of Debt Traps

    Red Flag: Extremely High APR (Over 36%)

    APR benchmarks:

    • Reasonable rates: Mortgages 6-8%, auto loans 4-12%, personal loans 8-18%, credit cards 15-25%
    • Concerning rates: Credit cards 25-30%, personal loans 24-36%
    • Predatory rates: Payday loans 200-400%, title loans 200-300%, some installment loans 100%+

    Why high APRs signal traps:

    • Rates over 36% typically target desperate borrowers
    • Interest accumulation exceeds typical payment capacity
    • Designed for profit maximization not borrower success
    • Legal in many states despite consumer protection concerns

    Red Flag: Minimum Payment Structure

    Warning signs:

    • Emphasis on “low monthly payment” over total cost
    • Minimum payment under 5% of balance
    • Payment decreases as balance decreases (credit cards)
    • Long payoff timelines (10+ years) at minimum payments

    Why this signals trap:

    • Minimum payments deliberately maximize interest revenue
    • Creates affordable-appearing perpetual debt
    • Prevents meaningful principal reduction early
    • Benefits lender not borrower

    Red Flag: Excessive Fees

    Fee warning thresholds:

    • Reasonable: Origination fees 1-3%, no prepayment penalties, late fees $25-35
    • Concerning: Origination fees 5-8%, minimal prepayment penalties, late fees $35-50
    • Predatory: Origination fees 10%+, substantial prepayment penalties, late fees compounding, multiple fee types stacking

    Example fee stacking:

    • Payday loan: $300 borrowed, $45 fee (15%), $25 late fee if missed, $35 NSF fee if payment bounces
    • Single missed payment: $300 loan becomes $405 owed ($300 + $45 + $25 + $35)
    • Fees alone equal 35% of original loan in single incident

    Red Flag: Short Repayment Periods Creating Cash Flow Stress

    Dangerous repayment structures:

    • Full repayment due in 2-4 weeks (payday loans)
    • Balloon payments (small payments then large final payment)
    • Biweekly payments creating 26 payments annually vs 24
    • High monthly payments relative to income (over 15-20% of take-home)

    Why short terms create traps:

    • Borrower circumstances unlikely to change in weeks
    • Creates cash flow crisis next period forcing reborrow
    • Prevents gradual repayment allowing financial adjustment
    • Designed for renewal fees not successful repayment

    Red Flag: Aggressive Marketing to Financial Distress

    Predatory marketing tactics:

    • “Bad credit OK” or “No credit check required”
    • “Get cash today” or “Instant approval”
    • “No income verification” or “Guaranteed approval”
    • Located in low-income neighborhoods
    • Advertising during daytime TV, late night programming

    Why marketing signals predatory intent:

    • Targets financially vulnerable populations
    • Emphasizes speed and convenience over cost
    • Downplays or obscures true costs
    • Exploits desperation rather than providing sustainable solutions

    Calculating True Cost of Borrowing

    Total Cost Calculation Formula

    Complete cost analysis includes:

    • Principal amount borrowed (what you actually receive)
    • Total interest paid over full term
    • All fees (origination, late fees, renewal fees, prepayment penalties)
    • Opportunity cost (what else could money have been used for)

    Example comprehensive calculation:

    Predatory personal loan:

    • Loan amount: $3,000
    • Origination fee: $300 (10%)
    • Amount received: $2,700
    • APR: 36%, term: 24 months
    • Monthly payment: $167
    • Total payments: $4,008 ($167 × 24)
    • One late payment fee: $50
    • Total cost: $4,058 paid minus $2,700 received = $1,358 in interest and fees
    • Effective cost: 50% of amount actually received

    Alternative lower-cost option comparison:

    • Credit union personal loan: $3,000 at 12% APR, 24 months
    • No origination fee, receive full $3,000
    • Monthly payment: $141
    • Total paid: $3,384
    • Total interest: $384
    • Savings vs predatory loan: $974 ($1,358 – $384)

    Comparing Payment to Income

    Debt-to-income ratio guidelines:

    • Safe: Total debt payments under 36% of gross income
    • Manageable: 36-43% of gross income
    • Stressed: 43-50% of gross income
    • Dangerous: Over 50% of gross income

    Example debt-to-income assessment:

    • Gross monthly income: $3,000
    • Current debt payments: $900 (existing car loan, student loan)
    • Current ratio: 30% (manageable)
    • Considering additional $400 monthly payment (predatory loan)
    • New ratio: 43% ($1,300 ÷ $3,000)
    • Creates financial stress, minimal buffer for emergencies
    • Red flag: Taking loan would push into stressed category

    Breakeven Analysis

    When is borrowing worth the cost?

    Acceptable scenarios:

    • Emergency medical expense (health vs cost trade-off)
    • Vehicle repair essential for employment (income vs cost)
    • Investment in education increasing earning capacity (ROI positive)
    • Home repair preventing larger damage (prevention vs cure)

    Unacceptable scenarios:

    • Discretionary purchases (vacation, entertainment, non-essentials)
    • Covering routine expenses indicating budget mismatch
    • Paying other debt (robbing Peter to pay Paul)
    • Purchases affordable through delayed gratification and saving

    Decision framework:

    • Is expense truly unavoidable emergency or discretionary want?
    • What happens if don’t borrow? (Job loss, health crisis, or mere inconvenience?)
    • Can expense be reduced, delayed, or eliminated entirely?
    • Are there lower-cost alternatives (family loan, payment plan, community assistance)?
    • Will borrowing create larger problem than solves?
    Advertisement
    Reserved space for in-content ad

    Alternatives to High-Cost Borrowing

    Emergency Fund (Best Prevention)

    Emergency fund framework:

    • Starter fund: $500-1,000 (covers minor emergencies)
    • Intermediate fund: 1 month expenses (prevents most debt needs)
    • Full fund: 3-6 months expenses (comprehensive protection)

    Building emergency fund:

    • Start small: $25-50 per paycheck
    • Automate transfers to savings
    • Dedicate windfalls (tax refunds, bonuses)
    • Temporary spending cuts until $1,000 reached

    Impact:

    • $1,000 emergency fund eliminates 80% of payday loan need
    • Prevents desperate borrowing at predatory rates
    • Breaks crisis borrowing cycle

    Credit Union Loans and Payday Alternative Loans (PALs)

    Payday Alternative Loan characteristics:

    • $200-2,000 loan amounts
    • 28% APR maximum (vs 300-400% payday loans)
    • 1-12 month repayment terms
    • $20 maximum application fee
    • Available to credit union members (membership requirements vary)

    Cost comparison:

    • Borrow $500 for 3 months
    • Payday loan: $45 fee every 2 weeks × 6 renewals = $270 fees + $500 principal = $770 total
    • Credit union PAL: 28% APR = $22 interest + $20 fee + $500 principal = $542 total
    • Savings: $228 (30% less expensive)

    Payment Plans with Creditors

    Negotiation approach:

    • Contact creditor before payment due explaining hardship
    • Request payment plan splitting amount over 2-6 months
    • Many creditors prefer payment plan over non-payment
    • Often no interest or fees if arranged proactively

    Example successful negotiation:

    • $1,200 unexpected medical bill due in 30 days
    • Call provider requesting payment plan
    • Agree to $200 monthly for 6 months
    • Total cost: $1,200 (no interest or fees)
    • Alternative payday loan: $180 fees over 6 months plus $1,200 = $1,380
    • Savings: $180 from one phone call

    Side Income for Temporary Cash Needs

    Quick income options:

    • Gig economy: Uber, DoorDash, TaskRabbit ($100-300 weekly possible)
    • Sell unused items: Clothing, electronics, furniture ($200-1,000 one-time)
    • Freelance skills: Writing, design, tutoring ($20-100+ per hour)
    • Overtime at current job (time and a half)

    Comparison:

    • Need $500 for emergency
    • Payday loan option: $75 fee immediately, perpetual cycle risk
    • Side income option: 20 hours DoorDash at $15/hour = $300, 10 hours overtime at $30/hour = $300, total $600 in 2 weeks, no debt created
    • Benefit: Earn more than needed, avoid debt trap entirely

    Community Resources and Assistance

    Available resources:

    • Utility assistance programs (LIHEAP for energy bills)
    • Food banks and SNAP benefits (reduces grocery expenses)
    • Rent assistance programs (prevents eviction)
    • Medical bill charity care and sliding scale clinics
    • 211 helpline (connects to local resources)

    Strategic use:

    • Reduces essential expense burden
    • Frees cash for emergency needs
    • Prevents borrowing for basic necessities
    • Available regardless of employment status

    0% APR Credit Card Balance Transfers

    For existing debt consolidation:

    • Transfer high-interest balances to 0% promotional card
    • 12-21 month promotional periods typical
    • Balance transfer fee 3-5% (much less than high APR)
    • Aggressive payoff during 0% period

    Example debt escape:

    • $4,000 debt at 24% APR paying $200 monthly
    • Current path: 26 months payoff, $1,240 interest
    • Transfer to 0% card (18 months), 4% fee = $160
    • Pay $240 monthly = paid off in 17 months
    • Total cost: $4,160 ($4,000 + $160 fee)
    • Savings: $1,080 in avoided interest

    Escaping Existing Debt Traps

    Breaking the Payday Loan Cycle

    Step-by-step escape plan:

    Step 1: Stop new borrowing immediately

    • Refuse renewal on next payment date
    • Accept payment may bounce initially (one-time NSF fee vs perpetual cycle)
    • Commit to breaking cycle regardless of short-term pain

    Step 2: Request extended payment plan

    • Many states require lenders offer extended plans
    • Typically 60-90 days to repay without additional fees
    • Must request before renewal date

    Step 3: Find alternative income for final payment

    • Overtime, side gig, sell items
    • One-time effort breaking perpetual cycle
    • Family loan with repayment plan

    Step 4: Address underlying cash shortage

    • Budget analysis: Income vs expenses
    • Expense reduction or income increase required
    • Build $500 buffer preventing future crisis borrowing

    Accelerating Credit Card Payoff

    Debt avalanche method:

    • List all cards by APR highest to lowest
    • Pay minimums on all, extra payment to highest APR
    • When highest paid off, attack next highest
    • Mathematically optimal for interest minimization

    Increasing payment capacity:

    • Temporary spending freeze (delay all discretionary)
    • Side income directed entirely to debt
    • Sell assets (second vehicle, unused items)
    • Redirect raises/bonuses to debt vs lifestyle inflation

    When to Consider Professional Help

    Credit counseling (nonprofit):

    • Free or low-cost budget analysis and debt management
    • Debt management plans: Negotiate lower rates with creditors
    • Typical DMP: Consolidate payments, reduce rates to 8-12%
    • Find counselor: National Foundation for Credit Counseling (NFCC.org)

    When counseling appropriate:

    • Debt exceeds 50% of gross income
    • Juggling payments, robbing Peter to pay Paul
    • Considering bankruptcy but want alternatives
    • Underwater despite consistent payments

    Bankruptcy consideration:

    • Last resort for truly unmanageable debt
    • Chapter 7: Discharge unsecured debt, asset liquidation
    • Chapter 13: Repayment plan over 3-5 years
    • Consult bankruptcy attorney for evaluation
    • Major credit impact but may be best option for fresh start
    Advertisement
    Reserved space for in-content ad

    Why Understanding Debt Trap Avoidance Matters

    Without understanding debt traps, individuals fall into predatory borrowing cycles costing thousands unnecessarily through compound interest and fees, mistake minimum payments for responsible debt management enriching lenders while creating perpetual obligations, and miss alternative solutions addressing root causes through emergency funds or income increases—while debt-trap-literate individuals recognize warning signs rejecting high-cost borrowing exceeding 36% APRs, calculate true total costs revealing how $2,000 borrowed becomes $5,000 paid, and implement sustainable alternatives building emergency buffers preventing desperate borrowing or addressing underlying income-expense gaps, creating financial stability impossible when repeatedly trapped in high-interest debt cycles destroying wealth through fees and compounding interest benefiting predatory lenders not borrowers seeking temporary relief creating larger long-term problems.

    Understanding debt trap avoidance enables individuals to:

    • Recognize predatory lending warning signs before borrowing preventing trap entry
    • Calculate true borrowing costs revealing total amounts paid vs received
    • Identify alternative solutions addressing needs without high-interest borrowing
    • Escape existing debt traps through strategic payoff and cycle-breaking
    • Build emergency funds preventing future desperate borrowing
    • Understand minimum payment mathematics revealing perpetual debt design
    • Save thousands in avoided interest and fees through trap prevention

    Debt trap knowledge transforms borrowing from desperate crisis response into informed decision-making evaluating true costs, alternatives, and long-term impacts preventing wealth destruction through predatory interest rates and fee structures designed for lender profit not borrower success.

    Common Misunderstandings

    Many people assume payday loans provide necessary emergency access for those without alternatives. In reality, 73% of payday loan revenue comes from repeat borrowers trapped in cycles not one-time emergency users, average borrower takes 8-10 loans annually demonstrating dependency not occasional use, and alternatives including credit union PALs, payment plans, community resources, and side income provide superior solutions without 400% APRs, proving payday loans create perpetual debt not solve emergencies despite marketing emphasizing quick access and convenience obscuring true costs and cycle risks.

    Another common misconception is credit card minimum payments represent responsible debt management. In practice, minimum payments deliberately designed to maximize issuer profits through interest accumulation keeping balances persistent for decades—$5,000 balance takes 15+ years and $6,000+ interest with minimums versus 11 months and $500 interest with aggressive payments, proving minimums create illusion of affordability while enriching issuers through compounding interest vastly exceeding principal reduction early in payoff timeline making minimum-only approach responsible-appearing trap not sound financial strategy.

    Some believe debt consolidation loans always improve financial situations. However, consolidation loans replacing multiple debts with single payment at lower rate only help if root spending addressed—without budget changes consolidation frees credit limits enabling additional borrowing creating larger total debt, proving consolidation tool requiring discipline addressing underlying income-expense mismatches not automatic solution when old credit lines reused perpetuating cycle versus using consolidation as final borrowing paired with spending control preventing additional debt accumulation.

    How Debt Trap Avoidance Fits Into Financial Success

    Debt trap avoidance prevents wealth destruction through high-interest borrowing exceeding 36% APRs creating costs vastly exceeding original needs, enables building emergency fund buffers preventing desperate borrowing decisions, and creates sustainable financial patterns addressing root causes through income increases or expense management—making trap literacy essential component of financial stability impossible when repeatedly entering predatory borrowing cycles, understanding true total costs revealing how seemingly small fees accumulate to thousands, and implementing alternative solutions building long-term resilience versus short-term band-aids creating larger problems, transforming crisis management from reactive high-cost borrowing into proactive planning preventing emergency borrowing needs through preparation and strategic decision-making.

    For example, two individuals both age 25 facing unexpected $800 car repair essential for work. Person A lacks emergency fund and debt trap knowledge, walks into payday loan store borrowing $800, pays $120 fee (15% for 2 weeks). Next payday unable to repay $920 due to ongoing expenses, renews loan paying another $120 fee. Cycle continues: Every 2 weeks pays $120 renewal fee, still owes $800 principal. After 6 months (12 renewals): Paid $1,440 in fees, still owes $800 principal. Desperate, takes second payday loan $500 to help repay first, now owes $1,300 total with $195 biweekly fees ($120 + $75). After 12 months total paid in fees: $3,120 across both loans, still owes principals totaling $1,300. Finally escapes through tax refund paying off both loans. Total cost: $800 original need became $4,420 paid ($800 + $3,120 fees + $500 second loan) over 12 months of cycle. Person B faces identical $800 repair, understands debt trap risks, explores alternatives: Negotiates payment plan with mechanic ($200 monthly for 4 months, no interest), picks up weekend DoorDash earning $400 over 2 weeks, sells unused exercise equipment $200, borrows $200 from family with repayment plan. Total alternative income: $600, payment plan handles remaining $200 monthly. After 4 months: Paid $800 total for $800 repair (no fees, no interest), built side income habit continuing earning extra $200 monthly, establishes $500 emergency fund preventing future crisis. After 12 months: $800 repair handled, $500 emergency fund built, side income generated $2,400 additional (continuing beyond initial need), total financial position improved $2,900 versus Person A. Difference from identical starting emergency: Person A’s lack of trap knowledge cost $3,620 ($4,420 paid vs $800 actual need) plus 12 months stress and perpetual borrowing cycle, Person B’s trap literacy enabled $800 cost matching actual need plus $2,400 income gain and $500 buffer built creating $6,020 different financial outcome ($3,620 saved + $2,400 earned) from knowledge enabling alternative solutions versus default high-cost predatory borrowing.

    Debt trap understanding separates strategic problem-solvers finding sustainable alternatives from crisis borrowers repeatedly entering predatory cycles costing thousands through lack of knowledge about true costs, alternative solutions, and compound interest mathematics designed to enrich lenders while trapping borrowers in perpetual debt.

    Recent Updates and Trends

    In recent years, buy-now-pay-later services have proliferated offering point-of-sale financing as convenient credit card alternative, though creating similar debt trap risks through payment stacking across multiple providers without centralized tracking enabling overspending beyond payment capacity despite 0% interest marketing emphasizing convenience obscuring cumulative cash flow impacts.

    State-level payday loan regulations have tightened in some jurisdictions with 18 states plus DC prohibiting or severely restricting payday lending through 36% APR caps, though lenders adapt through online operations based in permissive states creating enforcement challenges and continued access despite local restrictions.

    Credit card minimum payment disclosure requirements now mandate statements showing “if you make only the minimum payment each month, you will pay off the balance shown in about X years” plus total interest cost, improving transparency though many consumers continue minimum payments despite stark warnings demonstrating information availability insufficient without financial literacy enabling comprehension.

    Earned wage access products have emerged allowing early access to earned wages before payday as payday loan alternative, though creating similar dependency risks when used repeatedly for routine expenses indicating underlying budget imbalances requiring income increases or expense reductions not timing shifts of existing income.

    Fundamental debt trap principles remain timeless: high interest rates exceeding 36% signal predatory intent, minimum payment structures deliberately maximize lender profits through perpetual debt, fees stacking creates costs vastly exceeding principal borrowed, and alternatives including emergency funds, payment plans, community resources, and side income provide superior solutions—regardless of product innovation, regulatory evolution, disclosure requirements, or earned wage access proliferation, understanding true costs, recognizing warning signs, and implementing sustainable alternatives produces superior outcomes through trap avoidance or escape impossible without literacy enabling informed decision-making rejecting predatory options despite aggressive marketing targeting financial desperation.

    3 Things You Can Do Today

    Ready to avoid or escape debt traps? Here are three simple steps you can take right now:

    1. Calculate the true total cost of any current high-interest debt revealing perpetual payment trap – For each payday loan, high-interest credit card, or predatory personal loan: Note amount owed, APR or fee structure, current payment amount. Use online debt payoff calculator inputting balance, APR, and payment. Review shocking results: Payoff timeline (often 10-20+ years for minimum payments), total interest paid (frequently 100-150% of principal), total amount paid (2-3x original debt typical). Example eye-opener: $3,000 credit card at 24% APR paying $75 minimums = 7 years payoff, $2,800 interest, $5,800 total paid (nearly doubled debt). Write down totals making invisible costs visible: “Current path: X years, $Y total interest, $Z total paid.” Calculate aggressive alternative: How much can actually pay monthly? Example: $200 monthly instead of $75 minimums = 19 months payoff, $580 interest, $3,580 total paid (saves $2,220 and 5+ years). Payday loan analysis: $500 loan with $75 biweekly fee if renewed 12 times over 6 months = $900 fees paid still owing $500 principal = $1,400 total for $500 borrowed (180% effective cost). Creates concrete understanding: Seeing “$2,800 wasted interest” or “$900 in fees for $500 loan” provides compelling motivation for aggressive payoff or cycle-breaking impossible without quantifying actual costs making abstract interest concrete. Takes 15 minutes per debt revealing true costs creating urgency for strategic action versus continuing unconscious perpetual payments.

    2. Start emergency fund with $25-50 per paycheck preventing future desperate borrowing at predatory rates – Open separate savings account designated “Emergency Fund Only” (prevents mixing with regular savings enabling spending), set up automatic transfer $25-50 per paycheck (biweekly = $50-100 monthly, semi-monthly = $50-100 monthly), commit to never touching except true emergencies. Timeline: $50 biweekly reaches $1,000 in 20 paychecks (10 months), $1,000 prevents 80%+ of payday loan scenarios. Define emergency beforehand preventing rationalization: True emergencies = job loss, medical crisis, essential vehicle repair, housing emergency. NOT emergencies = vacation, dining out, shopping, entertainment, routine predictable expenses. Boost progress: Direct all windfalls (tax refunds, bonuses, gift money) to emergency fund until $1,000 reached, temporary spending freeze on discretionary purchases accelerating timeline. Example acceleration: $50 biweekly + $600 tax refund + $200 birthday money + 3-month dining-out freeze saving $300 = $1,100 emergency fund in 5 months instead of 10. Impact: $1,000 buffer breaks payday loan cycle completely—instead of $800 emergency triggering $120 fee payday loan perpetual cycle costing $1,440+ in fees over 6 months, $1,000 fund covers emergency directly, replenish fund over 3-4 months through same $50 biweekly savings, total cost equals actual emergency not 180% markup. Takes 10 minutes setup creating permanent protection against predatory borrowing necessity saving thousands in avoided fees over lifetime through prevention versus repeated crisis borrowing.

    3. If currently in payday loan cycle, commit to breaking cycle next renewal refusing extension regardless of short-term pain – Current payday loan debt: Note amount owed including fees (example: $500 principal + $75 fee = $575 total due). Next renewal date: Mark calendar, commit to breaking cycle this date refusing renewal. Gather escape payment: Pick up side gig earning $300-400 over 2 weeks (DoorDash, overtime, TaskRabbit), sell unused items $100-200 (Facebook Marketplace, Pawn shop), request extended payment plan from lender (many states require 60-90 day option), borrow from family/friend with written repayment agreement ($50-100 monthly for 6 months better than $75 biweekly perpetual fees). Accept short-term consequences: One NSF fee if payment bounces ($35) vs $75 fee every 2 weeks indefinitely, temporary budget strain from lump payment vs permanent payment every 2 weeks, potential family conversation vs perpetual predatory cycle. Example escape: $575 owed, earn $400 DoorDash over 2 weeks, sell old furniture $150, pay off completely, total effort 20 hours side work + one selling task = freedom from cycle. Savings: $75 biweekly fee × 26 renewals (1 year) = $1,950 saved through one-time effort breaking cycle. Critical: Address underlying cash shortage after escape—budget analysis showing income vs expenses, spending cuts or income increases required preventing future crisis borrowing, build $500 buffer from continued side income or spending cuts. Takes 2 weeks concentrated effort creating permanent escape from perpetual cycle saving $1,950+ annually through breaking deliberate trap designed for renewal fees not successful repayment.

    These actions create debt trap avoidance and escape within 30 days—calculated true costs revealing perpetual payment traps motivating aggressive action ($2,000+ typical savings from acceleration), started emergency fund preventing future predatory borrowing ($1,000+ in avoided fees annually), and committed to payday loan cycle break saving $1,950+ annually through one-time escape effort—transforming debt from perpetual trap enriching predatory lenders into managed obligation eliminated through strategic action or prevented entirely through emergency preparation impossible without understanding true costs, alternative solutions, and cycle-breaking commitment.

    Advertisement
    Reserved space for in-content ad

    Quick FAQ

    Are payday loans ever a good option?
    Rarely justified given 300-400% APRs and perpetual cycle risks: Theoretical acceptable use = true one-time emergency (car repair for work, medical crisis) when no alternatives exist and borrower certain of repayment ability in 2 weeks without reborrow. Reality: 73% of payday revenue from repeat borrowers trapped in cycles not one-time users, average borrower takes 8-10 loans annually demonstrating dependency not emergency relief. Better alternatives nearly always available: Credit union payday alternative loans (28% APR max vs 400%), payment plans with creditors (often zero interest), side income (DoorDash, selling items), community assistance programs, family loans with repayment plans. Exception proving rule: Absolute emergency preventing work (vehicle repair) when paycheck guaranteed in 2 weeks, certain of full repayment including fee without financial strain, explored all alternatives unsuccessfully—represents under 10% of actual payday loan usage. Recommendation: Avoid payday loans entirely, build $1,000 emergency fund preventing 80%+ of scenarios creating payday loan consideration, use credit union PALs or payment plans for remaining emergency needs.

    How do I escape the payday loan cycle once trapped?
    Breaking cycle requires deliberate action accepting short-term discomfort for long-term freedom: Step 1—Stop renewing next payment date regardless of consequences (one NSF fee better than perpetual $75 biweekly fees). Step 2—Request extended payment plan from lender (many states require 60-90 day plans, ask specifically, put in writing). Step 3—Generate one-time income covering final payment through side gig (DoorDash, Uber, TaskRabbit 20-30 hours earning $300-500), sell unused items ($100-500 typical), overtime at current job, borrow from family with repayment plan better than perpetual predatory fees. Step 4—Address root cause preventing cycle restart through budget analysis showing income vs expenses, temporary spending freeze building $500-1,000 buffer, permanent spending reduction or income increase fixing underlying gap. Timeline: 2-4 weeks intensive effort generating escape payment, 3-6 months rebuilding buffer and addressing root cause. Critical success factors: Commitment refusing renewal despite short-term strain, willingness to hustle temporarily for escape, addressing underlying budget imbalance not just paying current debt. Alternative: Nonprofit credit counseling can negotiate extended plans and provide budget assistance (NFCC.org for counselor finder).

    Is it better to pay minimums on multiple debts or focus on one at a time?
    Focus on one debt while paying minimums on others (debt avalanche or snowball method) mathematically superior to equal payments across all: Debt avalanche (optimal)—Pay minimums on all debts, apply all extra payment to highest APR debt, when eliminated attack next highest APR, minimizes total interest paid. Debt snowball (psychological)—Pay minimums on all, attack smallest balance first regardless of APR, creates quick wins and motivation, slightly more total interest but better adherence for some. Example comparison: $10,000 total debt across 3 cards, $500 monthly payment available. Equal payment approach ($167 each card): 28-30 months payoff, $2,800 total interest. Avalanche approach (attack 24% card first, then 18%, then 12%): 24-26 months payoff, $2,200 total interest, saves $600 and 4 months. Snowball approach (attack smallest balance first): 25-27 months payoff, $2,400 total interest, saves $400, provides psychological wins. Both avalanche and snowball superior to equal payments—choose based on personality: analytical types prefer avalanche (maximum savings), motivation-driven types prefer snowball (quicker victories). Never continue minimum-only approach across all debts—guarantees maximum interest and longest timeline enriching lenders.

    Should I use a debt consolidation loan to pay off credit cards?
    Only if three conditions met: (1) Consolidation loan APR significantly lower than current debt (example: 12% consolidation vs 24% credit cards), (2) Committed to not reusing paid-off credit cards preventing additional debt accumulation, (3) Total cost including consolidation fees less than current path. Calculation example: $15,000 credit card debt at average 22% APR paying $500 monthly = 42 months, $5,800 interest. Consolidation loan $15,000 at 12% APR, 36 months, $500 monthly, 5% origination fee ($750) = $3,100 interest + $750 fee = $3,850 total cost (saves $1,950 vs credit cards). Red flags indicating consolidation harmful: Origination fees exceeding 8% (eat into savings), APR barely lower than current debt (minimal benefit), inability to commit to zero new credit card charges (will create larger total debt freeing credit limits). Success requirements: Close or freeze paid-off credit cards preventing reuse, address underlying spending habits through budget, treat consolidation as FINAL borrowing not intermediate step, automatic payments preventing default. Alternative if can’t meet conditions: Balance transfer to 0% promotional credit card (3-5% fee but zero interest 12-21 months) with aggressive payoff plan, nonprofit credit counseling debt management plan negotiating lower rates.

    How can I avoid falling into debt traps in the future?
    Prevention requires three-layer defense: Layer 1 (Emergency Fund)—Build $1,000 starter fund preventing 80% of crisis borrowing scenarios, eventually 3-6 months expenses for comprehensive protection, automate $50-100 monthly until target reached. Layer 2 (Budget Alignment)—Monthly budget showing income vs expenses honestly, spending not exceeding income creating debt need, identify and fix income-expense gaps through spending cuts or income increases before crisis forces borrowing, track spending ensuring alignment with plan. Layer 3 (Warning Sign Recognition)—Reject borrowing over 36% APR automatically (payday loans, title loans, predatory personal loans), calculate total cost before any borrowing (total paid vs amount received), avoid minimum payment traps paying credit cards in full monthly, recognize aggressive marketing targeting desperation (“bad credit OK,” “instant approval”). Additional protection: Establish borrowing decision framework (is this emergency vs want? what are alternatives? can I truly repay without reborrow?), build support network (family/friends for temporary help vs predatory lenders), maintain good credit enabling access to reasonable-rate options (credit union loans, 0% balance transfers) if emergency borrowing necessary. Mindset shift: View high-interest debt as permanent wealth destroyer not temporary problem solver, understand short-term relief creating long-term damage, commit to prevention through preparation not reaction through desperation borrowing. Implementation: Start today with first $25-50 toward emergency fund regardless of current debt situation, begin budget tomorrow tracking income and expenses, commit to rejecting any borrowing over 36% APR from this point forward.

    Explore More in Money Basics

    Disclosure

    This article provides general educational information about predatory lending practices and debt trap avoidance strategies. Individual debt situations, borrowing alternatives, and appropriate solutions vary significantly based on circumstances. APR ranges, fee examples, and cost calculations represent typical scenarios—actual terms vary by lender, location, and borrower qualifications. This is not financial advice, debt counseling, legal advice, or recommendation of specific actions. State regulations regarding payday loans, title loans, and other high-interest lending vary—check local laws. Alternative solutions presented (credit unions, payment plans, community resources) availability varies by location and individual eligibility. Debt consolidation effectiveness depends on specific circumstances and discipline avoiding new debt accumulation. Credit counseling agencies quality varies—verify nonprofit status and accreditation (NFCC.org or FCAA.org). Bankruptcy has serious long-term consequences—consult qualified bankruptcy attorney for evaluation. Escape timelines represent best-case scenarios with consistent behavior—actual results vary. Consult qualified financial professionals, credit counselors, or legal advisors for personalized guidance matching individual circumstances. Some situations may benefit from professional intervention including debt management plans or bankruptcy consultation. Focus on sustainable solutions addressing root causes rather than symptom treatment through additional borrowing. Product examples and company references presented for educational illustration only. Advertisements or sponsored content may appear within or alongside this content. All information presented independently for educational purposes only.


  • 4.9 How to Improve Your Credit Score Fast (Step-by-Step Guide)

    4.9 How to Improve Your Credit Score Fast (Step-by-Step Guide)

    Improving credit scores requires understanding the five weighted factors driving FICO calculations—payment history (35%), credit utilization (30%), length of credit history (15%), new credit (10%), and credit mix (10%)—then implementing targeted strategies addressing weak areas through specific actions producing measurable score increases within weeks to months depending on starting point and consistency. Unlike mysterious processes requiring years without visible progress, credit score improvement follows predictable patterns when proper behaviors applied systematically: paying all bills on time protects the largest scoring factor preventing catastrophic drops, reducing credit card utilization below 30% ideally below 10% often produces 30-60 point increases within one reporting cycle, keeping old accounts open maintains history length, spacing credit applications minimizes inquiry damage, and maintaining diverse account types optimizes credit mix—creating comprehensive improvement framework achieving excellent scores (740+) within 12-24 months from fair credit or 24-36 months from poor credit through consistent responsible behavior impossible without understanding factor weights enabling strategic prioritization focusing efforts where algorithms weight most heavily.

    Notebook sketch explaining personal finance

    This article is designed for anyone wanting higher credit scores for better loan rates, individuals recovering from credit damage through late payments or collections, or those building credit from scratch or thin files. You do not need perfect financial situations to improve scores—strategic behavior changes produce results regardless of income level or current score, though requires discipline maintaining new habits consistently over months creating gradual improvement through compounding positive behaviors outweighing past negatives, patience understanding that legitimate score improvement takes time not available through quick fixes or credit repair scams promising instant results, and knowledge prioritizing high-impact actions (payment history, utilization) over low-impact factors (credit mix) maximizing improvement per unit effort invested.

    Understanding how to improve credit scores matters because even modest increases save thousands in lifetime borrowing costs through lower interest rates, excellent scores enable approval for premium credit products and favorable terms denied to those with fair or poor credit, and strategic improvement prevents wasted effort on low-impact activities while focusing on behaviors producing maximum score gains—while score-improvement-literate individuals achieve 100+ point increases within 12-18 months through targeted utilization reduction and perfect payment records, understand quick timeline expectations by starting point (fair to good faster than poor to fair), and avoid credit repair scams recognizing legitimate improvement requires time and behavior changes not aggressive disputes or payment to third parties, creating efficient score optimization impossible without understanding scoring mechanics and strategic action prioritization.

    Educational disclaimer: This article provides general educational information about credit score improvement strategies. Individual score results vary based on complete credit profiles and starting points. Improvement timelines represent typical scenarios with consistent responsible behavior—actual results differ. This is not credit repair services or guarantee of specific score increases. Beware credit repair companies promising guaranteed results or rapid score increases—legitimate improvement requires time and cannot be guaranteed. Consult qualified financial professionals for personalized guidance. Focus on building positive credit behaviors benefiting long-term financial health rather than gaming scoring algorithms or attempting removal of accurate negative information.

    Understanding Your Starting Point

    Check Your Current Credit Score

    Free score sources:

    • Credit card issuers: Most provide free FICO scores to cardholders
    • Discover Credit Scorecard: Free FICO 8 for everyone (even non-customers)
    • Credit Karma: Free VantageScore 3.0 (TransUnion and Equifax)
    • Experian app: Free Experian FICO 8
    • Your bank or credit union: Many offer free scores

    Identify your score range:

    • 800-850 (Exceptional): Limited improvement needed, focus on maintenance
    • 740-799 (Very Good): Minor optimization possible, already excellent
    • 670-739 (Good): Improvement to 740+ achievable in 6-12 months
    • 580-669 (Fair): Improvement to 670+ achievable in 12-18 months
    • 300-579 (Poor): Improvement to 620+ achievable in 18-24 months

    Review Your Credit Reports

    Access free reports:

    • AnnualCreditReport.com: Official source for free annual reports
    • Request from all three bureaus: Equifax, Experian, TransUnion
    • Review for errors, fraudulent accounts, inaccuracies

    Identify improvement opportunities:

    • Payment history issues: Late payments, collections, charge-offs, bankruptcies
    • High utilization: Credit card balances near limits (over 30%)
    • Short history: Accounts opened recently (under 2 years average age)
    • Recent inquiries: Multiple hard pulls in last 6-12 months
    • Limited mix: Only credit cards or only loans (not diverse)
    • Errors: Accounts not belonging to you, incorrect information

    Set Realistic Improvement Goals

    Score increase expectations by starting point:

    Starting 580-620 (Poor/Fair):

    • 6 months: 30-50 point increase to 610-670 range with perfect behavior
    • 12 months: 60-80 point increase to 640-700 range
    • 24 months: 100-140 point increase to 680-760 range possible
    • Requires: Zero late payments, utilization reduction, time passage

    Starting 620-670 (Fair/Good):

    • 6 months: 40-60 point increase to 660-730 range
    • 12 months: 70-100 point increase to 690-770 range
    • Requires: Perfect payments, low utilization maintenance

    Starting 670-720 (Good):

    • 6 months: 20-40 point increase to 690-760 range
    • 12 months: 40-70 point increase to 710-790 range
    • Diminishing returns at higher scores (less room for improvement)
    Advertisement

    Financial Wellness Planner

    Priority 1: Perfect Payment History (35% of Score)

    Why Payment History Matters Most

    Largest scoring factor impact:

    • 35% of FICO score from payment history alone
    • Single 30-day late payment: 60-110 point drop typical
    • Recovery time: 18-24 months to fully recover from one late
    • Protection essential: Cannot improve if continuously damaging largest factor

    Preventing Late Payments

    Strategy 1: Automatic minimum payments (essential safety net)

    • Set up automatic minimum payment on ALL credit accounts
    • Prevents catastrophic late payment from forgetfulness
    • Still manually pay full balances but automatic minimum as backup
    • One-time 15-minute setup per account protects 35% of score permanently

    Strategy 2: Payment date consolidation

    • Call creditors requesting due date changes
    • Consolidate all payments to same date or two dates monthly
    • Example: All bills due on 1st and 15th (aligned with paychecks)
    • Easier tracking and management preventing missed payments

    Strategy 3: Calendar reminders and alerts

    • Calendar alerts 5 days before each payment due date
    • Email/text alerts from creditors when payment due
    • Low balance alerts preventing insufficient funds
    • Multiple redundancy systems preventing single point of failure

    Addressing Existing Late Payments

    Recent late payment (under 30 days):

    • Pay immediately preventing 30-day reporting threshold
    • Call creditor explaining circumstances, request courtesy adjustment
    • If first-time late, many creditors offer one-time forgiveness

    Reported late payment (30+ days late):

    • Cannot remove if accurate but can minimize future damage
    • Write goodwill letter to creditor requesting deletion (low success rate but worth trying)
    • Focus on perfect payment record going forward
    • Impact diminishes over time: Significant first 12 months, minimal after 24 months

    Collections or charge-offs:

    • Negotiate pay-for-delete before paying (creditor removes from report if paid)
    • Get agreement in writing before making payment
    • If pay-for-delete rejected, pay anyway (ethical responsibility, helps manual underwriting)
    • Paid status better than unpaid though score impact similar on older FICO versions

    Priority 2: Reduce Credit Utilization (30% of Score)

    Understanding Utilization Impact

    Utilization definition:

    • Per-card utilization: Balance ÷ credit limit on each card
    • Overall utilization: Total balances ÷ total credit limits
    • Both matter for scoring algorithms

    Utilization thresholds and score impact:

    • 1-9% utilization: Optimal for maximum scores (10-20 points higher than 30%)
    • 10-29% utilization: Good, minimal score impact
    • 30-49% utilization: Fair, noticeable score reduction (20-40 points lower)
    • 50-74% utilization: Poor, significant score damage (40-80 points lower)
    • 75-100% utilization: Very poor, major score reduction (80-120 points lower)

    Example utilization impact on same person:

    • $10,000 total credit limits, all other factors constant
    • $500 total balances (5% utilization): 760 score
    • $3,000 total balances (30% utilization): 730 score (30-point difference)
    • $7,000 total balances (70% utilization): 650 score (110-point difference from optimal)

    Fast Utilization Reduction Strategies

    Strategy 1: Aggressive balance paydown (fastest impact)

    • Identify cards over 30% utilization (highest priority)
    • Pay down to under 30%, ideally under 10%
    • Focuses available payment capacity on highest-utilization cards first
    • Results visible within one reporting cycle (30-45 days)

    Example paydown plan:

    • Card A: $4,500 balance, $5,000 limit (90% utilization) – Priority 1
    • Card B: $2,000 balance, $8,000 limit (25% utilization) – Maintain
    • Card C: $500 balance, $3,000 limit (17% utilization) – Maintain
    • Pay $4,000 to Card A bringing to $500 (10% utilization)
    • Score increase: 40-60 points typical from eliminating 90% utilization

    Strategy 2: Pay before statement closing date

    • Creditors report balance on statement closing date (not payment due date)
    • Pay down balances BEFORE statement closes for lower reported utilization
    • Example: $5,000 limit card, charge $2,000 monthly but pay $1,500 before statement closing
    • Reported balance: $500 (10% utilization) not $2,000 (40% utilization)
    • Enables heavy card usage without utilization penalty

    Strategy 3: Request credit limit increases

    • Call card issuers requesting credit limit increases
    • Many approve with soft inquiry (no score impact) for existing good customers
    • Increases denominator lowering utilization percentage
    • Example: $2,000 balance, $5,000 limit (40%) → limit increased to $8,000 = 25% utilization
    • Potential 15-25 point score increase from utilization improvement alone

    Strategy 4: Spread balances strategically

    • Instead of maxing one card while others sit at zero
    • Distribute balances keeping all cards under 30% ideally under 10%
    • Example: $6,000 total spending, three $10,000 limit cards
    • Bad: $6,000 on Card A (60%), Cards B and C at $0 → overall 20% but per-card 60% damages score
    • Good: $2,000 on each card (20% each) → overall 20%, all per-card 20% optimizes score

    Maintaining Low Utilization Long-Term

    Sustainable practices:

    • Pay balances in full monthly (ensures 0% reported if paid before statement)
    • Make multiple payments per month if heavy spender
    • Set personal utilization alerts (30% threshold warnings)
    • Budget ensuring spending doesn’t exceed payment capacity
    Advertisement
    Reserved space for in-content ad

    Priority 3: Build Credit History Length (15% of Score)

    How History Length Affects Scores

    Age metrics considered:

    • Age of oldest account
    • Average age of all accounts
    • Age of newest account

    Optimal age benchmarks:

    • 10+ years average: Excellent (maximizes this 15% factor)
    • 5-10 years average: Good
    • 2-5 years average: Fair (developing history)
    • Under 2 years average: Limited history (score ceiling around 680-720)

    Building History When Starting from Scratch

    Month 0: Open first credit account

    • Secured credit card if no approval for regular card ($200-500 deposit)
    • Student credit card if in college
    • Become authorized user on family member’s old account (instant history)

    Month 6: First credit score appears

    • Minimum 6 months history required for FICO score
    • Typical starting score: 640-680 with perfect payment record
    • VantageScore may appear after 1 month but FICO matters more for lending

    Month 12-18: Add second account

    • Apply for second credit card or small installment loan
    • Diversifies credit mix while building history
    • Score typically 680-720 range with perfect behavior

    Month 24-36: Achieve good-to-excellent scores

    • Average account age reaches 2-3 years
    • Score potential: 720-760+ with perfect payments and low utilization

    Protecting Existing History

    Keep old accounts open (critical):

    • Closing old accounts eventually lowers average age (after 10 years for FICO)
    • Immediately lowers average age for VantageScore
    • Reduces total credit limits increasing utilization
    • Score impact: 20-40 points from closing oldest account typical

    Maintaining unused cards:

    • Make small purchase every 6-12 months ($5-10)
    • Set up automatic recurring charge (streaming service) and automatic payment
    • Prevents issuer closure from inactivity
    • Costs zero while preserving account age and credit limits

    Authorized User Strategy (Fast History Boost)

    How it works:

    • Added to someone else’s credit card as authorized user
    • Account appears on your credit report with full history
    • Inherits account age and payment history
    • Instant average age boost if added to old account

    Example impact:

    • Your accounts: 1 year and 2 years old (average 1.5 years)
    • Added as authorized user to parent’s 15-year-old card
    • New average: (1 + 2 + 15) ÷ 3 = 6 years
    • Score increase: 30-60 points from history length boost

    Choosing the right account:

    • Old account (7+ years ideal, 10+ years excellent)
    • Perfect payment history (zero late payments)
    • Low utilization (under 30%, ideally under 10%)
    • Trustworthy person (their mismanagement affects your score)

    Managing New Credit and Inquiries (10% of Score)

    Hard Inquiry Impact

    Inquiry effects:

    • Each hard inquiry: 5-10 point temporary decrease
    • Multiple inquiries compound (3 inquiries = 15-30 point drop)
    • Recovery: 3-6 months back to pre-inquiry score
    • Remains on report: 2 years but only affects score first 12 months

    Strategic application timing:

    • Space credit card applications 6+ months apart
    • Avoid applications 6-12 months before major borrowing (mortgage, auto)
    • Use pre-qualification tools (soft pull, no score impact) before applying

    Rate shopping exception:

    • Multiple mortgage or auto loan inquiries within 14-45 days count as single inquiry
    • Enables rate shopping without penalty
    • Does NOT apply to credit cards (each application separate inquiry)

    New Account Opening Impact

    Effects of new accounts:

    • Lowers average account age (adds zero-age account to calculation)
    • Creates hard inquiry (5-10 points)
    • Signals new credit seeking (10% factor)
    • Combined initial impact: 10-25 points typical
    • Long-term benefit: Account ages over time, increases total credit limits

    Strategic new account approach:

    • Only open accounts when genuinely needed or strategically beneficial
    • Avoid store card offers at checkout (hard inquiry + minimal benefit)
    • Consider 6-12 month waiting period between new accounts
    • Recovery timeline: New account impact mostly recovered in 6-12 months as account ages

    Optimizing Credit Mix (10% of Score)

    Credit Mix Components

    Account types:

    • Revolving credit: Credit cards, HELOCs, lines of credit
    • Installment loans: Mortgages, auto loans, student loans, personal loans
    • Mix of both types demonstrates diverse credit management

    Optimal mix:

    • At least 2-3 credit cards (revolving)
    • At least 1-2 installment loans
    • Score benefit: 15-25 points from good mix vs credit cards only

    Building Mix Strategically

    Don’t force it (lowest priority factor):

    • Only 10% of score—smallest factor
    • Don’t take unnecessary loans just for “credit mix”
    • Natural accumulation over time (eventually get auto loan, mortgage)

    Credit builder loan option (if building from scratch):

    • Small loan ($300-1,000) specifically for credit building
    • Low cost, adds installment account to mix
    • Payments reported to bureaus building payment history simultaneously
    • Available through credit unions, online lenders

    Focus priority:

    • 80% effort on payment history (35%) and utilization (30%)
    • 15% effort on history length (15%)
    • 5% effort on new credit (10%) and mix (10%)
    Advertisement
    Reserved space for in-content ad

    Disputing Errors and Inaccuracies

    Common Errors Worth Disputing

    Account errors:

    • Accounts not belonging to you (identity mix-up or fraud)
    • Duplicate accounts (same account listed multiple times)
    • Incorrect balances or credit limits
    • Closed accounts showing as open

    Payment history errors:

    • Late payments marked incorrectly (you paid on time)
    • Payments applied to wrong account
    • Late payments exceeding 7-year reporting limit

    Personal information errors:

    • Wrong addresses creating account confusion
    • Incorrect Social Security number
    • Accounts from someone with similar name

    Dispute Process

    Steps to dispute:

    • 1. Identify specific error on credit report
    • 2. Gather supporting documentation (statements, receipts, correspondence)
    • 3. File dispute with bureau(s) showing error (online fastest, mail provides paper trail)
    • 4. Bureau investigates (30 days typically)
    • 5. Receive results and updated report

    What NOT to dispute:

    • Accurate negative information (real late payments you made)
    • Legitimate collections or charge-offs
    • Accurate public records (bankruptcies actually filed)
    • Disputes of accurate information waste time and won’t succeed

    Expected Results from Error Corrections

    Score impact of removals:

    • Incorrect late payment removed: 40-80 point increase typical
    • Fraudulent account removed: 30-100 points depending on account
    • Duplicate account removed: 10-30 points
    • Wrong credit limit corrected: 15-40 points if improves utilization

    Timeline and Expectations

    Realistic Improvement Timelines by Scenario

    Scenario 1: Fair credit recovering from late payments

    • Starting score: 620
    • Issue: 2-3 late payments in last 18 months, 45% utilization
    • Actions: Perfect payments from now on, reduce utilization to 8%
    • 3 months: 640 score (20-point increase from utilization reduction)
    • 6 months: 665 score (45-point increase, late payments aging)
    • 12 months: 700 score (80-point increase total)
    • 24 months: 740+ score (120+ points, late payments minimal impact)

    Scenario 2: Thin file building from scratch

    • Starting score: None (no credit history)
    • Actions: Open secured card, authorized user on 10-year-old account, perfect payments
    • 6 months: 680 score appears (authorized user boost plus own perfect record)
    • 12 months: 720 score (established history, perfect behavior)
    • 24 months: 750+ score (solid history, multiple accounts)

    Scenario 3: Good credit optimizing to excellent

    • Starting score: 700
    • Issue: 35% utilization, one 60-day late payment 3 years ago
    • Actions: Reduce utilization to 5%, request limit increases, maintain perfect payments
    • 3 months: 730 score (30-point increase from utilization)
    • 6 months: 750 score (50-point increase)
    • 12 months: 770 score (70-point increase, old late barely impacting)

    What You Can and Cannot Control

    Controllable factors (focus here):

    • Future payment behavior (can guarantee perfection)
    • Credit utilization (can reduce immediately)
    • New credit applications (can avoid or space strategically)
    • Keeping accounts open (simple decision)

    Time-dependent factors (patience required):

    • Account age (cannot accelerate, only preserve)
    • Negative item aging (7-10 years for removal, impact diminishes over 24 months)
    • Inquiry aging (12 months to stop affecting score)

    Uncontrollable past (acceptance needed):

    • Accurate late payments (cannot remove, only wait for aging)
    • Legitimate collections (can pay but reporting remains 7 years)
    • Bankruptcies (7-10 years reporting, impact fades over time)

    Why Understanding Credit Score Improvement Matters

    Without understanding how to improve credit scores, individuals waste effort on low-impact activities while neglecting high-leverage behaviors, fall victim to credit repair scams promising impossible instant results, and miss strategic opportunities like utilization reduction producing 30-60 point increases within weeks—while score-improvement-literate individuals prioritize payment protection (35% of score) and utilization reduction (30%) driving 65% of scores, understand realistic timelines by starting point preventing frustration from unrealistic expectations, and avoid wasted money on credit repair services recognizing legitimate improvement requires time and behavior changes not payment to third parties, creating efficient score optimization saving thousands in lower borrowing costs through strategic factor-weighted approach impossible without understanding scoring mechanics and improvement methodologies.

    Understanding how to improve credit scores enables individuals to:

    • Achieve 100+ point increases within 12-24 months through strategic behavior targeting
    • Prioritize high-impact actions (payment history, utilization) over low-impact factors
    • Set realistic expectations preventing frustration from impossible timeline assumptions
    • Avoid credit repair scams recognizing legitimate improvement cannot be guaranteed or rushed
    • Implement fast-result strategies like utilization reduction producing visible gains within weeks
    • Understand time-dependent factors requiring patience not immediate action
    • Save thousands in lifetime borrowing costs through excellent score achievement

    Credit score improvement knowledge transforms scores from mysterious unchangeable numbers into understood optimizable metrics responding predictably to strategic behaviors enabling deliberate improvement through factor-weighted approach impossible without understanding calculation mechanics and prioritization framework.

    Common Misunderstandings

    Many people assume credit repair companies can quickly remove accurate negative information for fees. In reality, legitimate companies can only dispute actual errors which consumers can do free themselves, accurate negative information legally reportable cannot be removed despite aggressive disputes, and credit repair scam companies promising guaranteed results or rapid score increases violate federal law (Credit Repair Organizations Act), proving credit repair services offer minimal value over free self-disputing for actual errors while charging $50-150 monthly creating unnecessary expense without guaranteed results.

    Another common misconception is closing credit cards improves scores by “reducing available debt.” In practice, closing cards immediately increases utilization (lower total credit limits with same balances) and eventually reduces average account age both damaging scores 20-40 points typically, proving keeping old cards open even if unused superior strategy maintaining high total credit enabling low utilization percentages versus closing based on false belief that unused credit represents risk when algorithms reward available credit not absolute limits.

    Some believe checking own credit score damages scores. However, self-checks through official channels (card issuers, Credit Karma, AnnualCreditReport.com) count as soft inquiries with zero score impact ever—only lender credit checks when applying for new credit (hard inquiries) affect scores modestly and temporarily, proving unlimited self-monitoring encouraged for tracking improvement impossible when avoided based on false belief that checking hurts creating vulnerability to undetected score changes or errors.

    How Credit Score Improvement Fits Into Financial Success

    Credit score improvement enables access to lowest-cost borrowing saving hundreds of thousands in lifetime interest through excellent scores, provides approval for premium opportunities denied to fair or poor credit holders, and creates financial flexibility through credit access at optimal terms—making score optimization essential component of comprehensive financial success requiring understanding of five weighted factors enabling strategic prioritization, realistic timeline expectations preventing frustration, and disciplined execution of high-impact behaviors (payment perfection, utilization reduction) producing measurable results within months creating borrowing cost advantages impossible without score knowledge and strategic improvement implementation.

    For example, two individuals both age 28 wanting to buy homes. Person A has 640 score from past financial struggles including late payments 2 years ago and current 55% credit card utilization on $8,000 total balances. Lacks improvement knowledge, continues paying minimums maintaining high utilization, assumes score unchangeable without years of waiting. Applies for mortgage age 30 with 645 score (minimal improvement from time passage only). Approved for $300,000 mortgage at 7.5% APR (subprime rate due to fair credit), monthly payment $2,098, total interest over 30 years $455,163. Person B starts identical situation age 28 with 640 score, same late payment history, same $8,000 balances at 55% utilization. Understands score improvement mechanics, creates strategic plan: Aggressively pays down credit card balances to $800 (10% utilization) over 6 months using side income and spending cuts, sets up automatic payments guaranteeing perfect payment record, requests credit limit increases on all cards further lowering utilization, becomes authorized user on parent’s 12-year-old account boosting average age. Timeline: 3 months score increases to 680 (utilization reduction primary driver), 6 months score reaches 710 (continued perfect payments, utilization maintenance, authorized user boost), 12 months score achieves 735 (combination of all factors plus late payment aging), 18 months score hits 755. Applies for mortgage age 30 with 755 score. Approved for same $300,000 mortgage at 6.25% APR (excellent credit rate), monthly payment $1,847, total interest over 30 years $364,806. Difference from Person A: $251/month lower payment ($2,098 vs $1,847), $90,357 less total interest over 30 years ($455,163 vs $364,806) from 110-point score improvement achieved in 18 months through strategic behavior targeting high-impact factors. Both started identical positions, Person A’s lack of improvement knowledge cost $90,000+ through accepting fair credit as unchangeable, Person B’s score literacy enabled strategic 110-point increase in 18 months saving over $90,000 through understanding utilization reduction (30% of score) and payment protection (35%) driving majority of score calculation making targeted improvement possible versus vague hoping for gradual improvement without strategic action.

    Credit score improvement understanding separates strategic optimizers achieving dramatic increases within months through factor-weighted approaches from passive hopers accepting current scores as fixed or falling victim to credit repair scams versus recognizing improvement requires knowledge, discipline, and time but produces measurable results when proper behaviors applied systematically.

    Recent Updates and Trends

    In recent years, FICO 10T and VantageScore 4.0 have incorporated trended data analyzing 24+ months of balance patterns rewarding those paying down debt and penalizing those building balances monthly, though adoption remains limited with most lenders using older FICO versions making trended data impact minimal for most consumers currently despite algorithmic improvements in newer models.

    Credit score transparency has improved with most major credit card issuers now providing free FICO scores to cardholders versus historical paid-only access, enabling better tracking of improvement efforts and earlier detection of score changes though creating confusion about score variations between monitoring and lending decision scores requiring model differentiation education.

    Alternative data integration has expanded through programs like Experian Boost allowing consumers to add utility and phone payments to reports potentially improving scores for thin-file consumers, though requiring opt-in and producing modest score impacts (typically 10-20 points) making it supplementary not primary improvement strategy.

    Credit repair regulation enforcement has intensified with FTC crackdowns on companies making false promises about guaranteed results or rapid score increases, though scam companies continue proliferating requiring consumer awareness distinguishing legitimate dispute assistance from illegal credit repair schemes.

    Fundamental improvement principles remain timeless: payment history (35%) and utilization (30%) drive majority of scores making them primary improvement targets, time heals negative items but strategic behavior accelerates improvement, and legitimate score increases require consistent responsible behavior over months not quick fixes or aggressive disputes—regardless of scoring model evolution, free score proliferation, alternative data expansion, or credit repair scam persistence, understanding five weighted factors, implementing strategic high-impact behaviors, and maintaining realistic timeline expectations produces superior outcomes through efficient improvement targeting highest-leverage factors impossible without scoring mechanics knowledge and disciplined execution.

    3 Things You Can Do Today

    Ready to improve your credit score? Here are three simple steps you can take right now:

    1. Check your current credit utilization and create immediate reduction plan if over 30% – Log into all credit card accounts documenting: Current balance, credit limit, calculate per-card utilization (balance ÷ limit), calculate overall utilization (total balances ÷ total limits). Identify problem areas: Any card over 50% (critical priority representing massive score drag), overall over 30% (action needed). Example current situation: Card A $4,000/$5,000 (80%), Card B $1,500/$8,000 (19%), Card C $500/$3,000 (17%), total $6,000/$16,000 (38% overall). Create paydown plan: Pay $3,500 to Card A bringing to $500 (10%), resulting overall 13% ($2,500/$16,000). Expected score impact: 40-60 points within one reporting cycle (30-45 days) from eliminating 80% utilization and bringing overall under 30%. Bonus strategy: Request limit increases on Cards B and C potentially increasing to $10,000 and $5,000 respectively making limits $21,000 total = 12% utilization even before additional payments. Takes 20 minutes identifying utilization creating concrete action plan producing fastest visible score improvement possible (30-60 points in weeks) versus all other strategies requiring months making utilization reduction highest-ROI immediate action for anyone over 30% utilization.

    2. Set up automatic minimum payments on ALL credit accounts preventing catastrophic score damage from missed payments – List every credit account: Credit cards, auto loans, student loans, personal loans, mortgages—everything reporting to credit bureaus. For each account: Log in online, navigate to automatic payment settings, configure automatic MINIMUM payment from checking account (not full payment unless certain balance will always be payable, minimum as safety net), verify checking account linked correctly, set payment date 2-3 days before due date. Enable backup systems: Low checking balance alerts (warns before automatic payment processes), payment confirmation emails (verifies processing), calendar reminders 5 days before payments as additional backup. This protects 35% of credit score (largest single factor) from catastrophic damage—single missed payment drops scores 60-110 points taking 18-24 months recovery versus 30 minutes one-time setup preventing disaster permanently. Still manually pay full balances targeting zero interest but automatic minimums as failsafe preventing human error, forgotten payments, or life disruptions (illness, travel, emergencies) from destroying scores through missed payment. Takes 15 minutes per account (total 60-90 minutes for most people) creating permanent protection of highest-weighted score factor impossible to recover from quickly if damaged making prevention through automation essential.

    3. Review credit reports from all three bureaus identifying and disputing any errors within 30 days – Visit AnnualCreditReport.com requesting reports from Equifax, Experian, and TransUnion (all three free annually). Download PDF copies for records. Review systematically: Personal information section (correct name, addresses, SSN?), account section (every account belongs to you? balances accurate? closed accounts not showing as open?), payment history (any late payments incorrectly marked?), inquiries (recognize all hard pulls?), collections and public records (any you don’t recognize or already paid but showing unpaid?). Common errors requiring disputes: Accounts from identity mix-up (similar names/addresses), duplicate accounts (same account listed twice), incorrect late payments (you paid on time but marked late), wrong balances or credit limits (affects utilization), information exceeding reporting limits (7 years most negatives, 10 years bankruptcies). File disputes immediately: Online at bureau websites (fastest), or certified mail (paper trail for serious issues), include supporting documentation (statements, receipts, correspondence). Expected results within 30 days: Error removed = 20-100 point score increase depending on error severity, or investigation confirms accuracy = item remains. Takes 60 minutes reviewing three reports, 15 minutes per dispute filed, potentially 40-100 points recovered if errors found and corrected making annual review essential for score optimization catching errors before they damage scores during loan applications when discovery too late for timely correction.

    These actions create immediate score improvement foundation within 2-3 hours—identified and planned utilization reduction producing 40-60 points within weeks (if currently over 30%), implemented automatic payment protection preventing 60-110 point catastrophic drops from missed payments (protecting 35% of score permanently), and reviewed reports filing disputes on any errors potentially recovering 40-100 points from corrections—transforming credit score from mysterious unchangeable number into actively managed optimized metric through strategic high-impact actions targeting largest scoring factors producing measurable improvements impossible without understanding factor weights and prioritization enabling efficient improvement.

    Advertisement
    Reserved space for in-content ad

    Quick FAQ

    How long does it take to improve credit score?
    Depends on starting point and issues addressed: Utilization reduction (if over 30%) = 30-60 point increase within one reporting cycle (30-45 days), fastest improvement available. New positive account opening = 6 months for first score impact, 12-24 months for solid improvement. Late payment recovery = Significant recovery in 3-6 months with perfect subsequent behavior, full recovery 18-24 months, remains on report 7 years but impact diminishes. Overall timeline by starting score: Fair (620-670) to good (670-740) = 12-18 months with perfect behavior, poor (below 620) to fair = 18-24 months, fair to excellent (740+) = 24-36 months. Key factors: Perfect payment record essential (single late payment sets back months), low utilization maintenance (under 30% ideally under 10%), time passage allowing negative items to age. Realistic expectations: 50-80 point increases achievable in 6-12 months with strategic behavior, 100+ point increases possible in 12-24 months, avoid credit repair promises of guaranteed or rapid increases (scams).

    Can credit repair companies really improve my score quickly?
    No—legitimate credit repair companies can only dispute errors which you can do free yourself, accurate negative information cannot be removed despite aggressive disputes, and companies promising guaranteed results or rapid score increases violate federal law (Credit Repair Organizations Act prohibiting misleading promises). Reality: Credit repair companies charge $50-150 monthly to submit disputes you could file free at AnnualCreditReport.com or bureau websites directly, success limited to actual errors not legitimate negative items, most consumers can self-dispute effectively without paying services. Legal requirements: Cannot charge fees before services rendered, must provide written contract with cancellation rights, cannot make false claims about capabilities. Red flags indicating scam: Guaranteed score increases, promises to remove accurate negative information, demands upfront payment, suggests creating new credit identity (illegal). Better approach: Check credit reports yourself identifying actual errors (wrong accounts, incorrect payments, outdated information), file free disputes directly with bureaus, implement strategic improvement behaviors (utilization reduction, payment protection) producing legitimate increases versus paying hundreds for minimal value disputing accurate information unsuccessfully.

    What’s the fastest way to increase credit score?
    Reduce credit card utilization if currently over 30%—typically produces 30-60 point increase within 30-45 days (one reporting cycle): Calculate current utilization (balances ÷ limits), pay down high-utilization cards to under 30% ideally under 10%, request credit limit increases raising denominators, results visible within one statement cycle when lower balances reported. Example: $8,000 balances on $10,000 limits (80% utilization damaging score 60+ points), pay down $6,000 bringing to $2,000 (20% utilization) = 40-60 point increase within 6 weeks. Second fastest: Dispute actual errors on credit reports (wrong accounts, incorrect late payments) = results within 30 days, potential 40-100 point increase if significant errors corrected. Third: Become authorized user on old account with perfect history = immediate history boost, 30-60 point increase within 1-2 reporting cycles. Slowest but essential: Perfect payment record protecting 35% of score (single late payment drops 60-110 points), keeping old accounts open maintaining history length. Time required: Utilization reduction if over 30% produces fastest measurable results (weeks not months), other strategies require 3-24 months depending on starting point and consistency.

    Should I close credit cards I’m not using to improve my score?
    No—closing cards typically damages scores not improves: Immediately reduces total credit limits increasing utilization percentage (example: $2,000 balances, close $5,000 limit card reducing total limits from $15,000 to $10,000, utilization increases from 13% to 20% potentially dropping score 15-25 points), eventually reduces average account age when closed account falls off report (10 years for FICO, immediate for VantageScore), removes positive payment history contribution. Score impact from closing: 20-40 points typical especially if closing oldest or highest-limit card. Better strategy: Keep old no-annual-fee cards open indefinitely, make small purchase every 6-12 months preventing issuer closure from inactivity ($5-10 charge with automatic payment setup), costs zero while preserving credit limits (enables low utilization) and account ages (maximizes history length). Exception where closing acceptable: High annual fee card ($450+) not providing value justifying cost, multiple similar cards creating unmanageable complexity when have several no-fee alternatives. General rule: Keep old cards open, only close newest cards if absolutely necessary, never close oldest account or highest-limit card as these provide maximum score benefit through history length and utilization optimization.

    How much will becoming an authorized user improve my score?
    Typically 30-60 points if added to old account with perfect history though varies by starting score and account characteristics: Authorized user strategy adds account to your credit report inheriting full history and payment record instantly. Impact depends on: Account age (adding 10+ year account to thin file creates substantial average age boost versus adding 2-year account minimal impact), your current average age (1-year average boosted to 5-year average = significant vs 8-year average to 9-year average = minimal), payment history (perfect record helps, late payments hurt), utilization on account (low utilization better than high). Example high-impact scenario: Starting thin file with 1-year average age, added to 15-year-old card with perfect history and 10% utilization = 40-60 point increase bringing score from 680 to 720-740 range. Example low-impact scenario: Already established 8-year average age, added to 5-year-old account = 10-20 point increase (account younger than current average, minimal boost). Risks: If authorized user account develops late payments or high utilization, damages your score (choose trustworthy person managing account responsibly), some lenders discount authorized user accounts in manual underwriting (less weight than individually owned accounts). Best practice: Choose oldest account possible (10+ years ideal) with perfect history and low utilization from trustworthy family member for maximum impact.

    Explore More in Money Basics

    Disclosure

    This article provides general educational information about credit score improvement strategies and timelines. Individual score results vary significantly based on complete credit profiles, starting points, consistency of behavior changes, and other factors. Improvement timelines represent typical scenarios with perfect behavior—actual results differ. Score increase ranges represent averages—some individuals experience larger or smaller changes. This is not credit repair services, guarantee of specific score improvements, or financial advice. Credit Repair Organizations Act prohibits companies from making guarantees about score improvements or charging upfront fees. Beware credit repair scams promising guaranteed results or rapid increases—legitimate improvement requires time and consistent behavior changes. Dispute processes and timelines represent general guidelines—actual experiences vary by bureau and situation. Authorized user strategy effectiveness varies—some lenders discount authorized user accounts. Free credit score sources provide monitoring scores potentially differing from lending decision scores. Utilization impact estimates based on research and typical scenarios—individual results vary. Consult qualified financial professionals or credit counselors for personalized guidance matching individual circumstances. Focus on building sustainable positive credit behaviors rather than attempting quick fixes or gaming scoring algorithms. Product recommendations and strategies presented for educational purposes only. Advertisements or sponsored content may appear within or alongside this content. All information presented independently for educational purposes only.
  • 4.8 Credit Card Interest Explained: Why It Can Keep You in Debt for Years

    4.8 Credit Card Interest Explained: Why It Can Keep You in Debt for Years

    Interest on credit cards represents the cost of borrowing money when balances remain unpaid beyond grace periods—calculated daily through dividing Annual Percentage Rate (APR) by 365 creating daily periodic rate multiplied by average daily balance then compounded continuously resulting in monthly interest charges added to outstanding balances. Ranging typically from 15-29.99% APR depending on creditworthiness and card type, credit card interest rates dramatically exceed other consumer debt (mortgages 6-8%, auto loans 4-12%, personal loans 8-18%) making credit cards most expensive borrowing method when balances carried monthly rather than paid in full during 21-25 day grace periods avoiding interest entirely. Understanding interest mechanics reveals true cost of minimum payments creating debt persistence—$5,000 balance at 18% APR paying only minimums takes 15+ years and $6,000+ total interest versus aggressive $500 monthly payments eliminating debt in 11 months with $500 interest, demonstrating how payment strategy dramatically affects total costs making interest calculation knowledge essential for anyone carrying balances or considering charging purchases beyond immediate payoff capacity.

    Notebook sketch explaining personal finance

    This article is designed for anyone carrying credit card balances paying interest monthly, individuals wanting to understand true costs of minimum payments, or those seeking strategies eliminating interest charges through payoff acceleration or balance transfers. You do not need mathematical expertise to understand credit card interest—fundamental calculation concepts accessible through clear examples and explanations, though requires attention to compounding mechanics and payment timing revealing how seemingly manageable minimum payments create perpetual debt through interest exceeding principal reduction early in payoff timeline making aggressive payment strategy essential for debt elimination impossible through minimum-only approach maintaining balances indefinitely while enriching card issuers through continuous interest revenue.

    Understanding credit card interest matters because minimum payment trap keeps balances persisting for decades costing thousands in total interest, grace period mechanics reveal how to avoid all interest through full monthly payments, and strategic payoff methods (avalanche vs snowball) optimize interest minimization saving hundreds to thousands versus random payment approaches—while interest-literate individuals either avoid interest entirely through disciplined full payments or aggressively eliminate existing balances through understanding true costs and strategic acceleration, creating savings of thousands in avoided interest costs versus those carrying balances indefinitely through minimum payments lacking understanding of compounding mathematics making debt elimination nearly impossible without payment strategy changes addressing root causes of balance accumulation.

    Educational disclaimer: This article provides general educational information about credit card interest calculations and costs. Individual card APRs, terms, and calculation methods vary by issuer. Interest rate ranges represent typical market rates—actual rates depend on creditworthiness and card type. This is not financial advice, credit counseling, or debt management services. Consult qualified financial professionals for personalized guidance. Focus on legitimate payoff strategies through increased payments and spending control rather than attempting interest avoidance through payment timing manipulation or balance transfer churning creating additional fees and complexity.

    How Credit Card Interest Works

    Annual Percentage Rate (APR)

    APR definition:

    • Yearly cost of borrowing expressed as percentage
    • Standard comparison metric across credit products
    • Includes interest rate plus some fees (varies by card)
    • Not same as interest rate but often used interchangeably for credit cards

    Typical APR ranges by creditworthiness:

    • Excellent credit (750+ score): 15-18% APR
    • Good credit (670-749): 18-22% APR
    • Fair credit (580-669): 22-25% APR
    • Poor credit (below 580): 25-29.99% APR or denied

    Variable vs fixed APR:

    • Variable APR (most cards): Prime rate + margin (example: 11% prime + 13% margin = 24% APR), changes when Federal Reserve adjusts rates
    • Fixed APR (rare): Doesn’t fluctuate with prime rate but issuer can change with 45-day advance notice

    Daily Periodic Rate Calculation

    Converting APR to daily rate:

    • Formula: APR ÷ 365 days = Daily Periodic Rate (DPR)
    • Example: 18% APR ÷ 365 = 0.0493% daily rate
    • Expressed as decimal: 0.18 ÷ 365 = 0.000493

    Why daily rate matters:

    • Credit cards calculate interest daily not monthly
    • Each day’s balance × daily rate = that day’s interest charge
    • Daily interest added to balance creating compounding
    • 30-day month accumulates 30 separate daily interest charges

    Average Daily Balance Method

    Standard calculation approach used by most issuers:

    Step-by-step calculation:

    • 1. Track balance each day during billing cycle
    • 2. Sum all daily balances
    • 3. Divide sum by number of days in cycle = average daily balance
    • 4. Multiply average daily balance × daily periodic rate × days in cycle = monthly interest

    Example calculation:

    • Billing cycle: 30 days
    • Starting balance: $2,000 (days 1-15)
    • $500 payment made day 15, new balance $1,500 (days 16-30)
    • Sum of daily balances: ($2,000 × 15 days) + ($1,500 × 15 days) = $30,000 + $22,500 = $52,500
    • Average daily balance: $52,500 ÷ 30 days = $1,750
    • APR: 18%, daily rate: 0.000493
    • Monthly interest: $1,750 × 0.000493 × 30 = $25.88

    Compounding Effect

    How interest compounds daily:

    • Day 1: $2,000 balance × 0.000493 = $0.99 interest added
    • Day 2: $2,000.99 balance × 0.000493 = $0.99 interest (slightly higher from compounding)
    • Day 30: Total interest accumulated approximately $30 on $2,000 balance
    • Next month: Interest charged on $2,030 balance if not paid, compounding continues

    Long-term compounding impact:

    • $5,000 balance at 18% APR with no payments
    • Year 1: $5,000 grows to $5,978 ($978 interest)
    • Year 2: $5,978 grows to $7,053 ($1,075 additional interest)
    • Year 5: Original $5,000 becomes $11,423 ($6,423 total interest)
    • Demonstrates debt explosion without payments addressing accumulation
    Advertisement

    Financial Wellness Planner

    Grace Periods and Avoiding Interest

    How Grace Periods Work

    Grace period definition:

    • Time between statement closing date and payment due date
    • Typically 21-25 days
    • Interest-free period if balance paid in full by due date
    • Only applies to purchases (not cash advances or balance transfers)

    Example grace period timeline:

    • January 1-31: Billing cycle, make purchases totaling $1,500
    • January 31: Statement closes showing $1,500 balance
    • February 1-25: Grace period (25 days)
    • February 25: Payment due date
    • If pay $1,500 by February 25: Zero interest charged on purchases

    Maintaining Grace Period

    Requirements for grace period:

    • Pay previous statement balance in full by due date
    • Card starts with grace period (some cards for poor credit lack grace periods)
    • Not carrying balance from previous cycle

    How grace period is lost:

    • Carry balance from previous statement (pay less than full amount)
    • Grace period lost on new purchases immediately
    • Interest begins accruing on new purchases from transaction date
    • Remains lost until balance paid to zero and full payment made

    Example of losing grace period:

    • January statement: $1,500 balance
    • Pay $1,000 instead of $1,500 (carry $500 balance)
    • February purchases: $800 charged, interest begins immediately
    • February interest: Charged on $500 carried + $800 new purchases from transaction dates
    • Even though made $1,000 payment, grace period lost by not paying full statement balance

    Regaining Grace Period

    Steps to restore grace period:

    • 1. Pay balance to zero (all charges and interest)
    • 2. Pay next statement balance in full by due date
    • 3. Grace period restored for following billing cycle
    • Typically takes 1-2 billing cycles to fully restore

    Zero interest strategy:

    • Treat credit card like debit card: Charge only what you can pay in full
    • Pay full statement balance every month without exception
    • Grace period maintained indefinitely
    • Zero interest paid ever while earning rewards

    The Minimum Payment Trap

    How Minimum Payments Are Calculated

    Typical minimum payment formulas:

    • Percentage method: 1-3% of balance (whichever greater: percentage or fixed minimum)
    • Interest plus percentage: All interest + 1% of principal
    • Fixed minimum: $25-$35 if percentage calculation yields less

    Example minimum calculation:

    • Balance: $3,000
    • APR: 18% (1.5% monthly interest = $45)
    • Minimum: Greater of 2% of balance ($60) or $25
    • Required minimum payment: $60

    True Cost of Minimum Payments

    $5,000 balance at 18% APR, minimum payments only:

    • Minimum payment starts at $125 (2.5% of balance)
    • Monthly interest: $75 initially
    • Principal reduction: Only $50 first month ($125 – $75 interest)
    • Payoff time: 15 years, 3 months
    • Total interest paid: $6,068
    • Total amount paid: $11,068 ($5,000 + $6,068)

    Why minimum payments keep debt persistent:

    • Early months: Majority of payment goes to interest not principal
    • Example month 1: $125 payment, $75 interest, $50 principal
    • Balance reduces slowly: $5,000 → $4,950 after month 1
    • As balance decreases, minimum payment decreases proportionally
    • Lower payments mean even slower principal reduction
    • Creates self-perpetuating cycle keeping debt alive for decades

    Aggressive Payment Comparison

    Same $5,000 at 18% APR with different payment strategies:

    Minimum only ($125 starting, decreasing):

    • Time: 15 years, 3 months
    • Total interest: $6,068
    • Total paid: $11,068

    Fixed $150 monthly:

    • Time: 4 years, 7 months
    • Total interest: $3,148
    • Total paid: $8,148
    • Savings vs minimum: $2,920 interest, 10+ years faster

    Fixed $300 monthly:

    • Time: 1 year, 10 months
    • Total interest: $888
    • Total paid: $5,888
    • Savings vs minimum: $5,180 interest, 13+ years faster

    Fixed $500 monthly:

    • Time: 11 months
    • Total interest: $502
    • Total paid: $5,502
    • Savings vs minimum: $5,566 interest, 14+ years faster

    Key insight: Doubling payment more than halves total interest and time

    Breaking the Minimum Payment Cycle

    Payment acceleration strategies:

    • Pay same amount monthly even as minimum decreases
    • Add $25-50 to minimum payment creating faster principal reduction
    • Make bi-weekly payments (26 half-payments = 13 full payments annually vs 12)
    • Apply windfalls (tax refunds, bonuses) directly to principal
    • Round up payments (minimum $127 → pay $150 or $200)
    Advertisement
    Reserved space for in-content ad

    Multiple APRs on Single Card

    Purchase APR

    Standard rate for regular purchases:

    • Applies to everyday purchases (groceries, gas, retail)
    • Benefits from grace period if balance paid in full
    • Typically lowest APR on card (15-25% range)

    Cash Advance APR

    Higher rate for cash withdrawals:

    • Typically 25-30% APR (higher than purchase rate)
    • No grace period—interest starts immediately from transaction date
    • Cash advance fee: 3-5% of amount or $10 minimum
    • Extremely expensive borrowing method

    Example cash advance cost:

    • Withdraw $500 cash from credit card
    • Cash advance fee: $25 (5%)
    • APR: 28% (0.0767% daily)
    • Interest for 30 days: $500 × 0.000767 × 30 = $11.51
    • Total cost in one month: $500 + $25 fee + $11.51 interest = $536.51
    • Effective cost: 7.3% for 30-day borrowing, 87% annualized

    Balance Transfer APR

    Promotional or standard rate for transferred balances:

    • Often promotional 0% APR for 12-21 months
    • Balance transfer fee: 3-5% of amount transferred
    • After promo ends: Reverts to standard APR (often higher than purchase rate)
    • Strategic debt payoff tool if used correctly

    Example balance transfer:

    • Transfer $5,000 from 22% card to 0% promotional card
    • Balance transfer fee: $200 (4%)
    • 0% APR for 18 months
    • Pay $300 monthly = fully paid in 17 months
    • Total cost: $5,200 ($5,000 + $200 fee)
    • Savings vs keeping on 22% card: $1,200+ in avoided interest

    Penalty APR

    Punitive rate for late payments or violations:

    • Up to 29.99% APR (maximum legal rate)
    • Triggered by: 60+ days late payment, returned payments, exceeding credit limit
    • Can apply to existing balance plus future purchases
    • May be permanent or temporary (6+ months before review)

    Penalty APR impact:

    • $3,000 balance at 18% APR: $45 monthly interest
    • Penalty APR applied, now 29.99%: $75 monthly interest
    • Extra $30 monthly ($360 annually) from single late payment trigger

    Promotional APR

    Temporary introductory rates:

    • 0% APR for 12-21 months common on new accounts
    • Applies to purchases, balance transfers, or both
    • After promo period: Reverts to standard APR (typically 18-25%)
    • Deferred interest risk: Some promotions charge ALL interest retroactively if not paid by end

    Deferred interest trap:

    • Store card: $2,000 purchase, “no interest if paid in full within 12 months”
    • Actually deferred interest not true 0% (interest accruing in background)
    • Pay $1,999 by month 12 ($1 short of full amount)
    • Charged ALL 12 months of interest retroactively ($360+ at 24% APR)
    • Must pay ENTIRE balance to avoid this trap

    Strategies to Minimize or Eliminate Interest

    Strategy 1: Pay in Full Monthly (Zero Interest)

    Permanent zero-interest approach:

    • Charge only what you can pay from current income
    • Pay full statement balance every month
    • Maintain grace period indefinitely
    • Zero interest paid ever while earning rewards

    Implementation:

    • Set up automatic full statement balance payment
    • Budget ensuring spending doesn’t exceed income
    • Use credit card as payment method not credit source
    • Maintain checking buffer preventing overdrafts

    Strategy 2: Debt Avalanche Method (Minimize Total Interest)

    Pay highest APR debt first:

    • List all debts from highest to lowest APR
    • Pay minimums on all cards
    • Apply extra payment to highest APR card
    • When paid off, attack next highest APR
    • Mathematically optimal for minimizing total interest

    Example avalanche approach:

    • Card A: $3,000 at 24% APR
    • Card B: $5,000 at 18% APR
    • Card C: $2,000 at 15% APR
    • Available for debt payments: $600 monthly
    • Pay minimums on B ($125) and C ($50), $425 to Card A (24%)
    • Card A paid in 8 months, then attack Card B
    • Total interest: $2,100 avalanche vs $2,600 paying equal amounts

    Strategy 3: Debt Snowball Method (Psychological Wins)

    Pay smallest balance first:

    • List debts smallest to largest balance (ignore APR)
    • Pay minimums on all except smallest
    • Attack smallest balance aggressively
    • When eliminated, roll payment to next smallest
    • Creates quick wins and momentum

    Avalanche vs snowball trade-off:

    • Avalanche: Saves most interest (mathematically optimal)
    • Snowball: Better motivation (psychological optimal)
    • Interest difference often modest ($200-500 on $10,000 debt)
    • Choose based on personality: analytical (avalanche) vs motivation-driven (snowball)

    Strategy 4: Balance Transfer to 0% Card

    Using promotional rates strategically:

    • Transfer high-interest balances to 0% promotional card
    • Pay balance transfer fee (3-5%) upfront
    • Aggressively pay down during 0% period (12-21 months)
    • Eliminate debt before promo ends avoiding high standard APR

    Balance transfer calculation:

    • $8,000 balance at 22% APR on current card
    • Transfer to 0% card (18 months), 4% fee = $320
    • Pay $467 monthly for 18 months = $8,406 total vs $10,200+ on original card
    • Savings: $1,800 in avoided interest minus $320 fee = $1,480 net savings

    Balance transfer warnings:

    • Don’t make new purchases on 0% card (may not have grace period during promo)
    • Calculate required monthly payment to pay off before promo ends
    • One late payment can void 0% rate immediately
    • Don’t transfer then continue charging on old card (defeats purpose)

    Strategy 5: Negotiate Lower APR

    Direct negotiation with issuer:

    • Call customer service requesting rate reduction
    • Mention: Good payment history, competitive offers from other issuers, financial hardship
    • Success rate: 50-70% for customers in good standing
    • Typical reduction: 2-5 percentage points

    Example negotiation impact:

    • $4,000 balance, current 22% APR, negotiated to 18% APR
    • Paying $200 monthly at 22%: 25 months, $956 interest
    • Same $200 monthly at 18%: 24 months, $763 interest
    • Savings: $193 from single phone call negotiation
    Advertisement
    Reserved space for in-content ad

    Interest Calculation Examples

    Example 1: Simple Purchase with Full Payment

    Scenario:

    • Make $1,000 purchase on Day 1 of billing cycle
    • Statement closes Day 30 showing $1,000 balance
    • Pay $1,000 in full by Day 55 (payment due date)
    • Card APR: 18%

    Interest charged: $0

    • Grace period maintained by paying full statement balance
    • No interest despite 30-day billing cycle plus 25-day grace period

    Example 2: Carried Balance with Minimum Payment

    Scenario:

    • Previous balance: $2,500
    • APR: 20%
    • Daily rate: 20% ÷ 365 = 0.0548% (0.000548 decimal)
    • No new charges, no payments during month
    • 30-day billing cycle

    Interest calculation:

    • Average daily balance: $2,500 (constant all month)
    • Monthly interest: $2,500 × 0.000548 × 30 days = $41.10
    • New balance: $2,500 + $41.10 = $2,541.10
    • Minimum payment (2.5%): $63.53
    • If pay minimum: $63.53 – $41.10 = $22.43 principal reduction
    • Next month balance: $2,541.10 – $63.53 = $2,477.57 (barely decreased)

    Example 3: Balance with Mid-Cycle Payment

    Scenario:

    • Starting balance: $3,000
    • Day 15: Make $1,000 payment, new balance $2,000
    • APR: 18%, daily rate: 0.000493
    • 30-day billing cycle

    Interest calculation:

    • Days 1-15: $3,000 balance × 15 days = $45,000
    • Days 16-30: $2,000 balance × 15 days = $30,000
    • Sum: $75,000
    • Average daily balance: $75,000 ÷ 30 = $2,500
    • Monthly interest: $2,500 × 0.000493 × 30 = $36.98
    • Lower than if no payment made (would be $44.37 on $3,000 constant balance)

    Example 4: Cash Advance Cost

    Scenario:

    • Withdraw $1,000 cash from ATM using credit card
    • Cash advance fee: 5% or $10 minimum = $50
    • Cash advance APR: 28%
    • Daily rate: 28% ÷ 365 = 0.0767% (0.000767 decimal)
    • No grace period—interest starts immediately
    • 30 days before payment made

    Cost calculation:

    • Immediate fee: $50
    • 30-day interest: $1,000 × 0.000767 × 30 = $23.01
    • Total cost: $1,000 + $50 + $23.01 = $1,073.01
    • Effective cost for 30 days: 7.3%
    • Never use cash advances except absolute emergencies

    Why Understanding Interest Matters

    Without understanding credit card interest mechanics, individuals pay thousands unnecessarily through minimum payments creating perpetual debt, miss grace period opportunities enabling zero-interest card usage through full monthly payments, and lack framework for strategic payoff prioritization optimizing interest minimization—while interest-literate individuals either avoid interest entirely through full payment discipline or aggressively eliminate balances through understanding true minimum payment costs revealing 15+ year timelines and doubled total costs, enabling strategic debt elimination saving thousands in avoided interest through payment acceleration, balance transfers, or avalanche/snowball methodologies impossible without understanding interest calculation mechanics and compounding effects creating debt persistence.

    Understanding credit card interest enables individuals to:

    • Avoid all interest through grace period maintenance and full monthly payments
    • Calculate true costs of minimum payments revealing decade-long timelines
    • Compare payment strategies quantifying interest savings from acceleration
    • Optimize debt payoff through avalanche or snowball methods minimizing costs
    • Evaluate balance transfer opportunities calculating net savings after fees
    • Understand compounding mechanics revealing debt growth without payments
    • Recognize cash advance costs as extremely expensive emergency borrowing

    Interest knowledge transforms credit cards from mysterious expensive debt sources into understood financial tools either used at zero cost through full payments or strategically eliminated through informed payoff acceleration preventing thousands in unnecessary interest costs.

    Common Misunderstandings

    Many people assume making minimum payments represents responsible debt management. In reality, minimum payments deliberately designed to maximize issuer profits through interest accumulation keeping balances persistent for decades—$5,000 balance takes 15+ years and $6,000+ interest with minimums versus 11 months and $500 interest with aggressive payments, proving minimum payments create illusion of affordability while enriching issuers through compounding interest vastly exceeding principal reduction early in payoff timeline making minimums responsible-appearing trap not sound financial strategy.

    Another common misconception is paying balance to zero monthly wastes available credit. In practice, paying in full enables grace period maintenance creating zero interest costs while still building credit and earning rewards—available credit replenishes immediately as payments post allowing continued usage without interest charges, proving full payment superior strategy maximizing credit benefits while minimizing costs versus false belief that utilizing available credit requires carrying balances paying interest benefiting only card issuers not cardholders.

    Some believe all credit cards charge interest on all purchases immediately. However, grace periods on most cards provide 21-25 days interest-free if previous balance paid in full—enabling strategic users to borrow money interest-free for up to 55 days (30-day billing cycle plus 25-day grace) when purchases made early in cycle and paid on due date, proving credit cards can function as free short-term loans when used strategically versus assumption that all charging creates immediate interest obligations regardless of payment timing or amount.

    How Interest Understanding Fits Into Financial Success

    Credit card interest understanding enables either complete interest avoidance through full payment discipline creating zero borrowing costs while capturing rewards or strategic debt elimination through aggressive payoff minimizing total costs saving thousands versus minimum-only approaches—making interest literacy essential component of credit optimization impossible without understanding grace period mechanics enabling zero-interest usage, minimum payment mathematics revealing perpetual debt traps, and strategic payoff methods optimizing interest minimization through avalanche prioritization or snowball motivation, transforming interest from mysterious unavoidable cost into either completely avoided expense through discipline or strategically minimized burden through informed acceleration.

    For example, two individuals both age 30 with $8,000 credit card debt at 20% APR. Person A lacks interest understanding, pays only minimums believing this represents responsible approach avoiding “aggressive” strategies risking financial strain. Minimum starts at $200 (2.5% of balance), pays religiously monthly assuming steady progress. Reality: Monthly interest $133 initially, principal reduction only $67 first payment. After 5 years paying minimums: Balance only reduced to $5,800 (paid $12,000 total, $9,800 went to interest, $2,200 to principal), still $5,800 remaining requiring 10+ more years. Total payoff: 17 years age 47, $15,500 total interest paid, $23,500 total paid on original $8,000 debt. Person B understands interest mechanics, calculates minimum payment timeline revealing 17-year trap and $15,500 interest cost. Determines affordable aggressive payment: Can pay $400 monthly through spending cuts and side income. Payoff timeline: 24 months, $1,800 total interest. Strategy: Debt avalanche targeting highest APR cards first (has three cards, attacks 24% card first maximizing interest reduction). After 24 months age 32: Completely debt-free, total paid $9,800 ($8,000 + $1,800 interest). Difference from Person A: Person B saved $13,700 interest ($15,500 – $1,800) and 15 years (debt-free age 32 vs 47) from understanding interest revealing minimum payment trap and choosing strategic acceleration. Both started identical debt positions, Person A believed minimums represented responsibility lacking understanding of compounding mathematics creating perpetual debt, Person B’s interest literacy enabled informed strategic payoff saving $13,700 and 15 years achieving financial freedom decades earlier.

    Interest understanding separates strategic optimizers either avoiding interest entirely or minimizing through informed acceleration from minimum-payment perpetual debtors unknowingly enriching issuers through lack of compounding mathematics knowledge enabling informed decision-making impossible without interest calculation literacy.

    Recent Updates and Trends

    In recent years, CARD Act reforms (2009) have provided protections including: mandatory interest calculation disclosure on statements showing payoff timelines and costs, 21-day minimum payment periods, restrictions on penalty APR triggers, and limitations on rate increases on existing balances, though credit card interest rates themselves have increased over time following Federal Reserve rate adjustments with average APRs rising from 12-15% pre-2008 to 18-22% currently creating higher interest costs for balance-carriers despite consumer protection improvements.

    Credit card statements now include minimum payment warnings showing “if you make only the minimum payment each month, you will pay off the balance shown on this statement in about X years” plus total interest amount, enabling informed decision-making through transparency previously absent creating awareness of minimum payment traps though many consumers continue paying minimums despite stark warnings demonstrating information availability not sufficient without financial literacy enabling comprehension.

    Balance transfer offers have proliferated with 0% promotional periods extending to 18-21 months versus historical 6-12 months creating enhanced debt payoff opportunities for strategic users, though balance transfer fees have increased from 2-3% to 3-5% partially offsetting longer promotional periods requiring careful cost-benefit analysis calculating net savings after fees.

    Alternative credit products including buy-now-pay-later services have grown offering 0% short-term financing as traditional credit card alternative appealing to consumers wary of credit card interest, though creating similar debt risks without credit building benefits when payments missed or balances carried beyond promotional periods reverting to high rates comparable to credit cards.

    Fundamental interest principles remain timeless: daily compounding creates exponential debt growth without payments, minimum payments deliberately maximize interest through perpetual balance maintenance, grace periods enable zero-interest usage when balances paid in full, and aggressive payment dramatically reduces total interest versus minimum-only approaches—regardless of regulatory reforms, statement disclosure requirements, promotional period extensions, or alternative product proliferation, understanding interest calculation mechanics, avoiding minimum payment traps, and either maintaining zero balances or aggressively eliminating debt produces superior financial outcomes through interest cost minimization or complete avoidance impossible without mathematical literacy enabling informed strategic decision-making.

    3 Things You Can Do Today

    Ready to minimize or eliminate credit card interest? Here are three simple steps you can take right now:

    1. Calculate your exact minimum payment timeline and total interest cost using online payoff calculator creating urgency for acceleration – For each credit card balance, gather: Current balance, APR (annual percentage rate from statement), minimum payment amount or percentage. Visit free online credit card payoff calculator (multiple available, search “credit card payoff calculator”). Input balance, APR, minimum payment for each card. Review shocking results typically showing: Payoff time 10-20+ years for minimum-only payments, total interest often 100-150% of original balance, total amount paid 2-3x original debt. Example eye-opening calculation: $6,000 balance at 19% APR paying $150 minimums = 6 years 8 months payoff, $5,100 total interest, $11,100 total paid (nearly doubled debt). Write down totals making invisible costs visible: “Current minimum path: X years, $Y total interest, $Z total paid.” Calculate aggressive alternative: How much can you actually pay monthly? Example: $300 monthly instead of $150 minimums = 2 years 2 months, $1,300 interest, $7,300 total paid (saves $3,800 and 4+ years). Creates concrete motivation: Seeing “$5,100 wasted interest over 6 years” versus “$1,300 interest over 2 years” provides compelling case for payment acceleration impossible without quantifying actual costs making abstract interest concrete and actionable. Takes 15 minutes revealing true costs creating urgency for strategic action.

    2. If carrying balances, implement debt avalanche method paying minimums on all cards while attacking highest APR aggressively – List all credit card balances with: Card name, balance, APR, minimum payment. Sort by APR highest to lowest. Example: Card A $3,000 at 24% APR minimum $75, Card B $5,000 at 18% APR minimum $125, Card C $2,000 at 15% APR minimum $50, total debt $10,000 total minimums $250. Calculate affordable total payment: Determine realistically sustainable monthly amount (example: $600 through budget cuts, side income, or reallocation from other spending). Apply avalanche formula: Pay minimums on all except highest APR ($125 to B, $50 to C), apply remaining to highest APR Card A ($600 – $125 – $50 = $425 to Card A). Track progress: Card A paid off in 8 months, then roll $425 + $75 = $500 to Card B (next highest), Card B paid off in additional 12 months, finally Card C paid quickly. Total timeline: 24-26 months debt-free, total interest ~$2,100. Compare alternative equal payment approach ($200 each card): 28-30 months payoff, ~$2,600 interest, demonstrating avalanche saves $500+ and 4+ months through strategic APR targeting. Critical: No new charges during payoff period (use debit temporarily), maintain minimum payments preventing late fees and penalty APR triggers, automate minimums as backup ensuring nothing missed. Takes 20 minutes implementing mathematically optimal debt elimination saving hundreds to thousands versus random payment allocation lacking strategic APR prioritization.

    3. If no current balances, set up automatic full statement balance payment from checking preventing future interest charges forever – Log into credit card account online, navigate to automatic payment settings. Configure FULL STATEMENT BALANCE automatic payment (not minimum, not fixed amount, specifically “full statement balance”). Link checking account for automatic withdrawal. Set payment date 2-3 days before due date ensuring processing time. Verify checking account buffer: Maintain $500-1,000 extra preventing overdrafts when payment processes (if can’t maintain buffer, reduce credit card spending to levels sustainable within income). Enable alerts: Low checking balance warnings (before automatic payment processes), payment confirmation (verifying successful processing), unusual activity detection. This single setup guarantees: Zero interest paid ever on purchases (grace period maintained indefinitely), zero late payment fees (automatic payment never forgets), perfect payment history building excellent credit score (35% of score from on-time payments), maximum rewards capture without interest costs negating benefits. Monitor first 2-3 months ensuring: Payments processing correctly, checking balance sufficient for automatic withdrawals, no overdrafts or issues. Critical requirement: Budget discipline ensuring spending not exceeding income—automatic full payment only works when charges affordable, requires treating credit card as payment method not income supplement. Takes 15 minutes one-time setup creating permanent zero-interest operation impossible through manual payments risking occasional forgotten payment losing grace period or discipline failures carrying balances “just this month” becoming perpetual interest-bearing debt.

    These actions create interest optimization within 60 minutes—calculated true minimum payment costs revealing urgency ($5,000+ typical savings from acceleration), implemented avalanche strategy minimizing total interest through APR prioritization (saves $500-1,000+ versus random payments), and established automatic full payments preventing future interest charges forever (enables zero-cost credit card usage maximizing benefits)—transforming interest from mysterious unavoidable cost or perpetual burden into either completely avoided expense through automation or strategically minimized through informed aggressive payoff impossible without calculation literacy and strategic implementation.

    Advertisement
    Reserved space for in-content ad

    Quick FAQ

    How is credit card interest calculated?
    Daily compounding method: APR ÷ 365 = daily periodic rate (example: 18% ÷ 365 = 0.0493% daily), daily rate × average daily balance × days in billing cycle = monthly interest. Average daily balance: Sum of each day’s balance ÷ days in cycle accounting for payments and charges throughout month not just end balance. Interest added to balance daily creating compounding (interest on interest), charges appear on monthly statement. Example: $2,000 balance at 18% APR = approximately $30 monthly interest ($0.99 daily × 30 days), if paying $100 monthly only $70 reduces principal ($30 goes to interest) demonstrating why balances persist with small payments. Critical: Interest calculated on average daily balance throughout cycle not statement balance on closing date, so mid-cycle payments reduce interest by lowering average even if balance still exists at statement closing.

    Can I avoid credit card interest completely?
    Yes—pay full statement balance every month by due date maintaining grace period: Make purchases during billing cycle, statement closes showing total charges, pay FULL statement balance (not minimum, not partial) by payment due date 21-25 days later, grace period maintained for next cycle, zero interest charged on purchases. Requirements: Card must have grace period (most do, some for poor credit don’t), must pay previous balance in full (carrying any balance loses grace period), applies only to purchases (cash advances and balance transfers have no grace period). Strategy: Treat credit card like debit card charging only what you can pay from current income, set up automatic full statement balance payment ensuring never partial payments, maintain budget preventing spending exceeding income. Millions of credit card users pay zero interest ever while earning rewards through disciplined full payment approach proving interest completely avoidable not inevitable cost of card usage.

    What happens if I only pay the minimum payment?
    Debt persists for decades costing thousands in interest: Minimum typically 1-3% of balance (example: $100 on $5,000 debt), monthly interest often exceeds half of minimum payment (18% on $5,000 = $75 interest vs $100 minimum = only $25 principal reduction), as balance slowly decreases minimum payment also decreases creating perpetual debt cycle. Real example: $5,000 at 18% APR paying minimums only = 15+ years payoff, $6,000+ total interest, $11,000+ total paid (debt more than doubled). Why issuers love minimums: Maximum interest revenue from customers while appearing “affordable” enabling continued spending, creates persistent profitable relationships lasting decades. Breaking cycle requires: Payment significantly exceeding minimums (2-3x minimum minimum), commitment to no new charges during payoff, understanding minimum payment deliberately designed to maximize issuer profits not help consumers eliminate debt efficiently. Minimum payment responsible for preventing default not for achieving debt freedom requiring aggressive payments addressing principal meaningfully.

    Should I do a balance transfer to a 0% APR card?
    Often yes if done strategically with disciplined payoff plan: Benefits—0% APR for 12-21 months (saves hundreds to thousands in interest), provides focused payoff window creating deadline motivation, breaks compounding interest cycle. Costs—balance transfer fee 3-5% upfront (example: $300 on $10,000 transfer), potentially high standard APR after promo (22-25% typical). Calculation: $8,000 at 20% APR paying $400 monthly on current card = 24 months, $1,900 interest. Transfer to 0% for 18 months with 4% fee ($320): Pay $467 monthly = paid off in 18 months, total cost $8,320 ($8,000 + $320 fee), saves $1,580 versus original card. Requirements for success: Calculate required monthly payment to eliminate before promo ends ($8,000 ÷ 18 months = $445 minimum), commit to no new purchases on new card (focus on payoff only), don’t transfer then continue charging on old cards (defeats purpose), have discipline making required payments or risk debt remaining when 0% ends reverting to high standard rate. Strategy: Only transfer if can realistically pay off during promo period, compare total costs including fees versus current situation, treat as one-time debt elimination tool not perpetual balance transfer churning creating multiple fees.

    Does paying more than the minimum really make a big difference?
    Massive difference often saving thousands and years: $5,000 balance at 18% APR comparison—Minimum only ($125 starting): 15 years 3 months, $6,068 interest, $11,068 total. Double minimum ($250 fixed): 2 years 2 months, $970 interest, $5,970 total, saves $5,098 interest and 13 years. Triple minimum ($375 fixed): 1 year 3 months, $590 interest, $5,590 total, saves $5,478 interest and 14 years. Why dramatic difference: Extra payment attacks principal directly not just covering interest, reduced principal means less interest accruing next month creating accelerating payoff (snowball effect), breaking minimum payment trap designed to maximize interest through minimal principal reduction. Even small increases matter: Adding just $50 to minimum payments typically cuts payoff time by 30-50% and interest by similar proportion. Key insight: First dollars of payment go to interest (wasted covering borrowing cost), only dollars exceeding interest reduce principal (progress toward elimination), higher payments mean more dollars attacking principal versus covering interest demonstrating why aggressive payments dramatically superior to minimums regardless of balance size or APR creating exponential improvement through breaking designed-in debt persistence mechanism.

    Explore More in Money Basics

    Disclosure

    This article provides general educational information about credit card interest calculations and costs. Individual card APRs, terms, minimum payment formulas, and calculation methods vary by issuer. Interest rate ranges, payoff timelines, and total cost examples represent typical scenarios using standard calculation methods—actual results vary based on specific card terms, payment patterns, and balance fluctuations. This is not financial advice, credit counseling, debt management services, or recommendation of specific payoff strategies. Online calculator results approximate—verify calculations with card statements. Grace period availability, length, and terms vary by card—some cards lack grace periods entirely. Penalty APR triggers, amounts, and durations vary by issuer. Balance transfer offers including promotional periods, fees, and terms subject to credit approval and change. Debt avalanche and snowball methods represent general strategies—individual optimization depends on complete financial circumstances including all debts, income, and expenses. Consult qualified financial professionals or credit counselors for personalized guidance. Focus on legitimate debt elimination through increased payments and spending control rather than payment timing manipulation or dispute tactics. APR changes subject to market conditions and issuer policies with required advance notice. CARD Act protections current as of publication but subject to regulatory modification. Advertisements or sponsored content may appear within or alongside this content. All information presented independently for educational purposes only.
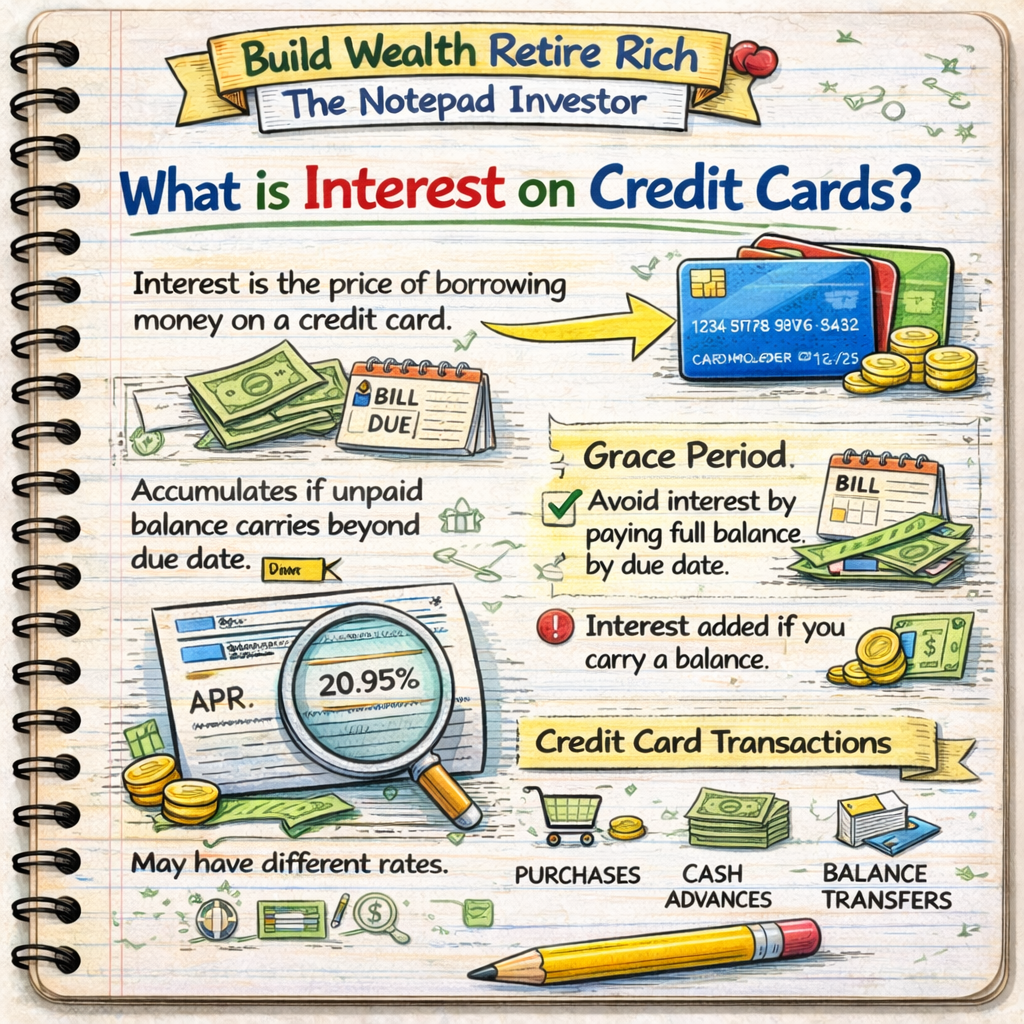
  • 4.7 How Credit Cards Work: A Beginner’s Guide to Using Them Smartly

    4.7 How Credit Cards Work: A Beginner’s Guide to Using Them Smartly

    Credit cards are revolving credit instruments issued by financial institutions allowing cardholders to borrow money up to predetermined credit limits for purchases, cash advances, or balance transfers with obligation to repay borrowed amounts plus interest on unpaid balances—functioning as short-term loans renewable monthly through minimum payments enabling ongoing credit access unlike installment loans requiring full repayment before reborrowing. Operating through networks (Visa, Mastercard, American Express, Discover) processing transactions between merchants, cardholders, and issuing banks, credit cards provide payment convenience, fraud protection superior to debit cards or cash, rewards programs offering cash back or travel points, and financial flexibility for emergencies or large purchases when used responsibly through full monthly balance payments avoiding interest charges—but create debt traps through high interest rates (15-25% APR typical) when balances carried monthly compounding into thousands in interest costs over years making credit cards simultaneously powerful financial tools enabling rewards optimization and purchase protection when managed strategically versus destructive debt instruments destroying wealth through interest accumulation when misused carrying balances indefinitely.

    Notebook sketch explaining personal finance

    This article is designed for anyone wanting comprehensive credit card understanding, individuals deciding whether to use credit cards or stick to debit/cash, or those seeking to optimize existing card usage avoiding common pitfalls. You do not need financial expertise to understand credit cards—fundamental concepts accessible through clear explanations of card mechanics, costs, benefits, and strategic usage, though requires discipline distinguishing between spending capacity (credit limit) and actual affordability preventing debt accumulation through charging purchases beyond ability to pay in full monthly creating interest-bearing balances growing through compounding impossible to eliminate without aggressive payoff commitment or strategic behavior changes addressing root spending versus income mismatches.

    Understanding credit cards matters because appropriate card use builds credit history enabling major purchases (homes, vehicles) impossible without established creditworthiness, strategic usage captures rewards worth hundreds to thousands annually through cash back or travel points, and superior fraud protection prevents unauthorized charge liability versus debit card vulnerabilities affecting actual bank funds—while informed card users maintain zero-interest costs through full monthly payments while earning 2-5% rewards on spending, build excellent credit scores through on-time payments and low utilization, and leverage purchase protections (extended warranties, return protection, dispute rights) creating value impossible to replicate through cash or debit, strategic card management produces superior financial outcomes versus either card avoidance forfeiting benefits or irresponsible usage creating high-interest debt negating rewards through interest costs exceeding cash back earnings.

    Educational disclaimer: This article provides general educational information about credit cards. Individual card terms, rates, fees, and features vary significantly by issuer and cardholder qualifications. Credit cards carry debt accumulation risks and potential credit score damage from mismanagement. This is not financial advice or recommendation of specific card usage strategies. Consult qualified financial professionals for personalized guidance. Card benefits, rewards, and terms subject to change. Responsible usage requires discipline paying balances in full monthly avoiding interest charges.

    How Credit Cards Work

    Basic Credit Card Mechanics

    The credit card cycle:

    • 1. Credit granted: Issuer approves account with credit limit (example: $5,000)
    • 2. Purchases made: Cardholder charges purchases throughout month
    • 3. Statement generated: Monthly statement shows charges, balance, minimum payment, due date
    • 4. Grace period: 21-25 days from statement closing to payment due date (if paying in full)
    • 5. Payment made: Cardholder pays minimum, full balance, or amount in between
    • 6. Cycle repeats: Available credit replenishes as payments made

    Key terminology:

    • Credit limit: Maximum amount borrowable on card
    • Available credit: Credit limit minus current balance
    • Statement balance: Total charges during billing cycle
    • Current balance: Real-time balance including charges after statement closing
    • Minimum payment: Smallest payment accepted (typically 1-3% of balance or $25-35 minimum)
    • Grace period: Interest-free period between statement closing and payment due date

    Payment Options and Consequences

    Option 1: Pay full statement balance (optimal)

    • Pay entire statement balance by due date
    • Zero interest charged
    • Grace period maintained for next cycle
    • Available credit fully replenished
    • Builds credit through payment history without interest costs

    Example: Statement balance $2,000, pay $2,000 by due date = $0 interest, grace period continues

    Option 2: Pay minimum payment (expensive)

    • Pay only minimum required (example: $50 on $2,000 balance)
    • Interest charged on remaining balance ($1,950)
    • Grace period lost—interest accrues immediately on new purchases
    • Balance persists indefinitely with minimum-only payments
    • Total cost dramatically higher through compounding interest

    Example: $2,000 balance at 18% APR, minimum payments only = 5+ years to pay off, $1,500+ interest paid, total cost $3,500+

    Option 3: Pay partial amount

    • Pay more than minimum but less than full balance
    • Interest charged on remaining balance
    • Reduces balance faster than minimum-only
    • Still incurs interest costs until fully paid

    Example: $2,000 balance, pay $500 monthly = 4-5 months payoff, $150-200 interest depending on APR

    Interest Calculation

    How credit card interest works:

    • APR (Annual Percentage Rate) divided by 365 = daily rate
    • Daily rate multiplied by average daily balance = daily interest
    • Daily interest compounded (added to balance daily)
    • Monthly interest = sum of daily interest for billing cycle

    Example calculation:

    • Balance: $3,000
    • APR: 18%
    • Daily rate: 18% ÷ 365 = 0.0493% per day
    • Daily interest: $3,000 × 0.000493 = $1.48 per day
    • Monthly interest (30 days): $1.48 × 30 = $44.40

    Compounding effect:

    • Interest added to balance daily
    • Next day’s interest calculated on balance + previous interest
    • Creates exponential growth if balance not paid down
    Advertisement

    Financial Wellness Planner

    Types of Credit Cards

    Rewards Credit Cards

    Cash back cards:

    • Earn percentage back on purchases (1-5% typical)
    • Flat-rate cards: Same percentage all purchases (1.5-2% common)
    • Category bonus cards: Higher rates specific categories (3-5% groceries, gas, dining)
    • Rotating category cards: 5% on quarterly rotating categories
    • Redemption: Statement credit, direct deposit, or gift cards

    Travel rewards cards:

    • Earn points or miles for travel redemptions
    • Airline-specific cards: Miles with specific carrier
    • Hotel-specific cards: Points with hotel chain
    • General travel cards: Flexible points for any travel
    • Perks: Airport lounge access, travel insurance, no foreign transaction fees

    Premium rewards cards:

    • High annual fees ($250-$695)
    • Enhanced rewards (2-3% or higher)
    • Premium benefits: Lounge access, travel credits, concierge service
    • Requires high spending to justify annual fee

    Balance Transfer Cards

    Features:

    • 0% APR promotional period (12-21 months typical)
    • Transfer balances from high-interest cards
    • Balance transfer fee (3-5% of transferred amount typically)
    • Debt payoff tool when used strategically

    Strategic usage:

    • Transfer $5,000 from 18% card to 0% card (18 months)
    • Pay $278/month = fully paid before 0% expires
    • Saves $700+ in interest versus keeping on original card
    • Requires discipline avoiding new charges during payoff

    Secured Credit Cards

    For building or rebuilding credit:

    • Requires security deposit ($200-$500 typical)
    • Deposit amount becomes credit limit
    • Reports to credit bureaus like regular cards
    • Graduation to unsecured card after 6-12 months responsible use
    • Deposit returned upon graduation or account closure

    Common secured cards:

    • Discover it Secured: Cash back rewards, no annual fee
    • Capital One Platinum Secured: Low deposit options
    • Secured Mastercard from Capital One: Flexible deposits

    Student Credit Cards

    Designed for college students:

    • Easier approval with limited credit history
    • Lower credit limits ($500-$1,500 typical)
    • Basic rewards programs
    • No annual fees usually
    • Requires student status verification

    Business Credit Cards

    For business expenses:

    • Separate business and personal spending
    • Business expense tracking and reporting
    • Higher credit limits
    • Business rewards categories (office supplies, advertising)
    • Employee card options

    Credit Card Costs and Fees

    Interest Rates (APR)

    Typical APR ranges:

    • Excellent credit (750+): 13-18% APR
    • Good credit (670-749): 17-22% APR
    • Fair credit (580-669): 21-25% APR
    • Poor credit (below 580): 25-29.99% APR or denied

    Variable vs fixed APR:

    • Variable APR: Changes with prime rate (most cards), can increase/decrease over time
    • Fixed APR: Rare on modern cards, can still change with 45-day notice

    Multiple APRs on single card:

    • Purchase APR: Standard rate for purchases
    • Cash advance APR: Higher rate (typically 25-30%), no grace period
    • Balance transfer APR: Often promotional 0% then higher rate
    • Penalty APR: Applied after late payments (up to 29.99%)

    Annual Fees

    Fee structures:

    • No annual fee cards: $0 (most basic cards, many cash back cards)
    • Low annual fee: $25-$95 (some rewards cards)
    • Premium cards: $95-$250 (enhanced rewards, benefits)
    • Luxury cards: $450-$695 (premium travel cards, exclusive benefits)

    Fee justification calculation:

    • Card annual fee: $95
    • Annual rewards earned: $300 (3% on $10,000 spending)
    • Net benefit: $300 – $95 = $205 positive
    • Justified if rewards and benefits exceed fee

    Other Common Fees

    Transaction fees:

    • Late payment fee: $25-$40 (first offense $25, subsequent $40)
    • Over-limit fee: $25-$35 (rare now, must opt in)
    • Foreign transaction fee: 1-3% of purchase amount (many cards waive)
    • Balance transfer fee: 3-5% of transferred amount
    • Cash advance fee: 3-5% of advance amount (minimum $10 typically)
    • Returned payment fee: $25-$40
    Advertisement
    Reserved space for in-content ad

    Credit Card Benefits

    Fraud Protection

    Superior liability protection:

    • Credit card liability: $50 maximum by law (most issuers waive entirely)
    • Zero liability policies: Most major issuers offer $0 liability for unauthorized charges
    • Dispute process: Temporary credit while investigating, 60-90 days to dispute
    • Your money safe: Fraudulent charges affect credit line not bank account

    Debit card comparison:

    • Report within 2 days: $50 maximum liability
    • Report within 60 days: $500 maximum liability
    • Report after 60 days: Unlimited liability (total loss possible)
    • Your money withdrawn: Bank account affected, bills may bounce
    • Investigation time: 2-4 weeks without funds access

    Example fraud scenario:

    • $3,000 fraudulent charges
    • Credit card: Report fraud, temporary credit issued, continue using card, resolved in 7-10 days, $0 liability
    • Debit card: $3,000 withdrawn from checking, overdrafts possible, 2-4 weeks investigation, potential liability up to $500

    Purchase Protections

    Extended warranty protection:

    • Adds 1-2 years to manufacturer warranty
    • Automatic coverage on most cards
    • Covers repairs or replacement if item fails
    • Example: $800 laptop with 1-year warranty, card extends to 2-3 years free

    Purchase protection (damage/theft):

    • Covers damaged or stolen items 90-120 days from purchase
    • Typical coverage: $500-$10,000 per claim
    • Example: Buy $600 camera, stolen within 90 days, card reimburses

    Return protection:

    • Refund if merchant won’t accept return
    • Typically 90 days from purchase
    • Coverage limits apply

    Price protection:

    • Refund price difference if item goes on sale within 60-90 days
    • Example: Buy TV for $800, drops to $650 in 60 days, card refunds $150 difference
    • Note: Many issuers phasing out this benefit

    Rewards and Cash Back

    Value calculation:

    • $30,000 annual spending on 2% cash back card = $600 annually
    • Over 30 years: $18,000 total rewards
    • Requires: Paying balance in full monthly (zero interest)
    • Cash/debit alternative: $0 rewards on same spending

    Category optimization:

    • Grocery card: 3% on groceries ($6,000 annual = $180)
    • Gas card: 3% on gas ($3,000 annual = $90)
    • Dining card: 4% on restaurants ($4,000 annual = $160)
    • General card: 1.5% everything else ($17,000 annual = $255)
    • Total rewards: $685 annually from strategic category matching

    Travel Benefits

    Premium card perks:

    • Airport lounge access (Priority Pass, airline lounges)
    • Travel insurance (trip cancellation, delay, lost luggage)
    • Rental car insurance (primary or secondary coverage)
    • No foreign transaction fees
    • Travel credits ($200-$300 annually)
    • Global Entry/TSA PreCheck credit ($100 every 4-5 years)

    Building Credit

    Credit score benefits:

    • Establishes credit history (15% of FICO score)
    • Creates payment history (35% of score) when paid on time
    • Adds to credit mix (10% of score)
    • Provides credit utilization denominator (30% of score)

    Timeline:

    • 6 months: First credit score appears
    • 12 months: Establish good score (680-720) with responsible use
    • 24+ months: Achieve excellent score (740+) possible

    Strategic Credit Card Usage

    Golden Rules of Credit Cards

    Rule 1: Pay full balance monthly

    • Zero interest charges
    • Maintain grace period
    • Maximize rewards without costs
    • Build credit without paying for privilege

    Rule 2: Keep utilization under 30%, ideally under 10%

    • Credit utilization = current balance ÷ credit limit
    • Affects 30% of credit score
    • Example: $5,000 limit, keep balance under $500 (10%)
    • Pay before statement closing date for lower reported utilization

    Rule 3: Pay on time every month

    • Payment history is 35% of credit score
    • Single 30-day late payment drops score 60-110 points
    • Set up automatic minimum payment as backup
    • Calendar reminders 5 days before due date

    Rule 4: Only charge what you can afford to pay in full

    • Credit limit is not spending target
    • Use credit as payment method not loan vehicle
    • If can’t pay cash, probably shouldn’t charge
    • Exceptions: Planned large purchases with payoff strategy

    Optimizing Rewards

    Multi-card strategy:

    • Match spending categories to highest-earning cards
    • 2-4 cards optimal for most people (more creates complexity)
    • Track which card for which spending

    Example optimized wallet:

    • Card 1: 3% groceries and gas
    • Card 2: 4% dining and entertainment
    • Card 3: 2% everything else
    • Total spending $30,000: Earns $750 annually optimized vs $450 on single 1.5% card

    What NOT to Do

    Avoid cash advances:

    • High fees (3-5% plus $10 minimum)
    • High APR (25-30% typical)
    • No grace period (interest starts immediately)
    • Example: $500 cash advance = $25 fee + $12.50 interest first month = $537.50 total

    Avoid minimum-only payments:

    • Compounds debt indefinitely
    • Pays mostly interest not principal
    • Example: $5,000 balance, 18% APR, minimum payments = 15+ years, $6,000+ interest

    Avoid unnecessary cards:

    • Store cards often have high APR (25-30%)
    • Limited usefulness (single retailer only)
    • Hard inquiry on credit report
    • Exception: Significant one-time discount with payoff plan

    Avoid closing old cards:

    • Reduces total credit limits (increases utilization)
    • Eventually lowers average account age
    • Damages credit score 20-40 points typically
    • Keep old cards open even if unused (small annual charge prevents closure)
    Advertisement
    Reserved space for in-content ad

    Credit Cards vs Debit Cards vs Cash

    Comparison Overview

    Credit cards:

    • Pros: Rewards, fraud protection, builds credit, grace period, purchase protections
    • Cons: Debt risk, interest if balances carried, requires discipline
    • Best for: Disciplined users paying in full monthly

    Debit cards:

    • Pros: Spends own money (no debt), widely accepted, convenient
    • Cons: No rewards, weaker fraud protection, no credit building, no purchase protections
    • Best for: Those lacking card discipline or building spending awareness

    Cash:

    • Pros: No debt possible, tangible spending awareness, universally accepted
    • Cons: No rewards, no fraud protection, no credit building, inconvenient, theft risk
    • Best for: Small transactions, budget envelope system

    30-Year Value Comparison

    Scenario: $30,000 annual spending, 30 years

    Credit card (paid in full monthly):

    • Rewards: $600 annually × 30 years = $18,000
    • Interest paid: $0
    • Credit score: Excellent (enables low mortgage rates saving $50,000+)
    • Fraud protection: Superior
    • Net benefit: $68,000+ (rewards + mortgage savings)

    Debit card:

    • Rewards: $0
    • Interest paid: $0
    • Credit score: No credit history built (mortgage denied or higher rates)
    • Fraud protection: Weaker
    • Net benefit: $0, potential mortgage cost increase

    Credit card (carrying balances):

    • Rewards: $600 annually × 30 = $18,000
    • Interest paid: $3,000 average balance × 18% APR × 30 years = $16,200
    • Credit score: Damaged by high utilization
    • Net benefit: $1,800 (rewards minus interest), credit damage

    Key insight: Credit cards superior IF paid in full, destructive if balances carried

    Why Understanding Credit Cards Matters

    Without understanding credit cards, individuals either avoid cards entirely forfeiting rewards worth thousands and credit-building opportunities necessary for major purchases or misuse cards carrying balances paying hundreds to thousands annually in unnecessary interest negating rewards value—while card-literate users capture 2-5% rewards on all spending through strategic card matching, build excellent credit scores through on-time payments and low utilization enabling lowest mortgage rates, and leverage superior fraud protection and purchase benefits creating value impossible through cash or debit, making credit card knowledge essential for optimizing modern payment infrastructure when combined with discipline ensuring balances paid in full monthly avoiding interest costs that destroy wealth through compounding over years.

    Understanding credit cards enables individuals to:

    • Earn hundreds to thousands annually in rewards through strategic card usage
    • Build credit history necessary for mortgages and major purchases
    • Protect against fraud through superior liability limits and dispute rights
    • Avoid interest costs through understanding grace periods and payment timing
    • Optimize credit scores through utilization management and payment discipline
    • Leverage purchase protections (extended warranties, return protection) adding value
    • Make informed decisions about card types, features, and costs versus benefits

    Credit card knowledge transforms cards from feared debt instruments or ignored payment methods into strategically optimized financial tools producing measurable value through rewards, protections, and credit building when managed responsibly versus either avoidance forfeiting benefits or misuse creating destructive debt.

    Common Misunderstandings

    Many people assume carrying credit card balances helps credit scores by “showing activity.” In reality, credit scores improve through on-time payments and low utilization regardless of whether balances paid in full or carried—carrying balances costs substantial interest ($1,000 annually on $5,000 balance at 20% APR) with zero score benefit, proving pay-in-full strategy superior producing identical credit building without interest waste based on misunderstanding of score factors rewarding payment history and utilization percentage not interest payment to issuers.

    Another common misconception is credit cards inherently dangerous requiring avoidance for financial safety. In practice, credit cards are neutral tools—strategic disciplined usage paying in full monthly produces superior outcomes through rewards, fraud protection, and credit building versus cash or debit alternatives, while irresponsible usage carrying balances creates destructive debt, proving cards themselves not problematic but rather user behavior determining outcomes making discipline and knowledge differentiating factors not card existence.

    Some believe closing unused credit cards improves credit scores by reducing “available debt.” However, closing cards immediately increases credit utilization (lower total credit limits) and eventually reduces average account age both damaging scores 20-40 points typically, proving keeping old cards open even if unused superior strategy maintaining high total credit limits (lower utilization) and long account ages versus closing based on false belief that unused credit represents risk when algorithms reward high available credit relative to balances not absolute credit limit amounts.

    How Credit Card Understanding Fits Into Financial Success

    Credit card understanding enables optimization of modern payment infrastructure capturing thousands in lifetime rewards, builds credit history necessary for major purchases at optimal rates, and provides fraud and purchase protections impossible through cash or debit—making card literacy essential component of comprehensive financial success when combined with discipline ensuring responsible usage through full monthly payments, strategic reward optimization through category matching, and credit score management through low utilization and perfect payment timing, transforming cards from potential debt traps into value-generating tools producing measurable benefits impossible without understanding card mechanics, costs, benefits, and strategic usage principles.

    For example, two friends age 25 both earning $50,000 with identical $30,000 annual spending. Friend A avoids credit cards believing “debt is dangerous” using debit card exclusively. Never builds credit history, denied mortgage age 30 despite $40,000 saved (no credit = no mortgage approval), forced to continue renting $1,800 monthly. Zero rewards earned on $30,000 annual spending over 30 years = $0. Age 55: Paid $648,000 in rent over 30 years, $200,000 saved (disciplined saver) but no home equity, never qualified for mortgage due to absent credit history. Friend B understands credit cards as tools requiring discipline, opens 2% cash back card age 25 paying full balance monthly never carrying interest-bearing balance. Uses card for all spending: $30,000 annually × 2% = $600 rewards yearly. Age 30: Excellent 760+ credit score from 5 years perfect payment history, low utilization. Approved for mortgage with $40,000 down (identical savings as Friend A). Buys $300,000 home, 6% rate enabled by excellent credit, $1,799 monthly payment. Over 30 years: $18,000 rewards earned ($600 × 30 years), built $150,000 home equity through ownership versus rent, excellent credit enabled optimal mortgage rate saving $50,000 versus fair credit rates. Age 55: Home worth $600,000 with $300,000 equity, total rewards $18,000, optimal rates on all borrowing saving $75,000+ lifetime. Difference from identical starting points and identical spending: Friend A’s card avoidance cost $400,000+ ($648,000 rent vs $216,000 mortgage principal paid building equity minus $18,000 rewards minus $75,000 borrowing cost savings = $441,000 disadvantage) despite equal spending discipline and savings rates—entire difference from credit card understanding enabling credit building, rewards capture, and strategic usage versus avoidance based on misconception that cards inherently dangerous versus recognizing discipline as differentiating factor.

    Credit card understanding separates strategic optimizers capturing rewards and building credit enabling wealth accumulation from either avoiders forfeiting benefits creating opportunity costs or misusers carrying balances paying thousands in interest negating rewards through lack of discipline or knowledge.

    Recent Updates and Trends

    In recent years, credit card rewards competition has intensified with cards offering 2-5% cash back or valuable travel points becoming standard versus historical 1% rewards creating enhanced value proposition for strategic users though tempting overspending through rewards psychology potentially negating benefits when balances carried paying interest exceeding cash back earnings.

    Contactless payment technology has expanded through tap-to-pay cards and mobile wallets (Apple Pay, Google Pay) improving transaction speed and security versus magnetic stripe cards though creating potential for easier impulse spending through reduced payment friction making discipline more critical as payment convenience increases.

    Buy-now-pay-later services have proliferated offering point-of-sale financing as credit card alternative splitting purchases into installment payments, appealing to younger consumers wary of traditional credit cards but creating similar debt risks plus credit building limitations versus strategic credit card use building credit scores through reporting to bureaus.

    Annual fee cards have increased in prevalence with premium cards offering enhanced benefits justifying $250-$695 fees for high spenders capturing value through multiplied rewards and perks, though requiring careful cost-benefit analysis ensuring rewards and benefits exceed fees versus assuming premium cards always superior when benefits may not justify costs for moderate spending levels.

    Fundamental credit card principles remain timeless: paying balances in full monthly avoids interest while capturing rewards, low utilization and perfect payments build excellent credit scores, superior fraud protection provides security advantage, and strategic usage produces measurable benefits impossible through cash or debit—regardless of rewards intensification, payment technology evolution, alternative financing proliferation, or premium card expansion, understanding card mechanics, maintaining discipline paying in full, and optimizing rewards strategically produces superior financial outcomes through responsible leverage of payment infrastructure benefits versus either avoidance forfeiting advantages or misuse creating destructive debt through lack of knowledge or discipline.

    3 Things You Can Do Today

    Ready to optimize credit card usage? Here are three simple steps you can take right now:

    1. Calculate your current annual rewards and potential rewards with optimized card strategy – Review last 12 months spending by category: Groceries (example: $6,000), gas ($3,000), dining ($4,000), travel ($2,000), everything else ($15,000), total $30,000 annually. Calculate current rewards: If using 1.5% cash back card on everything = $30,000 × 0.015 = $450 annually. Research category-specific cards: Groceries card 3% ($6,000 × 0.03 = $180), gas card 3% ($3,000 × 0.03 = $90), dining card 4% ($4,000 × 0.04 = $160), travel card 2% ($2,000 × 0.02 = $40), everything else 1.5% ($15,000 × 0.015 = $225). Optimized total: $695 annually versus $450 current = $245 additional annually, $7,350 over 30 years from strategic card matching. Check annual fees: Ensure rewards exceed fees (example: $695 rewards minus $95 combined fees = $600 net benefit). Create simple reference: “Groceries → Card A, Dining → Card B, Everything else → Card C” preventing decision fatigue. Critical requirement: Only effective if paying balances in full monthly—carrying balances at 18% APR negates rewards ($5,000 average balance = $900 interest annually exceeding $695 rewards). Takes 30 minutes calculating opportunity creating $245 annual value increase through strategic card optimization.

    2. Set up automatic full payment from checking account ensuring zero interest costs while capturing rewards – Log into credit card account online, navigate to automatic payment settings. Configure automatic FULL STATEMENT BALANCE payment from checking account (not minimum payment). Verify sufficient checking buffer: Maintain $500-1,000 extra in checking preventing overdrafts when automatic payment processes. Set payment date: 2-3 days before due date ensuring processing time. Enable low balance alerts: Both checking (warns if buffer insufficient) and credit card (confirms payment processed). This guarantees: Zero interest charges ever (grace period maintained), zero late payment fees, perfect payment history (35% of credit score), maximum rewards capture without costs. Monitor first 2-3 months: Ensure payments processing correctly, checking balance sufficient, no issues. Backup reminder: Calendar alert 5 days before payment date verifying checking balance adequate. Takes 15 minutes one-time setup creating permanent zero-interest operation capturing full rewards value impossible when carrying balances or making manual payments risking late fees and interest from forgotten payments. Critical: Budget ensuring spending not exceeding income creating situation where automatic payment cannot be covered—credit cards are payment method not income supplement requiring spending discipline.

    3. If currently carrying credit card debt, create aggressive payoff plan calculating total interest cost of minimum payments versus payoff timeline – List all credit card balances: Card A $3,000 at 18% APR, Card B $2,000 at 22% APR, total $5,000 debt. Calculate minimum payment costs: Use online credit card payoff calculator entering balances and APRs. Minimum payments only: $5,000 debt takes 15-20 years, total interest $6,000-8,000, total paid $11,000-13,000. Create aggressive plan: How much can you pay monthly? Example: $500 monthly total. Debt avalanche method (optimal): Pay minimums on all cards, apply extra to highest APR card first (Card B 22%), once eliminated attack next highest. Timeline: $500 monthly pays off $5,000 in 11-12 months, total interest ~$500 versus $6,000+ minimum-only. Debt snowball alternative (psychological): Pay smallest balance first regardless of APR creating quick wins, slightly more interest but better motivation for some people. During payoff: Stop all new charges (use debit card temporarily), redirect any extra income to debt (tax refunds, bonuses), track progress monthly. After payoff: Maintain $500 monthly “payment” redirecting to savings preventing lifestyle inflation and building emergency fund. Takes 20 minutes creating concrete payoff plan with specific timeline and total cost versus indefinite minimum payments, typically saving $5,000+ in interest and achieving freedom in 12 months versus 15+ years making aggressive planning essential for anyone carrying balances.

    These actions create credit card optimization within 90 minutes—calculated rewards opportunity through strategic card matching ($245+ annually), implemented automatic full payments ensuring zero interest forever, and created aggressive debt payoff plan if carrying balances (saving $5,000+ interest)—transforming credit cards from potential debt traps or underutilized payment methods into optimized value-generating tools through strategic usage, payment discipline, and debt elimination when applicable.

    Advertisement
    Reserved space for in-content ad

    Quick FAQ

    Does carrying a credit card balance help my credit score?
    No—complete myth wasting money. Credit scores improve through: (1) On-time payments (happens whether balance paid in full or carried monthly), (2) Low credit utilization under 30% ideally under 10% (actually better at lower percentages not higher), (3) Length of credit history, (4) Credit mix. Carrying balance costs interest with ZERO additional score benefit versus paying in full. Example: $2,000 average balance at 18% APR = $360 annual interest wasted for no credit advantage. Correct approach: Use cards actively generating payment history, pay FULL balance monthly avoiding all interest, maintain low utilization (easily achieved paying in full), keep accounts open long-term building history length. This maximizes credit score while minimizing costs versus “carry small balance” myth enriching card issuers through unnecessary interest payments providing zero scoring benefit based on misunderstanding of FICO calculation factors.

    Should I close credit cards I’m not using?
    Usually no—closing typically damages credit scores. Negative impacts: (1) Reduces total credit limits increasing utilization percentage (example: $10,000 limits with $2,000 balance = 20% utilization, close $5,000 limit card = now 40% utilization on remaining $5,000 limits damaging scores), (2) Eventually reduces average account age when closed account falls off report after 10 years (FICO) or immediately (VantageScore), (3) Reduces number of accounts and credit mix slightly. Score impact: 20-40 points typical from closing old established card. Exceptions where closing acceptable: High annual fee card ($450+) not providing value justifying cost, multiple similar cards creating management complexity when have several no-fee alternatives, identity theft cleanup. Better strategy: Keep old no-fee cards open, make small purchase annually ($5-10) preventing issuer closure from inactivity, set up automatic payment and forget about card. Costs zero, maintains credit limits lowering utilization, preserves account age, protects credit score.

    How many credit cards should I have?
    Depends on spending patterns and management ability but 2-4 cards optimal for most people balancing rewards optimization and simplicity. One card: Simplest management but limited rewards optimization (single 1.5-2% rate on everything). Two cards: Good balance, example: One 2% everything card plus one category bonus card (3-5% groceries/gas). Three cards: Better optimization, example: Groceries card, dining card, everything else card capturing category bonuses. Four+ cards: Maximum optimization for high spenders willing to track categories, can become complex managing multiple payments and tracking. Credit score perspective: Multiple cards beneficial showing credit management capability, total credit limits higher (lower utilization), mix of account ages. Warning: Only if disciplined paying all in full monthly—more cards = more complexity = higher risk of missed payment if not systematic. Start conservative: Begin with 1-2 cards, add strategically after proving payment discipline, prioritize management simplicity over marginal rewards unless high spender justifying complexity through substantial additional rewards.

    What’s the difference between statement balance and current balance?
    Critical distinction affecting interest charges: Statement balance = total charges during billing cycle from statement closing date, shown on monthly statement, amount due to avoid interest. Current balance = real-time balance including charges made AFTER statement closing date, reflects all pending transactions. Payment strategy: Pay STATEMENT BALANCE in full by due date to avoid interest and maintain grace period (current balance may be higher due to post-statement charges but those appear on next statement). Example timeline: Statement closes January 15 showing $1,000 balance (due February 10), you charge $500 more January 16-February 9, current balance shows $1,500 but only $1,000 statement balance due. Pay $1,000 by February 10: Zero interest charged, grace period maintained, $500 appears on February statement due March 10. Mistake: Confusing current balance for statement balance paying wrong amount (paying only current balance when higher charges made after statement closing overpays current cycle, paying only current balance when lower than statement underpays owing interest). Always reference STATEMENT BALANCE from monthly statement for payment amount needed to avoid interest not current balance from online account which fluctuates daily.

    Is it better to use credit cards or debit cards?
    Credit cards superior IF disciplined paying in full monthly, debit cards safer if lacking spending discipline. Credit card advantages: 2-5% rewards (hundreds annually), superior fraud protection ($50 max liability vs $500 debit), builds credit history necessary for mortgages, grace period (21-25 days interest-free), purchase protections (extended warranties, return protection). Debit card advantages: Spends own money preventing debt accumulation, easier spending awareness (immediate balance reduction), no interest risk. The critical factor: DISCIPLINE paying full balance monthly. Disciplined user: Credit cards clearly superior—same spending, earn rewards, build credit, better protection, no interest if paid in full. Undisciplined user: Credit cards dangerous—easy overspending beyond means, interest accumulation, debt spiral, rewards negated by interest ($500 rewards meaningless when paying $2,000 interest). Recommendation: Use credit cards for all spending IF (1) budget maintained ensuring spending not exceeding income, (2) commitment to full monthly payment absolute, (3) automatic payments configured preventing late fees, (4) emergency fund exists covering unexpected expenses without card reliance. If struggling with spending control: Stick to debit temporarily while building discipline then transition to credit cards once demonstrated budget adherence preventing debt accumulation through overspending.

    Explore More in Money Basics

    Disclosure

    This article provides general educational information about credit cards. Individual card terms, rates, fees, rewards, benefits, and features vary significantly by issuer, card type, and cardholder qualifications. Credit cards carry risks including debt accumulation and credit score damage from mismanagement. APR ranges, fee amounts, and reward rates represent typical market ranges as of publication—actual offers vary. This is not financial advice, product recommendation, or guarantee of approval or specific terms. Card benefits including purchase protections, extended warranties, and travel insurance have specific terms, limitations, and exclusions—review cardholder agreements for complete details. Rewards optimization calculations assume disciplined usage paying balances in full monthly—carrying balances negates rewards through interest costs. Some card benefits mentioned (price protection, return protection) being phased out by issuers—check current benefits before applying. Credit score impact examples represent typical scenarios—individual results vary based on complete credit profiles. Consult qualified financial professionals for personalized guidance. Focus on responsible usage maintaining zero interest-bearing balances rather than rewards optimization if lacking spending discipline. Card approval depends on creditworthiness, income, and issuer criteria. Annual fees, interest rates, and benefits subject to change by issuers. Comparison between credit cards, debit cards, and cash represents generalized scenarios—individual circumstances vary. Advertisements or sponsored content may appear within or alongside this content. All information presented independently for educational purposes only.

  • 4.6 What Is a Credit Report? How to Check It and Fix Errors Fast

    4.6 What Is a Credit Report? How to Check It and Fix Errors Fast

    Credit reports are detailed records of credit history maintained by three major credit bureaus (Equifax, Experian, TransUnion) containing personal information, account details, payment histories, credit inquiries, and public records—serving as comprehensive documentation of borrowing behavior from which credit scores are calculated and lenders evaluate creditworthiness for lending decisions. Unlike credit scores which condense credit data into single three-digit number (300-850 range), credit reports provide granular account-by-account information showing every credit card, loan, mortgage, and payment over time including specific late payment dates, current balances, credit limits, account opening dates, and derogatory marks like collections or bankruptcies creating full picture of credit management spanning years or decades. Understanding credit reports matters because errors appearing on reports (affecting 20% of consumers according to FTC studies) can damage scores unnecessarily until corrected through disputes, identity theft often first detected through unauthorized accounts on reports, and report content directly feeds score calculations making report accuracy essential for optimal creditworthiness impossible to verify without regular report review enabling error detection and correction protecting financial standing.

    Notebook sketch explaining personal finance

    This article is designed for anyone wanting comprehensive credit report understanding, individuals needing to check reports for errors or fraud, or those preparing for major borrowing requiring report accuracy verification. You do not need credit expertise to understand credit reports—fundamental concepts accessible through clear explanations of report sections and content, though requires attention to detail reviewing reports thoroughly identifying errors, fraudulent accounts, or inaccuracies requiring dispute processes correcting report content impossible without systematic review methodology understanding report structure and common error types enabling effective monitoring and correction.

    Understanding credit reports matters because regular report review catches errors before they damage scores during loan applications, identity theft detection through unauthorized accounts prevents fraud escalation, and report accuracy verification ensures credit scores reflect actual credit behavior not reporting mistakes—while report-literate individuals check reports annually from all three bureaus identifying errors and disputing immediately, monitor for fraud through unauthorized accounts or inquiries, and understand report content feeding score calculations enabling strategic credit management, creating protection and optimization impossible for those ignoring reports until loan application discovering errors too late for timely correction or missing fraud allowing damage accumulation over months or years undetected.

    Educational disclaimer: This article provides general educational information about credit reports. Individual credit report content varies based on personal credit history. Dispute processes and timelines represent general guidelines—actual experiences vary. This is not credit repair services, legal advice, or guarantee of dispute outcomes. Consult qualified professionals for personalized guidance. Focus on legitimate dispute of actual errors rather than attempting removal of accurate negative information through aggressive dispute tactics unlikely to succeed and potentially problematic.

    What Credit Reports Contain

    Personal Information Section

    Identifying information:

    • Full name (current and previous names, aliases)
    • Current and previous addresses (typically last 7-10 years)
    • Date of birth
    • Social Security number (full or partial depending on requesting party)
    • Current and previous employers (if reported by creditors)
    • Telephone numbers associated with accounts

    Important notes:

    • Personal information does NOT affect credit scores
    • Used for identity verification and report matching
    • Inaccuracies should be corrected but don’t directly impact scores
    • Multiple name variations or addresses normal (reflects history)

    Credit Account Information (Trade Lines)

    Account details for each credit account:

    Basic account information:

    • Creditor name and account number
    • Account type (credit card, mortgage, auto loan, student loan, personal loan)
    • Account status (open, closed, paid, charged off, collection)
    • Date opened
    • Date of last activity
    • Date closed (if applicable)

    Financial details:

    • Credit limit (credit cards) or original loan amount (installment loans)
    • Current balance
    • Highest balance ever carried
    • Monthly payment amount
    • Account responsibility (individual, joint, authorized user, cosigner)

    Payment history:

    • Payment status each month (typically 24-84 months displayed)
    • On-time payments marked (OK, Current, Paid as Agreed)
    • Late payments marked with severity (30, 60, 90, 120+ days)
    • Date of last payment
    • Number of payments made

    Credit Inquiries

    Hard inquiries (affect credit scores):

    • Result from credit applications (cards, loans, mortgages)
    • Include creditor name and inquiry date
    • Remain on report 2 years
    • Affect scores first 12 months only
    • Visible to other lenders reviewing report

    Soft inquiries (do NOT affect scores):

    • Checking own credit
    • Pre-qualification or pre-approval offers
    • Existing creditor account reviews
    • Employer background checks
    • Visible only to consumer (not other lenders on most report versions)

    Public Records and Collections

    Public records (severe negatives):

    • Bankruptcies (Chapter 7: 10 years, Chapter 13: 7 years)
    • Tax liens (7 years from payment date, though reporting practices changed 2018)
    • Civil judgments (7 years, though removed from major bureau reports 2018)
    • Foreclosures (7 years)

    Collection accounts:

    • Accounts sent to third-party collection agencies
    • Original creditor information
    • Collection agency name
    • Date account went to collections
    • Collection amount
    • Payment status (unpaid, paid, settled)
    • Remain 7 years from original delinquency date

    Consumer Statements

    Optional 100-word statement:

    • Consumer can add explanatory statement to report
    • Explains circumstances of negative items (job loss, medical emergency, divorce)
    • Limited practical value (lenders rarely read, doesn’t improve scores)
    • May help in manual underwriting situations
    Advertisement

    Financial Wellness Planner

    The Three Credit Bureaus

    Bureau Overview

    Equifax:

    • Headquarters: Atlanta, Georgia
    • Founded: 1899
    • One of largest consumer credit bureaus
    • Website: equifax.com

    Experian:

    • Headquarters: Dublin, Ireland (global), Costa Mesa, California (North America)
    • Founded: 1996 (roots to 1803)
    • Largest global credit bureau
    • Website: experian.com

    TransUnion:

    • Headquarters: Chicago, Illinois
    • Founded: 1968
    • Third major U.S. credit bureau
    • Website: transunion.com

    Why Three Separate Bureaus

    Independent data collection:

    • Each bureau independently collects data from creditors
    • Not all creditors report to all three bureaus
    • Creates data discrepancies between reports
    • No legal requirement for creditors to report to any or all bureaus

    Reporting variations:

    • Credit card reported to Experian and TransUnion but not Equifax
    • Student loan reported to all three but with different balance update dates
    • Collections account appears on Equifax only
    • Creates three potentially different credit reports for same person

    How Bureaus Collect Information

    Data furnishers (creditors) voluntarily report:

    • Banks, credit card companies, auto lenders, mortgage lenders
    • Student loan servicers
    • Collection agencies
    • Public records (courts, government agencies)

    Reporting frequency:

    • Most creditors report monthly (typically on statement closing date)
    • Timing varies by creditor
    • Updates not instantaneous (may lag days or weeks)

    What’s typically NOT reported:

    • Income or salary
    • Bank account balances
    • Investment accounts
    • Debit card transactions
    • Utility payments (unless in collections or using special programs)
    • Rent payments (unless using reporting service or in collections)
    • Medical bills under $500 (recent policy change)

    How to Get Your Credit Reports Free

    Annual Free Credit Reports (Federal Right)

    AnnualCreditReport.com (ONLY official free source):

    • Federally mandated free annual report from each bureau
    • One report per bureau per 12 months (3 total annually)
    • Website: AnnualCreditReport.com (no other sites are official)
    • Phone: 1-877-322-8228
    • Mail: Request form available on website

    Important warnings:

    • AnnualCreditReport.com is ONLY legitimate free source authorized by federal law
    • FreeCreditReport.com, FreeCreditScore.com are NOT official (paid services with free trials)
    • Watch for upsells on AnnualCreditReport.com (credit scores, monitoring services)
    • Reports are free, but credit scores may require payment

    Strategic Report Checking Schedule

    Option 1: All three at once annually

    • Request all three reports same day once per year
    • Comprehensive annual review
    • Compare all three for discrepancies
    • Good for: Annual deep-dive review

    Option 2: Staggered every 4 months (recommended)

    • Request one bureau every 4 months rotating through year
    • Example: Equifax in January, Experian in May, TransUnion in September
    • Provides continuous monitoring throughout year
    • Catches errors and fraud faster
    • Good for: Ongoing fraud monitoring

    Additional Free Report Situations

    Special circumstances entitling additional free reports:

    • Victim of identity theft
    • Fraud alert on file
    • Credit freeze in place
    • Denied credit, employment, insurance, or housing based on credit report (within 60 days)
    • Unemployed and job seeking
    • Receiving public assistance
    • Reasonably believe report contains errors due to fraud

    Credit Monitoring Services

    Free monitoring options:

    • Credit Karma: TransUnion and Equifax reports plus VantageScore 3.0 (ad-supported free)
    • Credit Sesame: Similar free monitoring
    • Many credit card issuers: Free monitoring for cardholders
    • Experian app: Free Experian report and FICO 8 score

    Paid monitoring services ($10-30 monthly):

    • All three bureau monitoring simultaneously
    • Daily or weekly updates
    • Alert notifications for changes
    • Identity theft insurance (some services)
    • Credit score tracking across multiple models
    Advertisement
    Reserved space for in-content ad

    Reading and Understanding Your Credit Report

    Report Format and Organization

    Typical report sections in order:

    • Personal information summary
    • Credit score (if purchased, not included in free report)
    • Credit summary (total accounts, balances, available credit)
    • Account details (all credit accounts listed individually)
    • Credit inquiries (hard and soft)
    • Public records and collections
    • Dispute instructions

    Understanding Account Status Codes

    Positive status indicators:

    • “Current” or “Pays as Agreed”: Account in good standing
    • “OK” or “On Time”: Payments made on time
    • “Closed” or “Paid”: Account closed or paid off (can be positive if paid as agreed)

    Negative status indicators:

    • “30/60/90/120”: Days past due
    • “Charge-off”: Account written off as loss (severe negative)
    • “Collection”: Sent to collection agency
    • “Bankruptcy”: Included in bankruptcy filing
    • “Foreclosure”: Property foreclosed
    • “Repossession”: Vehicle or property repossessed

    Payment History Grid

    Monthly payment status display:

    • Grid showing 24-84 months of payment history
    • Each column represents one month
    • Codes indicate payment status that month
    • Example: OK OK OK 30 OK OK = one 30-day late payment among otherwise on-time payments

    Account Ownership Indicators

    Responsibility types:

    • Individual: You alone responsible for account
    • Joint: Shared responsibility with another person (spouse, cosigner)
    • Authorized user: Can use account but not legally responsible (inherits account history)
    • Cosigner: Legally responsible if primary borrower defaults

    Common Credit Report Errors

    Error Prevalence

    FTC study findings:

    • 20% of consumers have errors on at least one credit report
    • 5% have errors serious enough to affect lending decisions
    • Errors range from minor (misspelled name) to severe (fraudulent accounts)

    Types of Errors

    Account information errors:

    • Accounts not belonging to you (identity mix-up or fraud)
    • Closed accounts showing as open
    • Incorrect account balances
    • Wrong credit limits (affects utilization calculations)
    • Duplicate accounts (same account listed twice)

    Payment history errors:

    • Late payments incorrectly reported (paid on time but marked late)
    • Old late payments exceeding 7-year reporting limit
    • Payments applied to wrong account
    • Incorrect dates for late payments

    Personal information errors:

    • Wrong name or name variations
    • Incorrect addresses
    • Wrong Social Security number
    • Employment information inaccuracies
    • Accounts from person with similar name

    Status errors:

    • Discharged bankruptcy debts showing balance due
    • Paid collections showing unpaid
    • Settled accounts showing wrong status
    • Accounts past 7-10 year reporting limits still appearing

    Identity Theft Red Flags

    Warning signs on credit report:

    • Accounts you didn’t open
    • Inquiries you didn’t authorize
    • Addresses you never lived at
    • Employers you never worked for
    • Collections for debts you don’t recognize
    • Sudden increase in number of accounts

    Disputing Credit Report Errors

    Dispute Process Overview

    Steps to dispute errors:

    1. Identify error clearly:

    • Document specific inaccuracy
    • Gather supporting documentation (statements, receipts, correspondence)
    • Be specific about what’s wrong and what should be correct

    2. File dispute with credit bureau:

    • Online: Bureau website dispute centers (fastest, recommended)
    • Phone: Call bureau dispute department
    • Mail: Send dispute letter with documentation (provides paper trail)

    3. Bureau investigates:

    • Contacts data furnisher (creditor who reported information)
    • Requests verification of disputed information
    • Timeline: 30 days typically (45 days if additional information provided)

    4. Receive results:

    • Bureau sends investigation results
    • Updated credit report if changes made
    • Explanation if dispute rejected

    Dispute Methods

    Online disputes (recommended for speed):

    • Equifax: equifax.com/personal/credit-report-services
    • Experian: experian.com/disputes
    • TransUnion: transunion.com/credit-disputes
    • Fastest processing (often resolved in 2-3 weeks)
    • Upload supporting documents
    • Track dispute status online

    Mail disputes (recommended for serious issues):

    • Send certified mail with return receipt
    • Creates paper trail and proof of dispute
    • Include copies (not originals) of supporting documents
    • Write clear dispute letter identifying errors specifically

    Dispute Letter Components

    Effective dispute letter includes:

    • Your full name, current address, date of birth, Social Security number
    • Credit report confirmation number (from report)
    • Specific item being disputed (account name, number, dates)
    • Clear explanation of error and why it’s wrong
    • What the correct information should be
    • Request for deletion or correction
    • Copies of supporting documents
    • Your signature and date

    Dispute Outcomes

    Possible results:

    • Verified accurate: Disputed item confirmed correct, remains on report
    • Updated: Information corrected to accurate version
    • Deleted: Item removed from report (cannot be verified or confirmed inaccurate)
    • Notation added: Dispute noted on report but item remains

    If Dispute Rejected

    Next steps when dispute unsuccessful:

    • Request method of verification (how bureau confirmed accuracy)
    • Contact creditor directly disputing with data furnisher
    • File dispute with other bureaus (information may differ)
    • Add 100-word consumer statement explaining your side
    • Consider CFPB complaint (Consumer Financial Protection Bureau)
    • Consult consumer law attorney for serious issues
    Advertisement
    Reserved space for in-content ad

    Credit Report vs Credit Score

    Key Differences

    Credit report (detailed history):

    • Comprehensive account-by-account information
    • Payment history details for each account
    • Personal information, addresses, employment
    • Inquiries, public records, collections
    • Free annually from AnnualCreditReport.com
    • Does NOT include credit score (unless purchased separately)

    Credit score (numerical summary):

    • Single three-digit number (300-850)
    • Calculated from credit report data
    • Summarizes creditworthiness into one metric
    • Not included in free annual report
    • Available free through credit card issuers, monitoring services
    • Multiple scores exist (FICO, VantageScore, different versions)

    Relationship Between Reports and Scores

    Reports feed scores:

    • Credit report data is input for score calculations
    • Changes to report affect scores
    • Error corrections on report improve scores if negative items removed
    • Each bureau’s report generates separate score (three scores minimum)

    Why both matter:

    • Reports: Detailed accuracy verification, error identification, comprehensive history
    • Scores: Quick creditworthiness indicator, lending decision metric, improvement tracking
    • Need both: Reports for accuracy, scores for monitoring results

    Why Understanding Credit Reports Matters

    Without understanding credit reports, individuals miss errors affecting 20% of consumers until loan applications discovering problems too late for timely correction, identity theft remains undetected allowing fraud escalation damaging credit over months or years, and report content driving score calculations goes unverified despite inaccuracies potentially reducing scores unnecessarily—while report-literate individuals check reports annually from all three bureaus identifying errors immediately, dispute inaccuracies through proper channels correcting reports within 30 days, and monitor for fraud through unauthorized accounts or inquiries preventing damage accumulation, creating protection and accuracy impossible for those ignoring reports treating credit as invisible system until needing borrowing discovering report problems creating application delays or denials from preventable errors correctable through regular review.

    Understanding credit reports enables individuals to:

    • Access free reports annually avoiding paid monitoring unnecessary expense
    • Identify errors early through systematic review before loan applications
    • Dispute inaccuracies through proper channels achieving corrections within 30 days
    • Detect identity theft through unauthorized accounts preventing fraud escalation
    • Understand report content feeding score calculations enabling strategic optimization
    • Compare three bureau reports identifying discrepancies requiring correction
    • Monitor report changes tracking credit management results over time

    Credit report knowledge transforms reports from ignored documents into actively monitored records enabling error detection, fraud prevention, and accuracy verification protecting creditworthiness through regular systematic review impossible without understanding report structure, content, access methods, and dispute processes.

    Common Misunderstandings

    Many people assume checking own credit report damages credit scores. In reality, checking own reports through AnnualCreditReport.com or monitoring services counts as soft inquiry with zero score impact, unlimited self-checks permitted and encouraged for fraud detection and accuracy verification, proving self-monitoring beneficial not harmful enabling regular review impossible when avoided based on false belief that checking hurts scores creating vulnerability to undetected errors and fraud.

    Another common misconception is credit reports and credit scores are same thing. In practice, credit reports provide detailed account-by-account history and personal information while credit scores condense report data into single number, reports free annually but don’t include scores, scores calculated from report data but available separately, proving reports and scores distinct with different purposes requiring both for complete credit understanding versus treating them as interchangeable when reports provide detail enabling error detection while scores provide monitoring metric.

    Some believe disputing accurate negative information removes it from reports. However, bureaus investigate disputes by verifying accuracy with creditors, legitimate negative items (actual late payments, collections, bankruptcies) remain on reports if verified accurate despite dispute attempts, and only actual errors removable through dispute process, proving disputes effective for correcting inaccuracies but not removing accurate negatives regardless of inconvenience requiring realistic expectations about dispute outcomes versus assumption that aggressive disputing removes any unwanted item.

    How Credit Report Understanding Fits Into Financial Success

    Credit report understanding enables error detection preventing score damage from reporting mistakes affecting loan approvals and interest rates, provides fraud detection through regular monitoring catching identity theft before damage escalates, and creates accuracy foundation ensuring credit scores reflect actual behavior not data errors—making report literacy essential component of credit management impossible without knowing how to access reports free, review systematically identifying errors, and dispute effectively correcting inaccuracies, transforming reports from ignored background system into actively monitored records protecting creditworthiness through regular verification enabling optimal credit standing.

    For example, two individuals both applying for mortgages. Person A never checks credit reports assuming scores sufficient monitoring, relies exclusively on Credit Karma VantageScore tracking trends. Applies for $350,000 mortgage, lender pulls credit reports discovering: 30-day late payment on credit card Person A doesn’t recognize (identity mix-up, belongs to person with similar name and address), collection account from medical bill Person A paid but creditor failed to update, closed credit card showing as open with $5,000 balance (account actually paid and closed 2 years ago). FICO scores impacted by errors: 685 actual vs 740 potential without errors. Offered 7.25% rate based on 685 score = $2,027 monthly payment. Disputes errors at application but 30-day investigation delays closing, creates stress, rate lock expires requiring relock at potentially higher rate. After corrections (45 days): Score rises to 738, refinances within year to better rate but pays closing costs again ($8,000). Total damage from undetected errors: 45-day closing delay, potential rate relock costs, stress, extra refinance closing costs. Person B understands report importance, checks all three reports annually via AnnualCreditReport.com every January. During routine review January 2025 discovers same three errors Person A encountered: Identity mix-up late payment, paid collection showing unpaid, closed account showing open. Immediately files disputes with all three bureaus (online and certified mail): Identity mix-up resolved (person has different SSN, removed from report), collection updated to paid status, closed account corrected. Within 30 days all corrections complete. Monitors Credit Karma score increase from 685 to 735 reflecting corrections. Six months later applies for mortgage with clean accurate reports, FICO scores 738, approved 6.5% rate = $1,896 monthly payment. Smooth application process, no delays, no surprises. Difference: Person A’s report ignorance created errors accumulating undetected until mortgage application causing 45-day delay, potential rate issues, extra $8,000 refinance costs, stress from unexpected problems. Person B’s annual report review caught identical errors early enabling correction 6 months before borrowing creating clean application, better rate ($131 monthly savings = $47,160 over 30 years), zero delays or complications. Same errors, $47,000+ difference from report monitoring enabling early detection and correction versus reactive discovery during application.

    Credit report understanding separates proactive monitors catching and correcting errors before they matter from reactive discoverers finding problems during applications creating delays, costs, and stress from preventable issues detectable through simple annual free report review.

    Recent Updates and Trends

    In recent years, medical debt reporting restrictions have tightened—paid medical collections removed from reports (2022), medical collections under $500 no longer reported (2023), one-year waiting period before unpaid medical debt appears on reports, reducing medical debt credit impact though remaining medical collections still affect scores if over $500 and unpaid beyond waiting period.

    Tax lien and civil judgment removal from major bureau reports occurred 2018—Equifax, Experian, TransUnion stopped including most tax liens and civil judgments due to accuracy concerns, improving scores for millions but reducing comprehensive public record visibility creating data gaps in credit histories versus historical full public record inclusion.

    Free weekly credit reports temporarily available during COVID pandemic (2020-2023) through AnnualCreditReport.com enabling weekly monitoring, program ended 2023 returning to annual free reports though provided consumers extended monitoring period during economic uncertainty demonstrating bureau capacity for more frequent free access.

    Alternative data credit reporting has expanded—services like Experian Boost allowing consumers to add utility and phone payments to reports, rent reporting services enabling rent payment credit building, though requiring opt-in and limited lender consideration creating uneven benefit despite theoretical credit access improvements for thin-file consumers.

    Fundamental report principles remain timeless: three bureaus maintain separate reports with potential discrepancies, consumers entitled free annual reports from each bureau via AnnualCreditReport.com, errors affecting 20% of consumers require regular review and dispute, and report accuracy directly impacts credit scores making verification essential—regardless of medical debt restrictions, public record changes, temporary free report programs, or alternative data expansion, understanding how to access reports free, review systematically, identify errors, and dispute effectively produces superior outcomes through report accuracy protection versus ignoring reports until problems discovered during borrowing applications.

    3 Things You Can Do Today

    Ready to take control of your credit reports? Here are three simple steps you can take right now:

    1. Request all three free credit reports from AnnualCreditReport.com and schedule annual review reminder – Visit AnnualCreditReport.com (ONLY official free source, avoid FreeCreditReport.com and similar paid services). Request reports from all three bureaus: Equifax, Experian, TransUnion (three separate reports). Download and save PDFs for records. Review each report section: Personal information (check accuracy of name, address, SSN), accounts (verify every account belongs to you and balances correct), payment history (confirm no incorrect late payments), inquiries (recognize all hard inquiries), collections/public records (dispute any you don’t recognize). Common errors to identify: Accounts not yours (identity mix-up or fraud), closed accounts showing open, incorrect balances or credit limits, late payments marked incorrectly, duplicate accounts, information exceeding reporting limits (7 years most items, 10 years bankruptcies). Set annual calendar reminder: Same date yearly (example: every January 15) to request and review reports systematically. Alternative staggered approach: Request one bureau every 4 months (Equifax January, Experian May, TransUnion September) for continuous monitoring. Takes 45-60 minutes initial review establishing baseline, 30 minutes annually ongoing protecting against errors and fraud through systematic verification impossible without regular report access and review.

    2. If errors found, file disputes immediately with affected bureaus documenting everything – For each error identified, gather supporting documentation: Account statements proving payment made on time, correspondence with creditors, receipts, identity documents if mix-up. File dispute with bureau(s) showing error (may need to dispute with all three if error appears on multiple reports). Online dispute (recommended for speed): Visit bureau dispute centers (equifax.com, experian.com, transunion.com), create account, select disputed items, upload supporting documents, submit. Track confirmation number and status. Mail dispute (recommended for serious issues): Write letter including: full name, address, SSN, date of birth, report confirmation number, specific items disputed with account numbers, clear explanation of error and correct information, request for deletion or correction, copies (not originals) of supporting documents, signature and date. Send certified mail return receipt requested: Creates proof of dispute and timeline. Follow up 30 days: Check dispute status, receive results, verify corrections on updated report. If rejected: Contact creditor directly, dispute with other bureaus, add consumer statement, file CFPB complaint if appropriate. Takes 20-30 minutes per error filing disputes, 30 days investigation period, potentially significant score improvement if negative errors removed making immediate action essential versus delaying allowing errors to continue damaging credit scores unnecessarily.

    3. Set up free credit monitoring through Credit Karma or credit card issuer for ongoing fraud detection between annual reports – Choose free monitoring service: Credit Karma (TransUnion and Equifax VantageScore 3.0), credit card issuer monitoring (check if your cards offer free monitoring, many do), Experian app (free Experian report and FICO 8 score). Create account providing required information, link to credit reports. Configure alert preferences: New accounts opened, hard inquiries, significant balance changes, potential fraud indicators. Check monthly minimally: Review account list (new accounts you didn’t open?), inquiry list (applications you didn’t make?), balance changes (unusual activity?), alerts received. Between annual full report reviews, monitoring catches: Identity theft through unauthorized new accounts, fraudulent inquiries, unexpected score changes indicating reporting issues. Monitoring supplements not replaces annual full report review from AnnualCreditReport.com (monitoring shows trends, annual reports show comprehensive detail enabling thorough error checking). Takes 15 minutes setup, 5 minutes monthly monitoring creating ongoing fraud detection and trend awareness impossible without systematic monitoring between comprehensive annual reviews protecting against identity theft and providing early warning of credit changes requiring investigation.

    These actions create comprehensive credit report protection within 90 minutes initial investment plus minimal ongoing maintenance—accessed free annual reports establishing baseline and identifying errors, disputed any inaccuracies through proper channels achieving corrections, and established ongoing monitoring detecting fraud between annual reviews—transforming credit reports from ignored background system into actively monitored records protecting creditworthiness through regular verification and fraud detection impossible without systematic access, review, and monitoring creating error protection and identity theft prevention worth thousands through score damage prevention.

    Advertisement
    Reserved space for in-content ad

    Quick FAQ

    How often should I check my credit reports?
    Minimum annually from all three bureaus via AnnualCreditReport.com (federal right to free reports). Recommended approach: Staggered checking every 4 months rotating bureaus (Equifax January, Experian May, TransUnion September) providing year-round monitoring versus single annual check. Before major borrowing: Check all three 3-6 months before mortgage or auto loan application allowing time to identify and correct errors. Identity theft victims or fraud concerns: More frequent checking justified, consider paid monitoring ($10-20 monthly) for daily updates. Free ongoing monitoring: Credit Karma, credit card issuer monitoring supplements annual comprehensive reviews providing alert-based fraud detection between detailed annual report checking. Don’t obsess daily: Monthly monitoring sufficient for most people unless specific fraud concerns, annual thorough review of full reports from AnnualCreditReport.com essential baseline everyone should maintain.

    Will checking my own credit report hurt my credit score?
    No—complete myth preventing beneficial monitoring. Checking own credit through AnnualCreditReport.com, Credit Karma, credit card monitoring, or direct bureau requests counts as soft inquiry with ZERO score impact ever. Unlimited self-checks permitted and encouraged for error detection and fraud monitoring. Hard inquiries (affecting scores 5-10 points temporarily) only occur when LENDERS check credit for YOUR APPLICATIONS—you applying for credit card, mortgage, auto loan. Confusion source: People see inquiries on reports and assume all hurt but reports show both soft (no impact) and hard (small impact) separately. Check freely and frequently: Fraud protection, error identification, credit awareness all beneficial without scoring penalty. Monitoring own credit encouraged by consumer protection agencies and credit bureaus as identity theft prevention and accuracy verification best practice.

    Why are my three credit reports different from each other?
    Normal variation from independent data collection: Each bureau (Equifax, Experian, TransUnion) maintains separate database, not all creditors report to all three bureaus creating data discrepancies, reporting timing varies (one bureau updated, others lag days or weeks), account opening/closing dates may differ slightly. Common differences: Credit card appears on two bureaus not third (creditor only reports to two), balances differ (different update dates this month), closed account shows different dates (creditor reported closing to bureaus on different days). Identical reports unusual: Most people have slight variations across three reports, major discrepancies indicate potential errors requiring investigation. What to do: Review all three reports annually, identify significant discrepancies (not minor date/balance variations), dispute errors with bureau showing incorrect information. Don’t expect perfect alignment: Three independent systems create natural variation, focus on correcting material errors not minor administrative differences.

    How long do negative items stay on my credit report?
    Standard reporting timelines: Late payments 7 years from delinquency date, collections 7 years from original delinquency date (not collection date or payment date—clock starts when account first became late leading to collection), charge-offs 7 years from charge-off date, Chapter 13 bankruptcy 7 years from filing date, Chapter 7 bankruptcy 10 years from filing date, foreclosures 7 years, repossessions 7 years, hard inquiries 2 years (affect scores first 12 months only). Timeline clock: Starts from original delinquency or event date NOT from payment date or discovery date. Example: Account became 120 days late January 2020 then sent to collections, collection appears until January 2027 (7 years from original delinquency) regardless when paid. Paid vs unpaid: Timeline identical—paying collection doesn’t restart clock or extend reporting period but updates status to “paid” which newer scoring models (FICO 9, VantageScore 3.0/4.0) ignore though most lenders use older models still counting paid collections. After timeline: Items automatically removed, no action required though monitoring report confirming removal recommended.

    Can I dispute accurate negative information to get it removed?
    No—disputes designed for correcting inaccuracies not removing accurate negatives. Legitimate negative items (actual late payments you made, real collections, bankruptcies filed, accounts genuinely charged off) remain on reports if verified accurate during dispute investigation regardless of inconvenience. Bureau investigation process: Contacts creditor requesting verification of disputed information, creditor confirms accuracy with documentation, item remains on report with “verified” notation. Frivolous disputes: Attempting removal of accurate information wastes time, may be noted on report, doesn’t achieve removal if information legitimate. What works: Disputing actual errors (late payment marked incorrectly when paid on time, account not belonging to you, information exceeding reporting limits), requesting goodwill deletions directly from creditors for isolated late payments (hit-or-miss success), waiting for automatic removal after reporting period expires. Focus effort: Build positive history outweighing negatives over time, dispute genuine errors only, understand accurate negatives remain until timeline expires creating realistic expectations versus false hope that aggressive disputing removes any unwanted item.

    Explore More in Money Basics

    Disclosure

    This article provides general educational information about credit reports. Individual credit report content, error prevalence, and dispute outcomes vary significantly based on personal circumstances. AnnualCreditReport.com is the only official source authorized by federal law for free annual credit reports—other sites may charge fees or require subscriptions. Dispute timelines represent general guidelines—actual investigation periods vary. FTC error prevalence statistics based on 2012 study—current rates may differ. This is not credit repair services, legal advice, or guarantee of dispute success. Legitimate disputes address actual errors—attempting removal of accurate negative information unlikely to succeed and potentially problematic. Bureau contact information, dispute processes, and websites current as of publication but subject to change. Free monitoring services business models may change affecting availability. Paid monitoring services pricing varies. Medical debt reporting changes and public record removal policies subject to modification. Consult qualified professionals including consumer law attorneys for serious credit report disputes or identity theft situations. Focus on building positive credit history and maintaining accurate reports rather than attempting removal of legitimate negative information. Advertisements or sponsored content may appear within or alongside this content. All information presented independently for educational purposes only.

  • 4.5 FICO vs VantageScore: What’s the Difference and Which One Matters More?

    4.5 FICO vs VantageScore: What’s the Difference and Which One Matters More?

    FICO and VantageScore represent two competing credit scoring models—FICO created by Fair Isaac Corporation dominating lending decisions (used by 90% of top lenders) since 1989 versus VantageScore developed jointly by three credit bureaus (Equifax, Experian, TransUnion) in 2006 gaining consumer monitoring visibility but limited lending adoption—both producing 300-850 scale scores from credit report data but using different proprietary algorithms, factor weights, scoring methodologies, and calculation approaches creating score variations typically 20-50 points between models for same person same data. While FICO remains industry standard for mortgage, auto loan, and credit card lending decisions making it primary score affecting actual borrowing costs and approval odds, VantageScore dominates free consumer monitoring (Credit Karma, credit card apps) creating confusion when monitoring scores differ from lending decision scores, requiring understanding of which model matters for specific situations and why differences exist enabling strategic optimization focusing efforts on scores actually used by lenders rather than fixating on monitoring scores potentially irrelevant to borrowing decisions.

    Notebook sketch explaining personal finance

    This article is designed for anyone confused by multiple different credit scores, individuals wondering why Credit Karma score differs from mortgage lender’s score, or those wanting comprehensive understanding of scoring model landscape. You do not need technical expertise to understand FICO versus VantageScore differences—fundamental distinctions accessible through clear comparisons and examples, though requires attention to usage patterns distinguishing monitoring contexts (where VantageScore common) from lending contexts (where FICO dominates) enabling appropriate score prioritization impossible without model differentiation understanding clarifying which scores matter most for actual financial decisions versus which provide useful monitoring trends despite limited direct lending relevance.

    Understanding FICO versus VantageScore matters because monitoring wrong score creates false sense of creditworthiness when lenders use different model, score variations between models (20-50 points typical) affect approval expectations and rate estimates requiring model-specific awareness, and optimization efforts should target FICO as lending standard rather than exclusively improving VantageScore visible in free apps—while model-literate individuals focus improvement on FICO scores actually used for lending decisions, understand score variations as normal model differences not data errors, and use VantageScore monitoring for trends while recognizing FICO determines actual borrowing outcomes, creating realistic expectations and appropriate strategic focus impossible for those treating all credit scores as interchangeable despite fundamental model differences affecting lending relevance and decision-making importance.

    Educational disclaimer: This article provides general educational information comparing FICO and VantageScore credit scoring models. Both models use proprietary algorithms with exact formulas secret and subject to change. Lender adoption patterns and model usage vary by institution and credit product. Individual score results vary based on unique credit profiles. This is not financial advice, credit counseling, or recommendation of specific actions. Consult qualified financial professionals for personalized guidance. Focus on building positive credit behaviors benefiting all scoring models rather than gaming specific model differences.

    Model Origins and Market Position

    FICO Score History and Dominance

    Company background:

    • Created by Fair Isaac Corporation (founded 1956, originally Fair, Isaac and Company)
    • First credit score introduced 1989
    • Industry standard for 35+ years
    • Publicly traded company (NYSE: FICO)

    Market dominance statistics:

    • Used by 90% of top lenders for lending decisions
    • Mortgage lending: FICO versions 2, 4, 5 industry standard (Fannie Mae, Freddie Mac requirements)
    • Auto lending: FICO Auto Score 8 and 9 primary models
    • Credit card issuers: FICO Bankcard Score 8 and 9 common
    • Banking/lending industry: FICO synonym for “credit score”

    Version proliferation:

    • FICO 8: Most common consumer monitoring version (2009)
    • FICO 9: Newer version with limited adoption (2014)
    • FICO 10/10T: Latest versions with trended data (2020, slow adoption)
    • Industry-specific variants: Mortgage FICO (2/4/5), Auto FICO, Bankcard FICO
    • 49 different FICO scores possible per person (base versions × 3 bureaus + industry-specific variants)

    VantageScore Origins and Growth

    Collaborative creation:

    • Developed jointly by Equifax, Experian, TransUnion (2006)
    • Purpose: Create standardized alternative to FICO
    • Goal: Consistent scoring across all three bureaus
    • Revenue motivation: Credit bureaus sharing VantageScore revenue versus paying FICO licensing fees

    Version evolution:

    • VantageScore 1.0 (2006): 501-990 scale, limited adoption
    • VantageScore 2.0 (2010): 501-990 scale, improved algorithm
    • VantageScore 3.0 (2013): 300-850 scale matching FICO, gained traction
    • VantageScore 4.0 (2017): Current version, machine learning enhancements

    Current market position:

    • Lending decisions: Limited adoption (estimated 5-15% of lenders)
    • Consumer monitoring: Dominant in free credit score apps (Credit Karma, NerdWallet, many credit card issuers)
    • Growing but not displacing FICO in lending
    • 10+ billion VantageScores used annually (mostly consumer viewing, not lending decisions)

    Why Two Models Exist

    Business dynamics:

    • FICO advantage: First mover, established standard, proven predictive accuracy, industry inertia
    • Bureau motivation: VantageScore allows bureaus to capture revenue versus paying FICO, control model evolution
    • Lender inertia: Switching costs high (systems, underwriting models, regulatory approval)
    • Regulatory factors: Fannie Mae/Freddie Mac require FICO for mortgages (enormous market lock-in)

    Consumer visibility paradox:

    • Most consumers see VantageScore (free monitoring apps)
    • Most lenders use FICO (lending decisions)
    • Creates confusion: “My Credit Karma score is 720, why did lender say 685?”
    • Answer: Credit Karma shows VantageScore, lender pulled FICO
    Advertisement

    Financial Wellness Planner

    Key Differences in Scoring Methodology

    Factor Weighting Comparison

    FICO Score components (exact percentages):

    • Payment History: 35%
    • Amounts Owed (Utilization): 30%
    • Length of Credit History: 15%
    • New Credit: 10%
    • Credit Mix: 10%
    • Total: 100%

    VantageScore 3.0/4.0 components (influence levels, not exact percentages):

    • Payment History: Extremely Influential (40-45% estimated)
    • Age and Type of Credit: Highly Influential (20-25% estimated)
    • Percent of Credit Used (Utilization): Highly Influential (20-25% estimated)
    • Total Balances/Debt: Moderately Influential (10-15% estimated)
    • Recent Credit Behavior and Inquiries: Less Influential (5-10% estimated)
    • Available Credit: Less Influential (3-5% estimated)

    Key weighting difference: VantageScore doesn’t publish exact percentages, uses influence categories instead

    Minimum Scoring Requirements

    FICO requirements:

    • Minimum 6 months credit history
    • At least one account reported to bureaus in last 6 months
    • At least one undisputed account on file
    • Cannot score: Deceased individuals, too-thin files (under 6 months)

    VantageScore requirements:

    • Minimum 1 month credit history (VantageScore 3.0/4.0)
    • At least one account reported in last 24 months (doesn’t need to be recent)
    • More forgiving for thin files
    • Can score individuals FICO cannot

    Practical impact:

    • New to credit: VantageScore appears faster (1 month vs 6 months)
    • Thin file: VantageScore may score when FICO shows “insufficient history”
    • 35 million Americans scoreable by VantageScore but not FICO (estimated)

    Treatment of Specific Items

    Paid collections:

    FICO 8 and earlier (most lending):

    • Counts paid collections same as unpaid
    • Remains on report 7 years, impacts score entire period
    • Paying collection doesn’t improve FICO 8 score

    FICO 9 (limited adoption):

    • Ignores paid collections completely
    • Paying collection can boost FICO 9 score 15-30 points
    • But most lenders still use FICO 8 or older (mortgage uses FICO 2/4/5)

    VantageScore 3.0/4.0:

    • Ignores paid collections (like FICO 9)
    • Paying collection improves VantageScore
    • More consumer-friendly but less relevant if lender uses FICO 8

    Medical collections:

    • FICO 9: Reduces weight of medical collections
    • VantageScore 4.0: Completely ignores medical collections under $250
    • FICO 8 and earlier: Treats medical collections like any collection

    Closed Account Treatment

    FICO methodology:

    • Closed accounts continue aging and affecting average age for 10 years
    • Closing account has minimal immediate impact on average account age
    • After 10 years: Closed account falls off, average age recalculates

    VantageScore methodology:

    • Closed accounts immediately stop counting toward average age
    • Closing old account drops average age immediately
    • Larger immediate score impact from closing accounts

    Example impact:

    • Close 10-year-old account when other accounts average 4 years
    • FICO: Average stays approximately 4 years (closed account still counts)
    • VantageScore: Average drops to 3 years (closed account excluded)
    • Score difference: FICO minimally affected, VantageScore drops 20-30 points

    Trended Data Usage

    Traditional approach (FICO 8, VantageScore 3.0):

    • Single snapshot evaluation
    • Current balance, current utilization, current status
    • No consideration of trends over time

    Trended data approach (FICO 10T, VantageScore 4.0):

    • Analyzes 24+ months of balance history
    • Identifies patterns: Paying down vs building up balances
    • Rewards positive trends (reducing debt)
    • Penalizes negative trends (increasing balances monthly)

    Current adoption:

    • FICO 10T: Introduced 2020, very limited lender adoption to date
    • VantageScore 4.0: Includes trended data, growing adoption in monitoring
    • Most lending still uses snapshot models (FICO 8, FICO 2/4/5)

    Score Variations and Differences

    Typical Score Differences

    Same person, same data, both models:

    • VantageScore vs FICO variation: 20-50 points typical
    • Can be higher or lower depending on profile
    • Not an error—different formulas produce different results

    Example real-world comparison:

    • FICO 8 (Experian): 735
    • VantageScore 3.0 (Experian): 715
    • Same credit report data, 20-point difference from model calculation variance

    Factors Causing Larger Variations

    Profile characteristics creating bigger FICO vs VantageScore gaps:

    Paid collections present:

    • FICO 8: Counts against score
    • VantageScore 3.0/4.0: Ignores
    • Result: VantageScore potentially 30-60 points higher

    Recently closed accounts:

    • FICO: Minimal immediate impact
    • VantageScore: Immediate average age drop
    • Result: VantageScore potentially 20-40 points lower

    Thin file (limited history):

    • FICO: May not score at all (under 6 months)
    • VantageScore: Scores with 1 month history
    • Result: VantageScore exists, FICO shows “insufficient data”

    Multiple recent inquiries:

    • FICO: 14-45 day rate shopping window (de-duplication)
    • VantageScore: 14-day window (narrower)
    • Result: VantageScore may penalize more inquiries as separate

    Score Range Distribution Differences

    Both use 300-850 scale (VantageScore 3.0/4.0 forward) but population distribution varies:

    FICO score distribution:

    • 800-850 (Exceptional): 20-21% of consumers
    • 740-799 (Very Good): 25% of consumers
    • 670-739 (Good): 21% of consumers
    • 580-669 (Fair): 18% of consumers
    • 300-579 (Poor): 16% of consumers

    VantageScore distribution (slightly different):

    • 781-850 (Excellent): 23% of consumers
    • 661-780 (Good): 38% of consumers
    • 601-660 (Fair): 21% of consumers
    • 500-600 (Poor): 14% of consumers
    • 300-499 (Very Poor): 4% of consumers

    Implication: Same score number may represent different percentile ranking in each model

    Advertisement
    Reserved space for in-content ad

    Which Score Do Lenders Use?

    Mortgage Lending

    Industry standard (95%+ of mortgages):

    • FICO Score 2 (Experian/Fair Isaac Risk Model v2)
    • FICO Score 4 (TransUnion FICO Risk Score 04)
    • FICO Score 5 (Equifax Beacon 5.0)

    Methodology:

    • Pull all three FICO mortgage scores (versions 2, 4, 5)
    • Use middle score (not average) for decision
    • Example: 735 (Experian), 720 (TransUnion), 728 (Equifax) → Use 728
    • For joint applications: Use lower middle score of two applicants

    Why old versions:

    • Fannie Mae/Freddie Mac (buy 50%+ of mortgages) require FICO 2/4/5
    • Lenders must meet their standards to sell loans
    • Versions from 1990s still mandated despite newer models available
    • Proposed changes to allow FICO 10T/VantageScore 4.0 in future (years away)

    VantageScore in mortgages:

    • Essentially zero current usage
    • Not accepted by Fannie/Freddie
    • Monitoring your VantageScore irrelevant to mortgage approval

    Auto Lending

    Primary models:

    • FICO Auto Score 8 (most common)
    • FICO Auto Score 9 (growing adoption)
    • Regular FICO 8 (some lenders)
    • Industry-specific weighting for auto loan context

    VantageScore usage:

    • Minimal but growing (estimated 10-15% of auto lenders)
    • Some subprime auto lenders use VantageScore
    • Still FICO-dominant overall

    Credit Card Issuers

    Decision models:

    • FICO Bankcard Score 8 (very common)
    • FICO Bankcard Score 9 (growing)
    • Regular FICO 8 (many issuers)
    • Mix of models across industry

    Monitoring scores provided to cardholders:

    • Chase: VantageScore 3.0
    • Capital One: VantageScore 3.0
    • Discover: FICO Score 8 (Experian)
    • American Express: FICO Score 8 (Experian)
    • Citi: FICO Bankcard Score 8

    Paradox: Chase shows you VantageScore but uses FICO for approval decisions

    Personal Loans

    More variation across lenders:

    • Traditional banks: Usually FICO 8 or FICO 9
    • Online lenders: Mix of FICO and VantageScore
    • Some fintech lenders: VantageScore 3.0/4.0
    • Subprime lenders: Often VantageScore

    Monitoring Services

    Free consumer services (VantageScore dominant):

    • Credit Karma: VantageScore 3.0 (TransUnion and Equifax)
    • Credit Sesame: VantageScore
    • NerdWallet: VantageScore via TransUnion
    • Mint: VantageScore via Equifax
    • Many bank apps: VantageScore

    Paid monitoring (FICO available):

    • MyFICO.com: All FICO versions, all three bureaus
    • Experian app: FICO 8 (Experian) free, other versions paid

    Why free services use VantageScore:

    • No licensing fee to FICO (VantageScore owned by bureaus)
    • Lower cost structure enables free offerings
    • FICO charges licensing fees making it expensive for free services

    Practical Implications for Consumers

    Which Score to Monitor

    For general credit health awareness:

    • VantageScore (free via Credit Karma, card issuers) perfectly adequate
    • Trends matter more than exact number
    • Improving VantageScore usually improves FICO too (similar factors)
    • Free and convenient for ongoing monitoring

    For major borrowing preparation:

    • Mortgage: Check FICO 2/4/5 via MyFICO.com (paid but accurate for decision)
    • Auto loan: Check FICO Auto Score 8 or regular FICO 8
    • Credit cards: FICO 8 or FICO Bankcard 8
    • Worth paying for accurate score 3-6 months before applying

    Setting Realistic Expectations

    Common scenario creating disappointment:

    • Monitor Credit Karma VantageScore: 730
    • Apply for mortgage, lender pulls FICO 2/4/5: 685
    • 45-point difference, potentially different interest rate tier
    • Consumer feels misled but it’s normal model variation

    Managing expectations:

    • VantageScore for trends and general awareness
    • Expect FICO to differ by 20-50 points (could be higher or lower)
    • Check actual FICO scores before major applications
    • Don’t assume VantageScore equals lending decision score

    Optimization Strategy

    Don’t optimize for specific model:

    • Both models reward: Perfect payments, low utilization, long history
    • Both penalize: Late payments, high utilization, excessive inquiries
    • Fundamental good credit behavior benefits all models

    Model-specific quirks to know:

    If you have paid collections:

    • VantageScore ignores (better score)
    • FICO 8 counts them (lower score)
    • Expect FICO lower than VantageScore
    • Lenders mostly use FICO 8 or older (counts collections)
    • Implication: Don’t rely on VantageScore for true lending decision score

    If you recently closed accounts:

    • FICO minimally impacted (closed accounts still age)
    • VantageScore drops immediately (excludes closed accounts)
    • Expect VantageScore lower than FICO

    If you’re new to credit (thin file):

    • VantageScore appears after 1 month
    • FICO requires 6 months
    • Early months: Only VantageScore available
    • After 6 months: Both exist, FICO matters more for lending
    Advertisement
    Reserved space for in-content ad

    Future of Credit Scoring Models

    Potential Model Evolution

    FHFA proposal (Federal Housing Finance Agency):

    • 2022: Proposed allowing VantageScore 4.0 and FICO 10T for mortgages
    • Would end exclusive FICO 2/4/5 mandate
    • Timeline: 2026-2028 potential implementation (years away)
    • Impact: Eventual diversification but slow transition

    Industry resistance to change:

    • Lender systems built around FICO
    • Underwriting models trained on decades of FICO data
    • Regulatory approval processes lengthy
    • Risk aversion (proven models vs unproven alternatives)

    VantageScore growth areas:

    • Monitoring and consumer awareness (already dominant)
    • Fintech lenders (growing adoption)
    • Subprime lending (alternative to FICO)
    • Thin file scoring (competitive advantage over FICO)

    FICO response to competition:

    • FICO 9: Ignored paid collections (matching VantageScore)
    • FICO 10T: Added trended data (matching VantageScore 4.0)
    • UltraFICO: Alternative data (bank accounts, savings)
    • Continuous evolution to maintain dominance

    Likely 5-10 Year Outlook

    Most probable scenario:

    • FICO remains mortgage industry standard (too much inertia)
    • VantageScore gains in consumer lending (cards, personal loans)
    • Monitoring space stays VantageScore-dominated (free services)
    • Gradual diversification not rapid displacement
    • Multiple models coexist (similar to today but more balanced)

    Why Understanding FICO vs VantageScore Matters

    Without understanding FICO versus VantageScore differences, consumers rely on wrong scores expecting VantageScore monitoring to reflect lending decisions using FICO creating approval disappointments and rate surprises, waste effort optimizing for wrong model when lender uses different calculation, and lack realistic expectations around normal score variations between models—while model-literate individuals monitor VantageScore for trends while recognizing FICO determines actual borrowing outcomes, check appropriate FICO versions before major applications (mortgage FICO 2/4/5, auto FICO 8), and understand 20-50 point variations as normal model differences not data errors or credit problems, creating realistic expectations and appropriate strategic focus impossible without model differentiation knowledge clarifying which scores drive actual lending decisions versus which provide convenient monitoring despite limited direct relevance to borrowing costs and approval likelihood.

    Understanding FICO versus VantageScore enables individuals to:

    • Monitor appropriate scores for specific lending contexts (mortgage, auto, cards)
    • Set realistic expectations around score variations between models
    • Avoid disappointment from VantageScore-FICO differences at application time
    • Use free VantageScore monitoring for trends while knowing FICO matters for decisions
    • Check actual FICO scores before major borrowing (worth paid access)
    • Understand model-specific treatment of collections, closed accounts, thin files
    • Focus optimization on fundamental behaviors benefiting all models

    Model knowledge transforms score monitoring from confusing multi-number chaos into organized understanding of monitoring contexts (VantageScore convenient) versus lending contexts (FICO dominant) enabling appropriate score prioritization and realistic expectation-setting impossible without model differentiation awareness.

    Common Misunderstandings

    Many people assume all credit scores interchangeable measuring same thing with same accuracy. In reality, FICO and VantageScore use different formulas producing different results from identical data, FICO dominates lending decisions (90% of lenders) while VantageScore dominates free monitoring (Credit Karma, apps), and 20-50 point variations between models normal not indicative of errors, proving model selection matters enormously for lending relevance versus monitoring convenience with scores not interchangeable despite both using 300-850 scale creating false equivalence assumption when fundamental calculation differences produce meaningfully different numbers.

    Another common misconception is Credit Karma score represents what lenders see. In practice, Credit Karma shows VantageScore 3.0 while most lenders (especially mortgages) use FICO versions creating potential 45+ point differences, proving Credit Karma excellent for free monitoring trends but potentially misleading for lending decision expectations requiring FICO checking before major applications avoiding surprises when lender’s score differs substantially from monitored VantageScore.

    Some believe newer models (FICO 9, VantageScore 4.0) replacing older versions industry-wide. However, mortgage lending still mandates FICO 2/4/5 from 1990s despite 30 years of newer model development, proving industry adoption lags model creation by decades through regulatory requirements and lender inertia, making newest “best” models often least relevant for actual lending decisions versus older proven versions entrenched through Fannie Mae/Freddie Mac requirements impossible to change quickly despite algorithmic improvements in newer scoring methodologies.

    How Model Understanding Fits Into Financial Success

    FICO versus VantageScore understanding prevents reliance on wrong scores creating false creditworthiness impressions and application disappointments, enables appropriate score monitoring using free VantageScore for trends while checking FICO before major borrowing, and creates realistic expectations around normal model variations versus assuming score differences indicate errors—making model literacy essential component of credit optimization impossible without understanding which scores matter for specific contexts, why variations exist, and how to prioritize monitoring versus lending decision scores appropriately rather than treating all credit scores as interchangeable equivalents despite fundamental model differences affecting lending relevance and strategic prioritization requirements.

    For example, two friends both monitoring credit preparing for home buying. Friend A lacks model understanding—monitors Credit Karma VantageScore 3.0 showing 745, assumes this reflects mortgage approval score, budgets for home purchase based on 745 score rate expectations (6.25% APR estimated). Applies for mortgage, lender pulls FICO 2/4/5 showing middle score 695 (50-point lower from paid collection counted by FICO not VantageScore, recently closed old account hurting FICO more than VantageScore). Offered 7.5% rate versus expected 6.25% on $350,000 loan = $225/month more ($1,995 vs $1,770) or $81,000 extra interest over 30 years. Friend A shocked, disappointed, feels misled by Credit Karma though platform showed accurate VantageScore—problem was assuming VantageScore equals lending score lacking model knowledge. Scrambles to either pay extra rate or delay purchase working on FICO improvement. Friend B understands model differences—monitors Credit Karma VantageScore (745) for free trend tracking but knows it’s not lending score. Six months before mortgage application, pays $40 for MyFICO.com showing actual mortgage FICO 2/4/5 scores: 698, 705, 692 (middle 698). Knows to expect ~700 not 745 for mortgage decision. Strategically pays off old collection ($800) improving FICO 9 but not FICO 2/4/5 (older mortgage versions count paid collections same as unpaid—learns this through model research). Instead focuses next 6 months on utilization reduction from 35% to 8% (affects all FICO versions), perfect payment continuation, strategic credit limit increase requests. Six months later applies for mortgage, FICO 2/4/5 scores now: 728, 735, 722 (middle 728). Qualifies for 6.5% rate based on realistic expectations and targeted FICO improvement. Difference: Friend A’s lack of model knowledge created 50-point expectation gap, payment surprise, potential $81,000 extra cost or purchase delay. Friend B’s model understanding enabled realistic expectations, appropriate FICO checking, targeted improvement of scores actually used for decisions producing optimal outcome. Same starting point, $80,000+ difference from model literacy enabling appropriate score monitoring and strategic optimization focus.

    FICO versus VantageScore understanding separates informed borrowers with realistic expectations checking appropriate scores for lending contexts from confused consumers relying on convenient monitoring scores potentially creating major expectation gaps and financial surprises at application time.

    Recent Updates and Trends

    In recent years, FHFA proposed rule changes allowing VantageScore 4.0 and FICO 10T for mortgages potentially ending exclusive FICO 2/4/5 mandate, though implementation timeline extends to 2026-2028 minimum with industry resistance creating uncertainty about actual adoption despite regulatory proposals suggesting eventual diversification.

    VantageScore market penetration has grown in consumer monitoring achieving dominance in free credit score services (Credit Karma, bank apps, credit card portals) reaching billions of score views annually, though lending adoption remains limited estimated 10-15% overall with concentration in fintech and subprime sectors rather than mainstream prime lending still FICO-dominated.

    FICO responded to VantageScore competition through model evolution—FICO 9 ignoring paid collections (matching VantageScore advantage), FICO 10T incorporating trended data (matching VantageScore 4.0 feature), UltraFICO adding alternative data like banking history, proving competitive pressure driving both models toward similar consumer-friendly features though lending adoption of newer FICO versions remains slow.

    Alternative data integration has expanded in both models—rent payments, utility bills, banking patterns considered in newer versions (VantageScore 4.0, FICO 10T, UltraFICO) enabling thin-file consumers to establish scores, though requiring consumer opt-in and producing uneven adoption limiting practical widespread benefit despite theoretical scoring accessibility improvements.

    Fundamental model dynamics remain stable: FICO dominates lending decisions through first-mover advantage and regulatory lock-in (Fannie/Freddie mortgage requirements), VantageScore dominates consumer monitoring through zero-licensing-cost enabling free services, and both models reward similar fundamental behaviors (perfect payments, low utilization, established history) making good credit habits universally beneficial—regardless of proposed rule changes, market penetration growth, competitive model evolution, or alternative data expansion, understanding which model matters for specific contexts, monitoring appropriate scores, and checking lending-decision scores before major applications produces superior outcomes versus treating all credit scores as interchangeable without model-specific awareness.

    3 Things You Can Do Today

    Ready to optimize based on model understanding? Here are three simple steps you can take right now:

    1. Identify which scores you’re currently monitoring and which scores actually matter for your goals – Document current monitoring sources: Credit Karma (VantageScore 3.0), credit card app (check which model—usually VantageScore), bank app (usually VantageScore), other sources. Identify which model each shows: VantageScore 3.0/4.0 vs FICO 8 vs other. List upcoming borrowing goals next 12 months: Mortgage (requires FICO 2/4/5), auto loan (requires FICO Auto 8 or regular FICO 8), credit card (requires FICO 8 or Bankcard 8), personal loan (mix of FICO/VantageScore). Gap analysis: Currently monitoring VantageScore but need mortgage = major mismatch, need FICO 2/4/5 checking. Action plan: Continue free VantageScore monitoring for trends (convenient, no cost), add FICO checking via: Discover credit card free FICO 8, Experian app free FICO 8, MyFICO.com paid ($40) for all mortgage FICO scores if buying home within 6-12 months. Takes 15 minutes creating monitoring-to-lending alignment identifying score gaps and correction strategy versus assuming Credit Karma VantageScore reflects lending decisions creating potential 45+ point expectation mismatch.

    2. Calculate expected FICO vs VantageScore difference based on your profile characteristics – Review credit profile identifying model-specific impact items: Paid collections present? (VantageScore ignores, FICO 8 counts = expect FICO 30-60 points lower). Recently closed old accounts? (VantageScore excludes closed from average age, FICO keeps them = expect VantageScore 20-30 points lower). Thin file under 6 months history? (VantageScore scores after 1 month, FICO requires 6 months = may have VantageScore only). Multiple inquiries outside rate-shopping window? (VantageScore narrower 14-day window vs FICO 14-45 days = VantageScore may penalize more). Calculate directional expectation: If have paid collection, expect FICO 30-60 lower than VantageScore (example: VantageScore 730, expect FICO 670-700). If recently closed accounts, expect VantageScore 20-30 lower than FICO (example: FICO 720, expect VantageScore 690-700). Create realistic range: Credit Karma shows 745 VantageScore, have paid collection = expect mortgage FICO 685-715 not 745 (30-60 point lower). Prevents application shock from model differences versus assuming scores interchangeable. Takes 10 minutes analyzing profile creating model-specific expectations preventing disappointment from normal calculation variance.

    3. If major borrowing within 6-12 months, pay for actual FICO score check establishing lending-decision baseline – Timeline assessment: Mortgage, auto loan, or major credit card application next 6-12 months = justifies $40 FICO checking investment. Purchase MyFICO.com single report ($40) or 3-bureau monitoring ($20/month cancel after one month): Mortgage applicants: Check FICO 2, 4, 5 (all three bureaus, all three versions = 9 scores, use middle of middle three). Auto loan applicants: Check FICO Auto 8 or regular FICO 8. Credit card applicants: Check FICO 8 or Bankcard 8. Compare to free VantageScore: Calculate actual difference (not assumed 20-50 range but YOUR specific variance). Example: VantageScore 730, actual FICO mortgage middle score 685 = 45 points lower, validates need for FICO improvement not VantageScore reliance. Create targeted improvement plan: Know baseline, set target (FICO 720 for rate tier improvement), focus efforts on FICO-relevant behaviors (pay collections if using FICO 9, reduce utilization affecting all versions, perfect payments). Recheck 3-6 months later measuring actual FICO improvement not VantageScore proxy. Takes $40 and 20 minutes establishing accurate lending-decision score baseline versus free monitoring creating potentially false expectations costing thousands through rate tier misplacement from score expectation gaps.

    These actions create model-literate credit monitoring within 45 minutes and $40—identified monitoring-vs-lending score gaps correcting with appropriate FICO access, calculated expected model differences based on profile characteristics setting realistic expectations, and established actual FICO baseline for major borrowing eliminating score surprise at application—transforming credit monitoring from single-score reliance potentially creating 45-point expectation gaps into multi-model awareness with lending-context prioritization producing accurate borrowing readiness assessment.

    Advertisement
    Reserved space for in-content ad

    Quick FAQ

    Why is my Credit Karma score different from my mortgage lender’s score?
    Different models: Credit Karma shows VantageScore 3.0 while mortgage lenders use FICO 2, 4, 5 (versions from 1990s required by Fannie Mae/Freddie Mac). Calculation differences: VantageScore ignores paid collections, uses different factor weights, treats closed accounts differently versus FICO creating 20-50 point variations typical. Specific example: VantageScore 730, FICO mortgage middle score 685 (45-point difference) completely normal from model variance not data errors. Additionally: Credit Karma pulls TransUnion and Equifax only, mortgage lender pulls all three bureaus creating potential data differences. Lender uses middle FICO score not average (example: 735, 720, 728 uses 728 not 727.7 average). Solution: Use Credit Karma for free trend monitoring but check actual FICO 2/4/5 via MyFICO.com ($40) before mortgage application for realistic lending score expectations.

    Which credit score should I focus on improving?
    Focus on fundamental behaviors benefiting ALL models not model-specific optimization: Perfect payment record (most important for both FICO and VantageScore), low credit utilization under 30% ideally under 10% (major factor for both), maintaining old accounts building history length (important for both), spacing credit applications minimizing inquiries (affects both). Model-specific awareness: If have paid collections, know VantageScore ignores (higher score) but FICO 8 and older count them (lower score), lenders mostly use FICO not VantageScore so FICO number matters more. If recently closed accounts, VantageScore affected more than FICO. Strategy: Monitor VantageScore free (convenient trends), check FICO before major borrowing (lending relevance), improve behaviors benefiting both (payment history, utilization, history length) rather than gaming model-specific quirks with limited practical value.

    Are lenders going to start using VantageScore instead of FICO?
    Slow gradual increase but FICO dominance continuing: Mortgage lending—FICO 2/4/5 mandated by Fannie Mae/Freddie Mac (50%+ of market), proposed rule changes allowing VantageScore 4.0 but implementation 2026-2028 minimum with substantial industry resistance making rapid adoption unlikely. Auto lending—FICO Auto Score dominant, VantageScore 10-15% adoption growing slowly. Credit cards—mix of FICO and VantageScore with FICO still majority. Personal loans—more VantageScore adoption especially fintech lenders but traditional banks mostly FICO. Reality: Both models coexisting next 5-10 years minimum, FICO maintaining lending majority especially mortgages (too much infrastructure, regulatory, and data investment to change quickly), VantageScore growing in edges (fintech, subprime, monitoring) but not displacing FICO mainstream. Recommendation: Understand both, prioritize FICO for major lending, use VantageScore for convenient free monitoring.

    If I have a thin credit file which score should I build first?
    VantageScore appears first (1 month minimum history) but FICO matters more long-term (6 months minimum, dominates lending): Month 1-5: Only VantageScore exists (FICO shows “insufficient history”), use VantageScore monitoring tracking initial progress, continue building positive history (on-time payments, low utilization). Month 6+: FICO appears, becomes primary focus for lending relevance. Strategy: Start building immediately knowing VantageScore provides early feedback, maintain behaviors benefiting both models (perfect payments, low utilization, account longevity), after 6 months check FICO not just VantageScore for lending readiness, by month 12-24 both scores exist and behaviors optimizing one optimize both. Don’t obsess over which model when starting—fundamental credit building (secured card, perfect payments, low utilization) benefits all scoring systems making model distinction less relevant during initial history establishment than consistent responsible behavior benefiting universal credit standing.

    Does paying off collections help VantageScore but not FICO?
    Partially true but depends on FICO version: VantageScore 3.0/4.0 ignores paid collections completely (paying improves score 15-30 points typical). FICO 8 and earlier (most lending) counts paid collections same as unpaid (paying updates status but doesn’t improve score). FICO 9 ignores paid collections (like VantageScore) but very limited lending adoption—most lenders use FICO 8 or older especially mortgages (FICO 2/4/5 all count paid collections). Reality: Paying collections improves VantageScore monitoring score potentially creating false improvement impression when lenders using older FICO see no change. Still worth paying: Prevents lawsuits and wage garnishment, satisfies debt ethically, may help with manual underwriting even if score unchanged, positions for eventual FICO 9 adoption (long-term). Strategy: Pay collections for non-score reasons, don’t expect FICO 8 improvement, know VantageScore improvement doesn’t necessarily translate to lending score improvement creating monitoring-vs-decision score disconnect requiring awareness.

    Explore More in Money Basics

    Disclosure

    This article provides general educational information comparing FICO and VantageScore credit scoring models based on publicly available information. Both models use proprietary algorithms with exact formulas secret and subject to change without notice. Lender adoption patterns, model usage, and version preferences vary significantly by institution, loan type, and geographic region. Individual score results and model differences vary based on unique credit profiles—typical 20-50 point variations represent averages not guarantees. Model version adoption estimates based on industry research and reports—exact usage statistics proprietary to lenders. FHFA proposed rule changes subject to revision, delay, or cancellation—implementation timelines uncertain. Free monitoring service model identification (VantageScore vs FICO) current as of publication but subject to change. This is not financial advice, credit counseling, or recommendation to prioritize specific scoring models. Consultation with lenders directly regarding which scores they use recommended for application preparation. Focus on fundamental positive credit behaviors benefiting all scoring models rather than attempting model-specific optimization. MyFICO pricing subject to change. Advertisements or sponsored content may appear within or alongside this content. All information presented independently for educational purposes only.
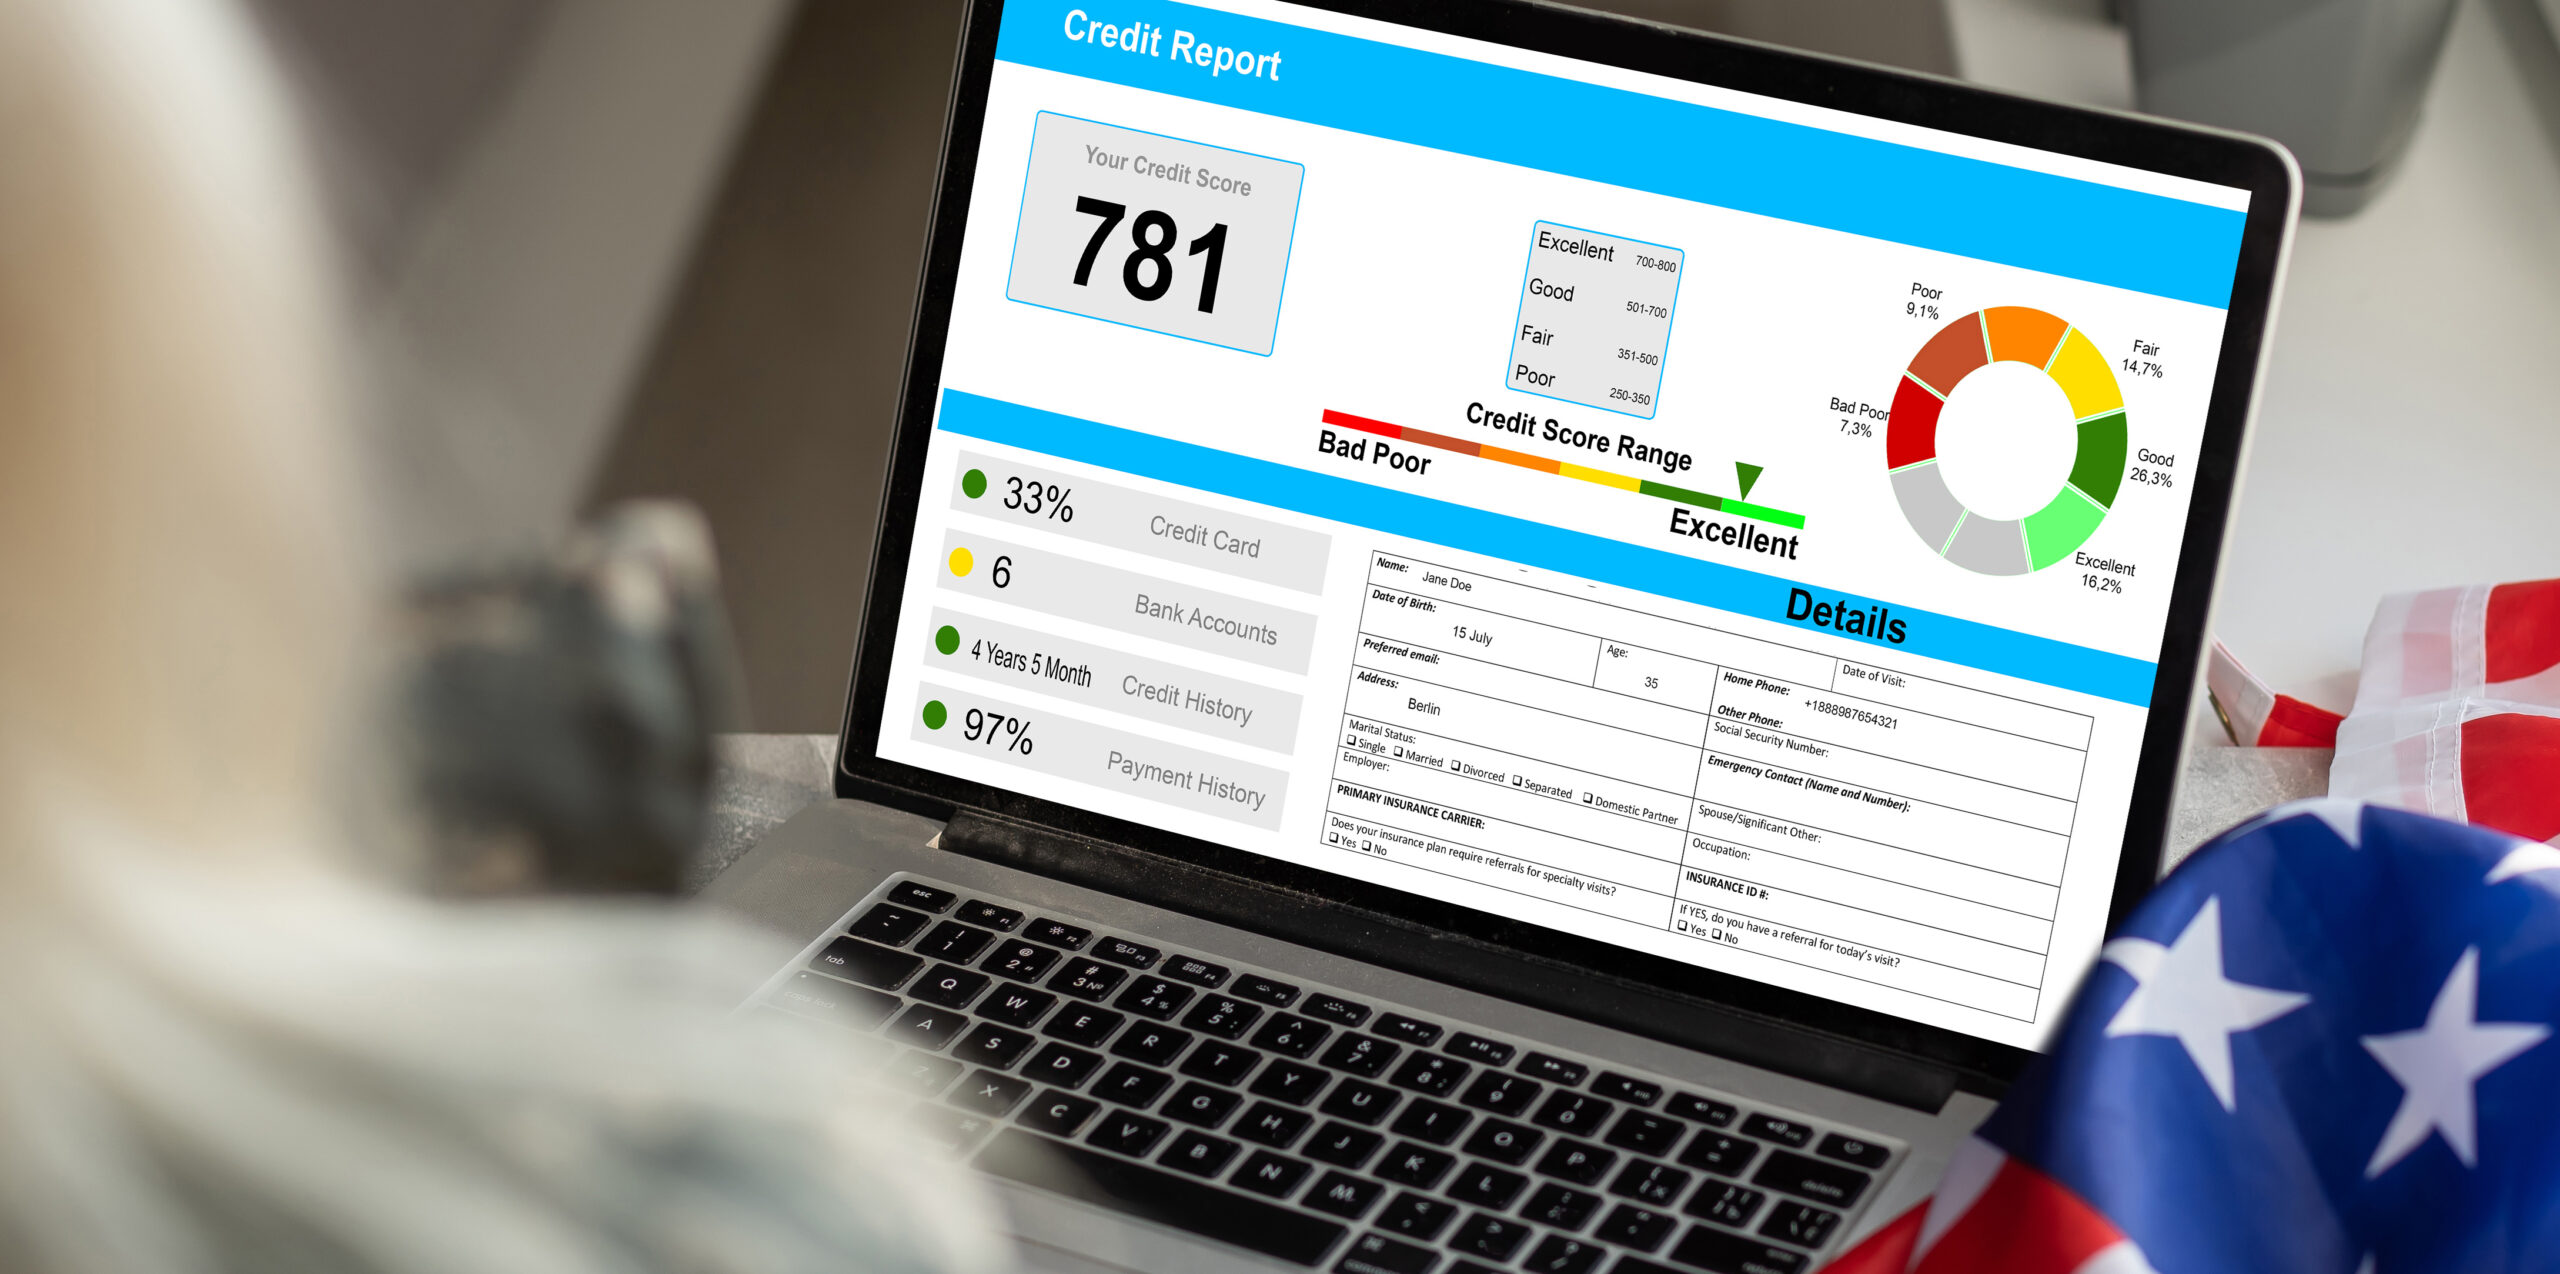
  • 4.4 How Credit Scores Are Calculated (The 5 Factors That Matter Most)

    4.4 How Credit Scores Are Calculated (The 5 Factors That Matter Most)

    Credit scores are calculated through proprietary algorithms analyzing hundreds of data points from credit reports—primarily FICO and VantageScore models weighing payment history (35%), amounts owed (30%), length of credit history (15%), new credit (10%), and credit mix (10%)—processing account balances, payment patterns, delinquencies, credit inquiries, account ages, and credit types into mathematical formulas producing three-digit scores (300-850 range) predicting default likelihood with precision enabling lenders to assess risk quantitatively. Unlike simplistic assumptions that scores equal income or wealth, calculation methodology focuses exclusively on credit behavior analyzing specific mathematical relationships between utilization percentages, payment timing patterns, account age distributions, and inquiry frequencies, creating complex but understandable system where strategic behavior targeting high-weight factors produces measurable predictable score improvements enabling optimization through informed decision-making impossible without calculation methodology understanding revealing precise levers driving score changes.

    Notebook sketch explaining personal finance

    This article is designed for anyone wanting deep technical understanding of score calculations, individuals seeking to optimize specific behaviors for maximum score impact, or those confused why certain actions affect scores unexpectedly. You do not need mathematical expertise to understand calculation fundamentals—core concepts accessible through clear explanations and examples, though requires attention to detail distinguishing between high-impact factors (payment history, utilization) and low-impact variables (credit mix, single inquiry) enabling strategic prioritization focusing efforts where mathematical algorithms weight most heavily producing maximum score improvement per unit effort invested.

    Understanding how credit scores are calculated matters because knowing factor weights enables strategic prioritization of improvement efforts, understanding specific calculation mechanisms (utilization thresholds, payment timing, inquiry aging) reveals optimization opportunities invisible without methodology knowledge, and algorithm comprehension prevents wasted effort on low-impact activities while focusing on high-leverage behaviors—while calculation-literate individuals optimize around 35% payment history and 30% utilization driving 65% of scores, time improvement actions strategically around algorithm refresh cycles and reporting patterns, and avoid common optimization mistakes targeting irrelevant factors, creating superior results versus those attempting score improvement through trial-and-error or focusing equally on all factors despite dramatically different mathematical weights in actual calculation formulas.

    Educational disclaimer: This article provides general educational information about credit score calculation methodologies based on publicly available information from FICO and VantageScore. Exact proprietary algorithms are secret and subject to change. Factor weights represent published general guidance—specific calculations more complex. Individual score results vary based on complete credit profiles. This is not credit repair services or guarantee of specific score improvements. Consult qualified financial professionals for personalized guidance. Legitimate score improvement requires time and responsible behavior.

    The Scoring Model Landscape

    FICO Score Calculation

    FICO model dominance:

    • Used by 90% of top lenders for credit decisions
    • Created by Fair Isaac Corporation (established 1989)
    • Multiple versions: FICO 8 (most common consumer monitoring), FICO 9 (newer, limited adoption), FICO 10/10T (latest, slow rollout)
    • Industry-specific variants: Mortgage FICO (versions 2, 4, 5), Auto FICO (8 and 9), Bankcard FICO (8 and 9)
    • Proprietary formula—exact algorithm secret but general methodology disclosed

    FICO score components (published weights):

    • Payment History: 35%
    • Amounts Owed (Utilization): 30%
    • Length of Credit History: 15%
    • New Credit: 10%
    • Credit Mix: 10%
    • Total: 100%

    VantageScore Calculation

    Alternative model characteristics:

    • Created jointly by three credit bureaus (Equifax, Experian, TransUnion) in 2006
    • Growing adoption but less universal than FICO
    • Current version: VantageScore 4.0 (released 2017)
    • Different weighting than FICO but similar factors
    • Can score with less history than FICO (1 month vs 6 months minimum)

    VantageScore 3.0/4.0 components (influence levels not exact percentages):

    • Payment History: Extremely Influential
    • Age and Type of Credit: Highly Influential
    • Percent of Credit Used (Utilization): Highly Influential
    • Total Balances/Debt: Moderately Influential
    • Recent Credit Behavior and Inquiries: Less Influential
    • Available Credit: Less Influential

    Why Multiple Scores Exist

    Score variation sources:

    • Three bureaus: Equifax, Experian, TransUnion maintain separate databases
    • Reporting differences: Not all creditors report to all three bureaus
    • Data timing: Creditors report different dates creating snapshot variations
    • Model versions: FICO 8 vs FICO 9 vs FICO 2/4/5 weight factors differently
    • FICO vs VantageScore: Completely different formulas despite similar factors

    Typical multi-score example:

    • FICO 8 (Experian): 745
    • FICO 8 (TransUnion): 738
    • FICO 8 (Equifax): 742
    • VantageScore 3.0 (TransUnion): 728
    • Mortgage FICO 5 (Equifax): 725
    • All from same person, same day—normal 20-point variation

    Data Sources: Credit Reports

    Credit report information feeding scores:

    • Account details: Type, opening date, credit limit/loan amount, current balance, payment history
    • Payment records: Monthly on-time status, late payments (30/60/90+ days), charge-offs, collections
    • Public records: Bankruptcies, tax liens, civil judgments
    • Inquiries: Hard pulls (credit applications), soft pulls (pre-qualification, self-checks)
    • Personal information: Name, address, employment (not used in scoring but identifies consumer)

    What’s excluded from calculation:

    • Income, salary, employment status
    • Assets, savings, investments
    • Age, race, gender, marital status, religion
    • Address, residence type (rent vs own)
    • Child support obligations
    • Soft inquiries (checking own credit)
    • Credit counseling participation
    Advertisement

    Financial Wellness Planner

    Payment History: 35% of FICO Score

    What Payment History Analyzes

    Specific data points examined:

    • Payment status: Every account every month (on-time vs late)
    • Delinquency severity: 30, 60, 90, 120+ days past due (progressively worse)
    • Delinquency recency: Recent lates hurt more than old ones
    • Delinquency frequency: One late payment vs pattern of lates
    • Account breadth: Lates on how many accounts (one vs all)
    • Derogatory marks: Collections, charge-offs, foreclosures, repossessions, bankruptcies
    • Public records: Bankruptcies (Chapter 7, 13), tax liens, judgments

    Payment Timing and Reporting

    How late payments get recorded:

    • 1-29 days late: Not reported to bureaus (grace period), may incur late fee
    • 30 days late: Reported to bureaus typically, major score impact
    • 60 days late: Larger score impact, creditor concern escalates
    • 90+ days late: Severe impact, likely collections referral
    • Charge-off: 120-180 days typically, account written off as loss, remains on report

    Reporting cycle mechanics:

    • Creditors report monthly (typically on statement closing date or fixed day)
    • Payment made after reporting date but before due date shows as previous balance
    • Example: Statement closes 15th, payment due 10th next month, pay on 8th—balance already reported on 15th
    • Late payment reported approximately 30 days after missed due date

    Mathematical Impact of Late Payments

    Single 30-day late payment impact by starting score:

    • 780 score: Drop 90-110 points → new score 670-690
    • 680 score: Drop 60-80 points → new score 600-620
    • Higher starting scores experience larger absolute drops (more to lose)
    • Lower scores already reflect prior negatives (less additional damage)

    Recovery timeline from single late:

    • 3 months: 30-50% recovery with perfect subsequent payments
    • 9 months: 70-80% recovery
    • 18-24 months: 90-100% recovery (back near pre-late score)
    • Remains on report: 7 years but impact diminishes over time

    Bankruptcy and Severe Derogatory Impact

    Chapter 7 bankruptcy:

    • Score impact: 130-200 points drop typical
    • Reporting period: 10 years from filing date
    • Example: 720 score drops to 520-590 range

    Chapter 13 bankruptcy:

    • Score impact: 130-180 points drop typical (slightly less than Chapter 7)
    • Reporting period: 7 years from filing date

    Foreclosure/repossession:

    • Score impact: 85-160 points drop
    • Reporting period: 7 years

    Optimization Strategies

    Perfect payment record maintenance:

    • Set up automatic minimum payments as failsafe
    • Calendar reminders 5 days before due dates
    • Enable creditor email/text alerts
    • Budget ensuring funds available for payments

    Late payment damage control:

    • Pay immediately if late (limit to 30 days vs 60/90)
    • Call creditor requesting goodwill deletion (first-time courtesy)
    • Write goodwill letter explaining circumstances
    • Resume perfect payment record immediately

    Key insight: 35% weight makes payment history single most important factor—perfect record essential for excellent scores

    Amounts Owed (Utilization): 30% of FICO Score

    Credit Utilization Calculation

    Formula components:

    • Per-card utilization: Current balance ÷ credit limit = percentage per card
    • Overall utilization: Total balances across all cards ÷ total limits = percentage
    • Both matter: Algorithms evaluate individual card utilization AND aggregate utilization

    Example calculation:

    • Card A: $2,000 balance, $5,000 limit = 40% utilization
    • Card B: $500 balance, $3,000 limit = 17% utilization
    • Card C: $1,000 balance, $10,000 limit = 10% utilization
    • Overall: $3,500 total balance ÷ $18,000 total limits = 19% overall utilization
    • Algorithm considers: 40% on Card A (problematic), 19% overall (good)

    Utilization Thresholds and Score Impact

    Research-identified scoring brackets:

    • 1-9% utilization: Optimal range, maximizes score component
    • 10-29% utilization: Good range, minimal score reduction
    • 30-49% utilization: Fair range, noticeable score impact
    • 50-74% utilization: Poor range, significant score damage
    • 75-99% utilization: Very poor, major score reduction
    • 100% utilization (maxed): Severe damage, signals financial stress

    Score impact examples:

    • Same person, $10,000 total credit limits:
    • 5% utilization ($500 balance): 780 score
    • 30% utilization ($3,000 balance): 745 score (35-point difference)
    • 50% utilization ($5,000 balance): 695 score (85-point difference from 5%)
    • 90% utilization ($9,000 balance): 625 score (155-point difference)

    Utilization Reporting Timing

    Critical understanding—statement balance vs payment due date balance:

    • Creditors report balance on statement closing date (typically)
    • Payment due date is 21-25 days after statement closing
    • Reported balance may not reflect payments made after statement closed

    Example timeline:

    • January 15: Statement closes, balance $3,000 reported to bureaus
    • January 16-February 9: Additional charges and payments occur
    • February 9: Payment due date, pay $3,000 (full statement balance)
    • Credit report still shows: $3,000 balance (from January 15 report)
    • February 15: Next statement closes, $0 balance if no new charges, reported as $0

    Optimization implication:

    • Pay down balances BEFORE statement closing date for lower reported utilization
    • Example: Want 10% utilization on $5,000 limit card, pay down to $500 before statement closes
    • Even if charge back up to $3,000 after statement closes, reported balance stays at $500

    Installment Loan Utilization

    Different calculation for installment loans:

    • Formula: Current balance ÷ original loan amount = percentage
    • Example: $20,000 auto loan, currently owe $15,000 = 75% of original amount
    • Paying down over time improves this ratio
    • Impact: Less significant than revolving credit utilization

    Total Debt Amount

    Algorithm also considers absolute amounts:

    • Total balances across all accounts
    • Number of accounts with balances
    • Higher absolute debt indicates higher risk even if utilization percentages good
    • $50,000 total debt at 20% utilization viewed differently than $5,000 at 20%

    Optimization Strategies

    Rapid score boost techniques:

    Pay down high-utilization cards first:

    • Card over 50%: Priority 1
    • Cards 30-50%: Priority 2
    • Cards under 30%: Maintain
    • Even $500 reduction on high-utilization card can boost score 20-40 points

    Request credit limit increases:

    • Increases denominator, lowers utilization percentage
    • Example: $2,000 balance, $5,000 limit (40%) → limit increased to $8,000 = 25%
    • Request via online portal or phone (often soft inquiry only)
    • Potential 15-30 point score increase from utilization improvement

    Multiple payment strategy:

    • Pay twice monthly instead of once
    • Keeps average daily balance lower
    • Especially effective if statement closing date mid-month

    Strategic balance distribution:

    • Spread $6,000 balance across three $10,000 limit cards = $2,000 each (20% per card)
    • Better than $6,000 on one card (60%) and two cards at $0
    • Overall utilization identical but per-card improved

    Key insight: 30% weight plus fast responsiveness makes utilization highest-impact controllable factor for quick score improvements

    Advertisement
    Reserved space for in-content ad

    Length of Credit History: 15% of FICO Score

    What Length of History Measures

    Specific metrics analyzed:

    • Age of oldest account: How long your oldest credit account has been open
    • Average age of all accounts: Mean age across all accounts
    • Age of newest account: How recently you opened latest account
    • Specific account ages: How long each individual account open
    • Account activity recency: How long since accounts used

    Mathematical Calculation

    Average account age formula:

    • Sum of all account ages ÷ number of accounts = average age

    Example calculation:

    • Account 1: 10 years old
    • Account 2: 5 years old
    • Account 3: 3 years old
    • Account 4: 1 year old
    • Average age: (10 + 5 + 3 + 1) ÷ 4 = 4.75 years

    Impact of Opening and Closing Accounts

    Opening new account effect:

    • Adds zero-age account to calculation
    • Lowers average age immediately
    • Example: 4.75 year average, open new account → (10+5+3+1+0) ÷ 5 = 3.8 years
    • Temporary score impact: 5-15 points reduction from age decrease alone

    Closing account effect (complex):

    • FICO scoring: Closed accounts continue aging and counting toward average for 10 years
    • VantageScore: Closed accounts immediately stop counting
    • Eventually (10 years later): Closed account falls off report, average age recalculates

    Example closing oldest account (10-year history):

    • Current average: 4.75 years (includes 10-year account)
    • Close 10-year account (FICO): Continues counting, no immediate average change
    • Close 10-year account (VantageScore): Average drops to (5+3+1) ÷ 3 = 3 years
    • 10 years later (FICO): Account falls off, average recalculates excluding it

    Optimal Age Benchmarks

    Research-identified thresholds:

    • Under 2 years average: Thin file, limited history, score impact
    • 2-5 years average: Developing history, improving scores
    • 5-10 years average: Established history, good scores achievable
    • 10+ years average: Excellent history, maximizes this component
    • Oldest account benchmarks: 10+ years old optimal, 7+ years good, 3-7 years fair

    Authorized User Strategy

    How it works:

    • Added as authorized user on someone else’s account (parent, spouse)
    • Account appears on your credit report with its full history
    • Inherit account age and payment history
    • Instant history boost if added to old account

    Example impact:

    • Your accounts: 1 year, 2 years (average 1.5 years)
    • Added as authorized user to 15-year-old account
    • New average: (1 + 2 + 15) ÷ 3 = 6 years
    • Potential score increase: 30-60 points from history boost

    Optimal authorized user account characteristics:

    • Old account (7+ years ideal, 10+ years excellent)
    • Perfect payment history (zero lates)
    • Low utilization (under 30%, ideally under 10%)
    • From trustworthy person (risk if they mismanage account)

    Optimization Strategies

    Keep old accounts open:

    • Even unused cards contribute to average age
    • Make small purchase annually preventing issuer closure
    • Set up automatic recurring charge (streaming service) and automatic payment

    Avoid unnecessary account churning:

    • Opening and closing cards frequently lowers average age
    • Keep cards long-term even after earning signup bonuses

    Strategic new account timing:

    • Space new account openings to minimize average age impact
    • If need multiple cards, consider 6-12 month spacing

    Key insight: 15% weight plus slow-building nature makes history length long-term foundation—cannot rush, requires patience and account longevity

    New Credit: 10% of FICO Score

    What New Credit Analyzes

    Specific metrics:

    • Number of recently opened accounts: How many accounts opened in last 12-24 months
    • Time since most recent account opening: Recency of last new account
    • Number of recent credit inquiries: How many hard pulls in last 12 months
    • Time since recent inquiries: How long ago credit applications made
    • Account opening velocity: Rate of new account acquisition

    Hard Inquiry Mechanics

    Hard inquiry (hard pull):

    • Occurs when applying for credit (cards, loans, mortgages)
    • Remains on report: 2 years
    • Affects score: First 12 months only
    • Typical impact: 5-10 points per inquiry
    • Cumulative effect: Multiple inquiries compound damage

    Soft inquiry (soft pull):

    • Checking own credit, pre-qualification offers, employer checks, existing creditor reviews
    • Appears on report (some versions) but NEVER affects score
    • Unlimited soft pulls with zero score impact

    Rate Shopping Exception

    FICO de-duplication window:

    • 14-45 day window: Multiple mortgage or auto loan inquiries count as single inquiry (exact window varies by FICO version)
    • Purpose: Allow rate shopping without penalty
    • Applies to: Mortgages, auto loans, student loans (same-type shopping)
    • Does NOT apply to: Credit cards (each application separate inquiry)

    Example rate shopping:

    • Apply to 5 mortgage lenders within 2 weeks
    • 5 hard inquiries appear on report
    • Score impact: Counts as 1 inquiry (5-10 points vs 25-50 without de-duplication)

    Multiple Application Impact

    Cumulative inquiry effect:

    • 1 inquiry: 5-10 point reduction
    • 3 inquiries (not rate shopping): 15-30 point reduction
    • 6+ inquiries: 30-60 point reduction plus “credit seeking” risk signal

    New account opening impact:

    • Each new account: Reduces average age (15% factor) + signals new credit (10% factor)
    • Combined effect: 10-25 points per new account typical
    • Multiple new accounts quickly: Signals financial stress to algorithms

    Recovery Timeline

    Inquiry impact aging:

    • Month 0-3: Full impact on score
    • Month 3-6: Impact diminishes 30-50%
    • Month 6-12: Minimal remaining impact
    • Month 12+: Zero score impact (though remains on report until month 24)

    New account age impact:

    • Immediate: Lowers average age
    • Over time: Account ages, gradually increases average
    • Full recovery: 12-24 months as account establishes history

    Optimization Strategies

    Strategic application timing:

    • Space credit card applications 3-6 months minimum
    • Concentrate mortgage/auto shopping within 2-week window
    • Avoid applications 6-12 months before major borrowing (mortgage, vehicle)

    Pre-qualification usage:

    • Many lenders offer pre-qualification (soft pull)
    • Check approval odds before formal application
    • Zero score impact from pre-qual checks

    Avoiding unnecessary inquiries:

    • Decline store credit card offers at checkout (each is hard inquiry)
    • Research approval odds before applying
    • Only apply when genuinely need credit

    Key insight: 10% weight makes new credit moderate factor—avoid excessive applications but single inquiry not catastrophic, recovery relatively fast (3-6 months)

    Credit Mix: 10% of FICO Score

    What Credit Mix Analyzes

    Account type categories:

    • Revolving credit: Credit cards, home equity lines of credit (HELOCs), personal lines of credit
    • Installment loans: Mortgages, auto loans, student loans, personal loans
    • Open credit: Charge cards (must pay in full monthly), utility accounts in collections

    Optimal Mix Characteristics

    Algorithms prefer variety demonstrating diverse credit management:

    • At least 2-3 revolving accounts (credit cards)
    • At least 1-2 installment loans (mortgage, auto, student, personal)
    • Mix of account types shows management across different credit structures

    Score impact examples:

    • Only credit cards (3 cards, no loans): 725 score potential
    • Credit cards + mortgage + auto loan: 750 score potential (same other factors)
    • Difference: 25 points from mix alone

    What NOT to Do

    Don’t take loans solely for credit mix:

    • 10% factor is smallest component
    • Taking unnecessary loan to “improve mix” costs interest for minimal score benefit
    • Mix naturally improves over time (mortgage, auto loan eventually)

    Credit builder loans exception:

    • Small loans ($300-1,000) specifically designed for credit building
    • Low cost, adds installment account, builds payment history simultaneously
    • Reasonable option if no other installment accounts and building credit

    Natural Mix Development

    Typical credit evolution:

    • Age 18-22: First credit card (revolving only)
    • Age 22-30: Additional cards, maybe auto loan (mix developing)
    • Age 30-40: Mortgage (mix complete with diverse accounts)
    • Natural progression develops mix without forcing

    Key insight: 10% weight makes credit mix lowest-priority factor—nice to have but don’t force it, focus on major factors (payment history 35%, utilization 30%) for maximum impact

    Advertisement
    Reserved space for in-content ad

    Score Calculation: Bringing It All Together

    Mathematical Weighting Example

    Hypothetical person’s credit profile:

    Payment History (35% weight): 95/100 raw score

    • Perfect payment record last 2 years
    • One 30-day late 3 years ago
    • Weighted contribution: 95 × 0.35 = 33.25

    Amounts Owed (30% weight): 80/100 raw score

    • 25% overall credit utilization
    • One card at 45%, others under 20%
    • Weighted contribution: 80 × 0.30 = 24.0

    Length of History (15% weight): 70/100 raw score

    • 5 years average account age
    • Oldest account 8 years
    • Weighted contribution: 70 × 0.15 = 10.5

    New Credit (10% weight): 85/100 raw score

    • 2 inquiries in last 12 months
    • 1 new account opened 6 months ago
    • Weighted contribution: 85 × 0.10 = 8.5

    Credit Mix (10% weight): 90/100 raw score

    • 3 credit cards, 1 auto loan, 1 student loan
    • Good variety of account types
    • Weighted contribution: 90 × 0.10 = 9.0

    Total weighted score: 33.25 + 24.0 + 10.5 + 8.5 + 9.0 = 85.25/100

    Translated to 300-850 scale: Approximately 735 FICO score

    Note: Actual FICO formula more complex with non-linear relationships and additional variables—this simplified example illustrates general weighting concept

    Optimization Priority Based on Calculation

    ROI ranking for score improvement efforts:

    Tier 1: Highest impact (65% of score)

    • Payment history (35%): Perfect payment record, automate payments
    • Utilization (30%): Target under 10%, pay before statement closing

    Tier 2: Moderate impact (15% of score)

    • Length of history (15%): Keep old accounts open, authorized user strategy

    Tier 3: Minor impact (20% of score combined)

    • New credit (10%): Space applications 3-6 months, use pre-qualification
    • Credit mix (10%): Natural development, don’t force

    Strategic focus allocation:

    • 80% effort → Payment history and utilization (65% of score)
    • 15% effort → Length of history (15% of score)
    • 5% effort → New credit and mix (20% of score)

    Why Understanding Calculation Matters

    Without understanding how credit scores are calculated, individuals waste effort on low-impact factors while neglecting high-leverage behaviors, miss timing-based optimization opportunities around reporting cycles and inquiry aging, and lack framework for strategic prioritization producing maximum score improvement per unit effort—while calculation-literate individuals focus 80% effort on payment history (35%) and utilization (30%) driving 65% of scores, optimize behavior timing around statement closing dates and inquiry windows, and achieve faster measurable score improvements through understanding mathematical weights and thresholds invisible to those treating scores as mysterious black boxes beyond comprehension or strategic control.

    Understanding credit score calculation enables individuals to:

    • Prioritize improvement efforts on highest-weighted factors (65% from two factors)
    • Optimize timing behaviors around reporting cycles and inquiry windows
    • Achieve rapid score boosts through utilization reduction (30-60 days)
    • Build strategic long-term foundation through history length maintenance
    • Avoid wasted effort on minimal-impact factors (credit mix only 10%)
    • Understand score variations across models through weighting differences
    • Calculate expected score impact before making credit decisions

    Credit score calculation knowledge transforms score improvement from random trial-and-error into systematic strategic optimization targeting specific mathematical levers producing predictable measurable results through informed decision-making impossible without algorithm understanding.

    Common Misunderstandings

    Many people assume all five factors equally important requiring equal attention. In reality, payment history (35%) and utilization (30%) combine for 65% of scores making them dramatically more important than credit mix (10%) or new credit (10%), proving strategic focus on major factors produces superior results versus spreading effort equally across all components wasting time on minimal-impact optimizations while neglecting high-leverage behaviors driving majority of score calculation.

    Another common misconception is paying interest helps credit scores by showing “active credit use.” In practice, algorithms analyze payment behavior (on-time vs late) and balances (utilization percentages) regardless of whether interest paid—carrying balances costs money with zero additional score benefit versus paying in full monthly which builds identical payment history and lower utilization without interest costs, proving interest payment wastes money for no scoring advantage based on misunderstanding of calculation methodology evaluating behavior not profit generation for creditors.

    Some believe credit scores primarily reflect income or financial success. However, calculation algorithms analyze exclusively credit behavior (payment patterns, utilization, history length, applications, account types) with zero consideration of income, assets, employment, or net worth—billionaires can have poor scores from missed payments while modest earners maintain 800+ scores through perfect credit management, proving scores measure credit behavior discipline not overall financial standing creating possible disconnect where wealthy individuals have poor credit and careful moderate earners have excellent credit.

    How Calculation Understanding Fits Into Financial Success

    Credit score calculation understanding provides highest-return knowledge investment enabling strategic behavior optimization, focuses limited time and effort on mathematical levers driving majority of score variation, and creates framework for rapid score improvement through targeted actions addressing algorithm-weighted factors—making calculation literacy essential component of credit optimization impossible without understanding factor weights, timing mechanics, and mathematical relationships determining score outputs from behavior inputs enabling deliberate strategic improvement versus random hoping for score increases without systematic approach targeting specific calculation components.

    For example, two people both with 650 scores wanting improvement to 740+ enabling mortgage qualification. Person A lacks calculation understanding—focuses equally on all factors, takes personal loan for “credit mix” paying $500 interest over 2 years, spaces card applications “just in case” though not applying anyway, worries about checking own credit, carries small balances monthly “to show activity.” After 18 months: Score improved to 680 through time passage and continued payments but inefficient improvement from unfocused effort, paid $500 unnecessary interest on forced loan, minimal strategic optimization around high-impact factors. Person B understands calculation methodology—immediately focuses 80% effort on payment history (35% weight) and utilization (30% weight): Sets up automatic payments guaranteeing perfect payment record (eliminates largest risk), aggressively pays down utilization from 60% to 8% (major score component), requests limit increases on all cards (lowers utilization denominator), pays balances before statement closing dates (optimizes reported utilization), keeps all old accounts open (maintains history length), spaces any new applications 6+ months (minimizes new credit impact). After 6 months: Score improved to 720 (70-point increase in half the time) from targeted utilization reduction and perfect payments, no interest paid on forced loans, strategic focus on 65% of score (payment history + utilization). After 18 months: Score reaches 750 (100-point improvement vs Person A’s 30-point) through continued strategic optimization, saved $500 in unnecessary interest, efficient improvement through calculation-informed prioritization. Both started identical 650 scores with similar improvement goals—Person B’s calculation understanding created 3.3x faster score improvement (100 points vs 30 points in same timeframe) plus $500 savings through knowing factor weights enabling strategic effort allocation versus Person A’s equal-focus approach wasting effort on minimal-impact factors.

    Credit score calculation understanding separates strategic optimizers achieving rapid measurable improvements through informed targeting of high-weighted factors from unfocused improvers making slow inefficient progress through trial-and-error lacking mathematical framework for effort prioritization and behavior timing optimization.

    Recent Updates and Trends

    In recent years, FICO 10T introduction has incorporated trended data—analyzing account balance patterns over 24+ months identifying upward or downward trends versus single-snapshot evaluation, though adoption limited to date with most lenders still using FICO 8 or older mortgage versions creating implementation lag despite algorithmic improvements.

    VantageScore 4.0 adoption has grown—newer model treating paid collections differently (ignoring them) and incorporating machine learning techniques, though FICO remains dominant for lending decisions particularly mortgages where FICO 2/4/5 from 1990s still standard despite newer model availability creating disconnect between consumer monitoring scores (newer models) and actual lending scores (older versions).

    Alternative data scoring has expanded—rent payments, utility bills, banking history considered in some models (UltraFICO, Experian Boost) enabling “credit invisible” consumers to establish scores, though requiring consumer opt-in and uneven lender adoption creating limited practical benefit for most borrowers despite theoretical scoring accessibility improvements.

    Free score proliferation has democratized calculation monitoring—credit card issuers providing free FICO scores, apps showing VantageScores, enabling consumers to track scores and understand factor impacts in real-time versus historical paid-only access, though creating confusion about which scores matter for specific lending decisions requiring education distinguishing monitoring from decision scores.

    Fundamental calculation principles remain timeless: payment history and utilization combine for 65% of scores making them primary optimization targets, factor weights drive strategic prioritization of improvement efforts, timing behaviors around reporting cycles and inquiry windows creates optimization opportunities, and understanding mathematical algorithm mechanics enables predictable score improvements—regardless of scoring model evolution, alternative data expansion, adoption lag between versions, or free score accessibility, knowing core FICO/VantageScore calculation methodology focusing on high-weighted factors produces superior outcomes versus unfocused equal-effort approaches treating all factors as equally important despite dramatic mathematical weight differences in actual algorithms.

    3 Things You Can Do Today

    Ready to optimize based on calculation understanding? Here are three simple steps you can take right now:

    1. Calculate exact utilization per card and overall targeting 65% of your score (payment + utilization) – Log into all credit card accounts documenting: Current balance, credit limit, calculate per-card utilization (balance ÷ limit), calculate overall utilization (total balances ÷ total limits). Identify: Any card over 50% (critical priority represents 30% of entire score calculation), overall above 30% (action needed for optimization). Create targeted reduction plan: Extra payment amounts bringing high cards under 30% then under 10%, specific payoff timeline (utilization improvements reflect within one statement cycle = 30-day results), pay-down scheduling before next statement closing dates (timing for optimal reporting). Example: Currently 3 cards: $3,000/$5,000 (60%), $1,000/$8,000 (12%), $500/$3,000 (17%), overall 28%. Priority: Pay $2,000 on first card bringing to 20%, results in overall 16%—potential 30-40 point increase targeting 30% of score algorithm. Takes 20 minutes creating mathematically-informed optimization plan targeting second-highest weighted factor (30% of calculation) producing rapid measurable results impossible without utilization calculation and threshold understanding.

    2. Audit payment history establishing automatic payments protecting 35% of score calculation – Review all credit accounts (cards, loans, utilities) identifying: Current payment method (manual vs automatic), payment due dates, minimum payment amounts. Calculate risk: Any manual payments represent 35% of score at risk from single missed payment (90-110 point drop potential from highest-weighted factor). Implement automatic minimum payments on ALL accounts: Log into each account, configure automatic minimum payment from checking (takes 5 minutes per account), set up account alerts as backup notification, maintain manual full-payment habit but automatic minimums as failsafe. This protects 35% of score calculation (largest single component) from catastrophic damage costing 100 score points and 18-24 months recovery from single oversight. One-time 30-minute setup protecting highest-weighted factor (35% of calculation) from preventable disaster versus continued manual-only risk leaving largest score component vulnerable to human error inevitable over multi-year timelines. Takes 30 minutes implementing permanent protection of highest-impact calculation factor.

    3. Identify your lowest-impact optimization opportunities and stop wasting effort (credit mix + new credit = only 20% combined) – Review current credit improvement efforts identifying: Activities focused on credit mix (considering loans for “account variety”), new credit concerns (spacing applications though not actually applying), minor factor obsessions (worrying about soft inquiries, checking own credit). Calculate wasted effort percentage: Time spent on 20% of calculation (mix 10% + new credit 10%) versus time on 65% of calculation (payment 35% + utilization 30%). Reallocate effort: 80% effort → payment perfection and utilization optimization (65% of score), 15% effort → history maintenance (15% of score), 5% effort → new credit spacing and natural mix development (20% of score). Stop: Taking loans solely for mix (costs interest for 10% factor benefit), excessive application spacing when not applying anyway (irrelevant without applications), checking credit avoidance (soft inquiries have zero impact). Redirect freed effort: Additional utilization reduction, buffer building for payment security, limit increase requests. Example current allocation: 40% effort worrying about mix/inquiries (20% of calculation), 60% effort on payment/utilization (65% of calculation)—mathematically backwards. Correct allocation: 80% on payment/utilization, 20% on everything else, produces 3-4x faster improvement through effort alignment with algorithm weights. Takes 15 minutes auditing effort allocation realigning focus with calculation mathematics maximizing improvement per hour invested.

    These actions create calculation-informed optimization within 60 minutes—calculated precise utilization targeting 30% of score with measurable improvement timeline, protected 35% of score from catastrophic payment miss through automation, and reallocated effort from 20% calculation factors to 65% calculation factors producing 3x faster improvement—transforming score optimization from scattered unfocused activity into mathematically-strategic targeting of highest-weighted algorithm components producing predictable rapid results.

    Advertisement
    Reserved space for in-content ad

    Quick FAQ

    Why do FICO and VantageScore give me different scores if they use the same data?
    Different proprietary formulas despite similar factors: FICO weights payment history 35%, utilization 30% with specific percentages, VantageScore uses “extremely influential” and “highly influential” categories without exact percentages creating different mathematical relationships. Additionally: Different treatment of specific items—VantageScore 3.0+ ignores paid collections while older FICO models count them, trended data handling varies, account age calculations differ (FICO keeps closed accounts 10 years, VantageScore drops immediately). Result: Same person same data typically 20-40 point difference normal (example: FICO 8: 735, VantageScore 3.0: 715) from calculation methodology differences not data errors. For decisions: FICO dominates lending (90% of lenders) making it primary focus despite VantageScore visibility in free monitoring apps.

    Which factor should I focus on improving first for fastest score increase?
    Depends on current situation but typically utilization (30% weight) offers fastest results: Utilization changes reflect within 30-60 days (one statement cycle), reduction from 50% to 10% can boost score 40-80 points rapidly, directly controllable through payments unlike history length requiring time. Payment history (35% weight) highest impact but preventative not corrective—perfect payments maintain scores but single late creates 12-18 month recovery making it protection focus not improvement lever. Strategy: If high utilization (over 30%), prioritize reduction for fast score boost while maintaining perfect payments preventing damage. If low utilization already, focus entirely on payment protection (automation) and time passage building history. Credit mix and new credit (10% each) lowest priority—minimal impact not worth forced optimization effort better spent on major factors.

    How much does closing a credit card hurt my score?
    Depends on card characteristics and scoring model: Immediate impact through increased utilization (30% factor)—closing $5,000 limit card when have $2,000 other balances increases utilization from 20% to 40% potentially dropping score 30-50 points. History impact varies: FICO continues aging closed accounts 10 years (minimal immediate damage, eventual impact when falls off), VantageScore drops closed accounts immediately (instant average age reduction). Worst case: Closing oldest highest-limit card with perfect history = 50-80 point drop combining utilization increase and history reduction. Best case: Closing newest lowest-limit card = 10-20 point drop minimal impact. Default recommendation: Keep old cards open especially if high limits and long history—annual fee-free cards cost nothing to maintain, put small recurring charge preventing issuer closure, vastly outweighs score damage from closing.

    Does checking my own credit score lower it?
    No—complete myth preventing beneficial monitoring: Checking own credit through official channels (AnnualCreditReport.com, credit card issuer scores, Credit Karma, banking apps) counts as soft inquiry with ZERO score impact per calculation algorithms. Hard inquiries (affecting scores 5-10 points) only occur when LENDERS check credit for APPLICATION decisions—you applying for credit card, mortgage, auto loan. Unlimited self-monitoring encouraged: Fraud detection, error identification, improvement tracking, all beneficial without calculation penalty. Confusion source: People see inquiries on reports and assume all inquiries hurt but reports show both soft (no impact) and hard (small impact) with only hard affecting calculations. Check freely and frequently—transparency into calculation inputs enables optimization impossible when avoided based on false belief creating vulnerability to fraud and errors.

    If I pay off all my credit cards completely will my score go up?
    Usually yes but optimal utilization is 1-10% not 0%: Paying high balances (over 30%) to under 10% produces major score increase (30-60 points typical), paying moderate balances (10-30%) to under 10% produces smaller increase (10-20 points), but paying from low utilization to 0% sometimes slightly decreases score (scoring algorithms may interpret 0% utilization as “not using credit” vs “using responsibly”). Optimal: 1-9% utilization (some small balances) typically scores 5-15 points higher than 0% utilization (no balances) in many FICO versions, though impact modest making it minor optimization not major concern. Strategy: Pay down high utilization aggressively targeting under 10% overall and per-card, don’t obsess about 5-point difference between 0% and 5%, focus on keeping utilization low (under 30% minimum, under 10% optimal) whether 0% or 5% relatively similar for 30% of calculation component.

    Explore More in Money Basics

    Disclosure

    This article provides general educational information about credit score calculation methodologies based on publicly available information from FICO, VantageScore, and credit industry sources. Exact proprietary algorithms are secret, subject to change, and more complex than simplified explanations presented. Factor weights represent published general guidance—actual calculations involve hundreds of variables and non-linear relationships not fully disclosed. Individual score results vary significantly based on complete unique credit profiles. Score improvement timelines and magnitude estimates represent typical scenarios—actual results differ. This is not credit repair services, financial advice, or guarantee of specific score improvements. Scoring model versions vary by lender—mortgage lenders often use older FICO versions (2/4/5) while consumer monitoring shows newer versions (8/9) creating score discrepancies between monitoring and lending decisions. VantageScore adoption growing but FICO remains dominant for lending decisions. Consultation with qualified financial professionals or credit counselors recommended for personalized guidance. Legitimate credit improvement requires time and consistent responsible behavior—beware services promising instant results. Examples use simplified mathematics illustrating concepts—actual algorithms significantly more complex. Advertisements or sponsored content may appear within or alongside this content. All information presented independently for educational purposes only.
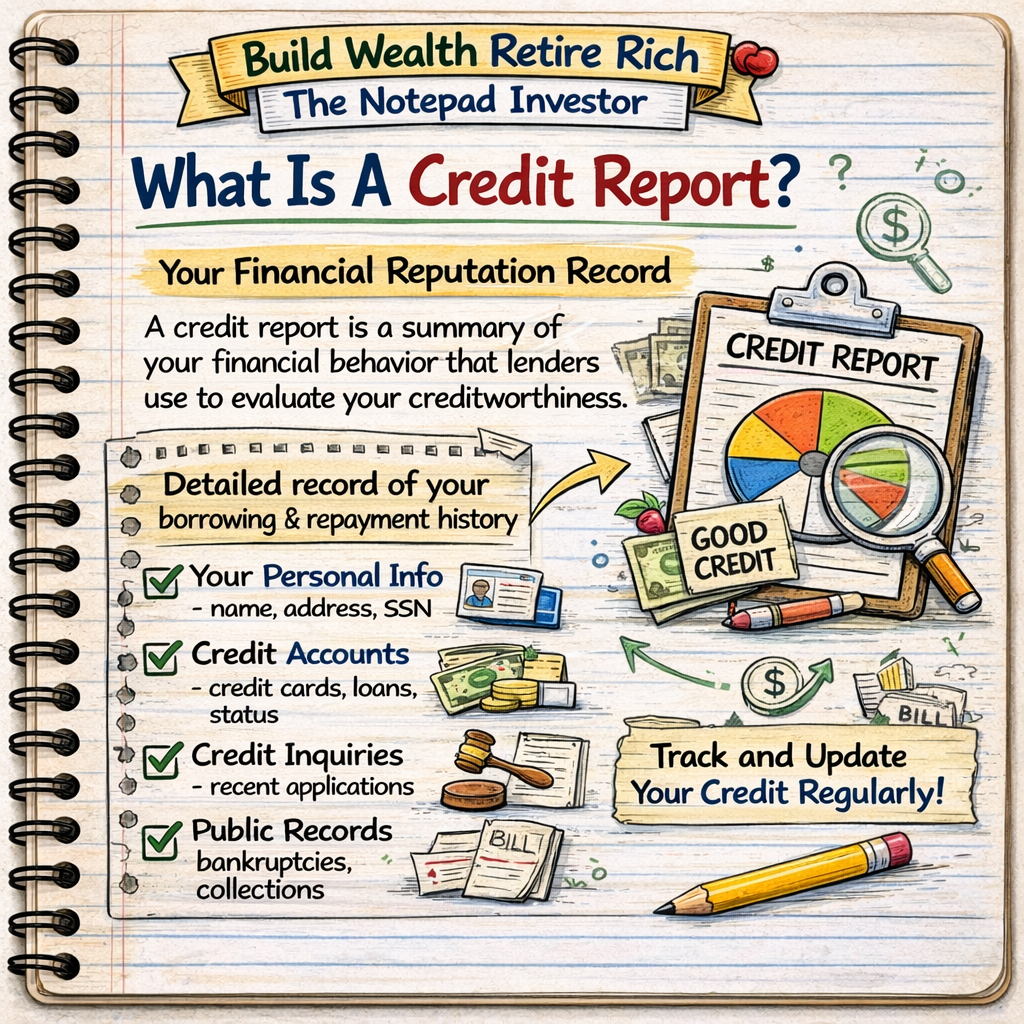
  • 4.3 What Is a Credit Score? What It Means and Why It Matters

    4.3 What Is a Credit Score? What It Means and Why It Matters

    Credit scores are three-digit numerical representations (300-850 scale) of creditworthiness calculated from credit report data using proprietary algorithms—primarily FICO and VantageScore models—summarizing borrowing history, payment behavior, debt levels, and credit usage patterns into single number that lenders use to evaluate loan approval likelihood and interest rate determination. Unlike credit reports containing detailed account-by-account payment histories and personal information, credit scores distill comprehensive credit data into simplified numeric rating enabling rapid lending decisions, with higher scores (740+) indicating lower default risk earning best interest rates and approval odds while lower scores (below 620) signal higher risk resulting in loan denials or substantially elevated borrowing costs potentially totaling hundreds of thousands of dollars over lifetime making credit score optimization among highest-return financial activities requiring only knowledge and discipline not additional money investment.

    Notebook sketch explaining personal finance

    This article is designed for anyone wanting comprehensive credit score understanding, individuals seeking score improvement strategies, or those confused by score variations and factors. You do not need financial expertise or perfect credit to understand credit scores—fundamental concepts accessible to everyone regardless of current score, though requires willingness to examine credit behavior honestly identifying improvement opportunities and implementing systematic changes producing measurable score increases enabling lifetime borrowing cost reductions worth tens to hundreds of thousands of dollars through strategic score optimization.

    Understanding credit scores matters because five-point score differences translate to thousands in interest costs over loan terms, excellent scores (760+) save average $200,000-$400,000 lifetime versus poor scores through lower rates on mortgages and auto loans, and score knowledge enables strategic optimization through understanding precise factors and weights driving score calculations—while informed score managers maintain excellent ratings (740+) accessing lowest-cost borrowing and premium opportunities, optimize behavior around five scoring factors producing maximum score improvement, and avoid common mistakes inadvertently damaging scores creating unnecessary borrowing costs impossible to recover without score understanding enabling targeted strategic improvement.

    Educational disclaimer: This article provides general educational information about credit scores. Scoring models, factors, and calculations are proprietary to credit bureaus and scoring companies (FICO, VantageScore). Individual score results vary based on unique credit profiles. Score improvement timelines and strategies represent general approaches—actual results differ. This is not financial advice or credit repair services. Consult qualified financial professionals for personalized guidance. Legitimate credit improvement requires time and responsible behavior—beware services promising instant score increases.

    Understanding Credit Score Basics

    What Credit Scores Represent

    Core concept:

    • Numerical prediction of default likelihood
    • Higher score = lower statistical risk of not repaying
    • Based on past credit behavior patterns
    • Not measure of financial success or net worth
    • Specific to borrowing history and credit management

    Score range and meanings:

    • 800-850: Exceptional (Top 20% of consumers, best rates guaranteed, premium card offers)
    • 740-799: Very Good (Better than average, excellent rates, high approval likelihood)
    • 670-739: Good (Near/above average, competitive rates, good approval odds)
    • 580-669: Fair (Below average, higher rates, conditional approval, subprime category)
    • 300-579: Poor (High risk, very high rates if approved, often denied)

    Major Scoring Models

    FICO Score (most widely used):

    • Created by Fair Isaac Corporation
    • Used by 90% of lenders for lending decisions
    • Multiple versions (FICO 8, FICO 9, FICO 10, industry-specific variants)
    • Range: 300-850
    • Proprietary algorithm, exact formula secret

    VantageScore (alternative model):

    • Created jointly by three credit bureaus (Equifax, Experian, TransUnion)
    • Growing adoption but less universal than FICO
    • Current version: VantageScore 4.0
    • Range: 300-850 (same as FICO for current versions)
    • Different weighting than FICO but similar factors

    Why you have multiple scores:

    • Three credit bureaus (Equifax, Experian, TransUnion) each maintain separate reports
    • Not all creditors report to all three bureaus
    • Slight data differences between bureaus create score variations
    • Multiple FICO versions (mortgage FICO, auto FICO, bankcard FICO)
    • FICO vs VantageScore using different formulas
    • Typical variation: 20-50 points across all scores normal

    How Scores Are Calculated

    FICO Score factors and weights:

    1. Payment History: 35%

    • On-time vs late payments
    • How late (30, 60, 90+ days)
    • How recent
    • How many accounts with late payments
    • Collections, charge-offs, bankruptcies

    2. Amounts Owed (Credit Utilization): 30%

    • Total debt amount
    • Credit utilization ratio (balances ÷ limits)
    • Number of accounts with balances
    • Proportion of installment loan balances to original amounts

    3. Length of Credit History: 15%

    • Age of oldest account
    • Average age of all accounts
    • How long specific accounts been open
    • How long since accounts used

    4. New Credit: 10%

    • Number of recently opened accounts
    • Number of recent credit inquiries (hard pulls)
    • Time since recent inquiries
    • Time since account openings

    5. Credit Mix: 10%

    • Variety of credit types (credit cards, mortgage, auto loan, installment loans)
    • Number of each type
    • Not essential but slightly beneficial

    What’s NOT in Your Credit Score

    Personal demographic information:

    • Age, race, ethnicity, gender
    • Marital status
    • Religion or political affiliation
    • National origin

    Financial information not credit-related:

    • Income or salary
    • Employment status or history
    • Assets (savings, investments, property)
    • Net worth

    Other exclusions:

    • Checking or savings account balances
    • Debit card usage
    • Utility or rent payments (unless specifically reported or in collections)
    • Child support obligations
    • “Soft” credit inquiries (checking own credit, pre-qualification offers)
    Credit Score Booklet

    Build Your Credit Before You Graduate

    A simple 30-day plan to help college students build credit, avoid costly mistakes, and save thousands.

    Get the Booklet →

    Credit Score Ranges and Impact

    Detailed Score Range Breakdown

    800-850: Exceptional (20% of consumers)

    • Characteristics: Perfect or near-perfect payment history, low utilization (under 10%), long credit history (10+ years average), minimal recent inquiries
    • Approval: Virtually guaranteed for any credit product
    • Rates: Absolute best available, often promotional 0% offers
    • Opportunities: Premium rewards cards, highest credit limits, best terms
    • Mortgage: 6.0% APR typical (varies by market)
    • Auto loan: 4.0-4.5% APR

    740-799: Very Good (25% of consumers)

    • Characteristics: Solid payment history (maybe 1-2 old late payments), moderate utilization (10-30%), established history (5+ years)
    • Approval: High likelihood, rarely denied
    • Rates: Excellent, within 0.25-0.5% of best
    • Opportunities: Good rewards cards, competitive offers
    • Mortgage: 6.25% APR
    • Auto loan: 5.0% APR

    670-739: Good (21% of consumers)

    • Characteristics: Few late payments, moderate utilization (30-50%), average history (3-5 years)
    • Approval: Good odds, some conditional approvals
    • Rates: Competitive but not best, 0.5-1.5% above optimal
    • Opportunities: Standard cards, decent terms
    • Mortgage: 6.75% APR
    • Auto loan: 6.5% APR

    580-669: Fair (18% of consumers)

    • Characteristics: Multiple late payments, high utilization (50-80%), shorter history, collections possible
    • Approval: Conditional, often denied for premium products
    • Rates: Subprime, 3-6% above prime rates
    • Opportunities: Secured cards, subprime auto loans, FHA mortgages possible
    • Mortgage: 7.5-8.0% APR (if approved)
    • Auto loan: 10-15% APR

    300-579: Poor (16% of consumers)

    • Characteristics: Serious delinquencies, collections, charge-offs, bankruptcy, very high utilization or maxed out
    • Approval: Frequently denied, very limited options
    • Rates: Extremely high if approved, often 15-25%+ APR
    • Opportunities: Secured cards only, predatory lending risk
    • Mortgage: 8.5%+ APR or denied
    • Auto loan: 18-24% APR or denied

    Financial Impact Examples

    $300,000 mortgage, 30-year fixed:

    800 score (6.0% APR):

    • Monthly payment: $1,799
    • Total interest: $347,515

    740 score (6.25% APR):

    • Monthly payment: $1,847
    • Total interest: $364,806
    • Extra cost vs 800: $48/month, $17,291 total

    680 score (6.75% APR):

    • Monthly payment: $1,946
    • Total interest: $400,355
    • Extra cost vs 800: $147/month, $52,840 total

    620 score (7.75% APR):

    • Monthly payment: $2,146
    • Total interest: $472,429
    • Extra cost vs 800: $347/month, $124,914 total

    580 score (8.5% APR if approved):

    • Monthly payment: $2,307
    • Total interest: $530,388
    • Extra cost vs 800: $508/month, $182,873 total

    Key insight: 220-point score difference (800 vs 580) costs $182,873 in extra interest on single mortgage

    $25,000 auto loan, 60 months:

    • 800 score (4.5% APR): $466 monthly, $2,935 interest
    • 680 score (7.0% APR): $495 monthly, $4,762 interest
    • 620 score (12% APR): $556 monthly, $8,376 interest
    • Difference 800 vs 620: $90/month, $5,441 total extra

    How to Check Your Credit Score

    Free Score Sources

    Credit card issuers (free FICO scores):

    • Discover: Free FICO Score 8 for everyone (even non-customers)
    • Capital One: Free VantageScore 3.0
    • American Express: Free FICO Score 8 for cardholders
    • Chase: Free VantageScore 3.0 for cardholders
    • Citi: Free FICO Bankcard Score for cardholders
    • Many other card issuers providing free scores

    Credit monitoring services (free with ads/upsells):

    • Credit Karma: Free VantageScore 3.0 (Equifax and TransUnion)
    • Credit Sesame: Free VantageScore
    • Experian app: Free Experian FICO Score 8
    • NerdWallet: Partners with TransUnion

    Official FICO (paid option):

    • MyFICO.com: All scores from all bureaus ($20-60 depending on package)
    • Most comprehensive but costs money
    • Useful when applying for mortgage (see all lender-used scores)

    Understanding Score Variations

    Why your scores differ across sources:

    • Different bureaus: Equifax vs Experian vs TransUnion data differences
    • Different models: FICO vs VantageScore calculate differently
    • Different FICO versions: FICO 8 (most common monitoring) vs FICO 2/4/5 (mortgage lending) vs FICO Auto 8 (auto lending)
    • Update timing: Scores update when creditors report (typically monthly but varies)
    • Snapshot moment: Score reflects credit file at exact checking moment

    Example multi-score reality:

    • Credit Karma VantageScore: 720 (monitoring)
    • Discover FICO 8: 735 (monitoring)
    • Mortgage FICO (2/4/5 average): 715 (lending decision)
    • All from same person, same day—normal variation

    Which score matters most:

    • For monitoring trends: Any free score sufficient
    • For mortgage application: FICO 2, 4, 5 (lenders use middle of three)
    • For auto loan: FICO Auto Score 8 or 9
    • For credit cards: FICO Bankcard Score 8 or 9
    • General rule: Focus on improving all scores through same behaviors

    Credit Reports vs Credit Scores

    Credit reports (free annually):

    • Detailed account-by-account history
    • Personal information
    • Payment history specifics
    • Credit inquiries
    • Public records
    • Free at AnnualCreditReport.com (all three bureaus)
    • Does NOT include credit scores (just raw data)

    Credit scores (free via services):

    • Numerical summary (300-850)
    • Calculated from report data
    • Available through card issuers, monitoring services
    • Updates frequently (often weekly or monthly)

    Recommended monitoring strategy:

    • Check credit reports: Annually from all three bureaus (stagger every 4 months for continuous monitoring)
    • Check credit score: Monthly through free card issuer or service
    • Monitor for: Errors, fraud, score trends
    The Credit Score Advantage for College Students

    Every College Student Needs to Understand Credit Scores

    Your credit score affects your first apartment, car loan, and financial future. This practical booklet gives you a clear 7-chapter roadmap and a powerful 30-day action plan to build credit the right way.

    • Understand how credit scores actually work
    • Check your credit report and fix errors
    • Boost your score with smart strategies
    • Follow a simple 30-day improvement plan
    Get the Booklet →

    Improving Your Credit Score

    Factor 1: Payment History (35%) — Highest Impact

    Optimization strategies:

    Never miss payment deadlines:

    • Set up automatic minimum payments as backup
    • Use calendar reminders 5 days before due dates
    • Enable text/email alerts from creditors
    • Consider automatic full payment if disciplined budgeter

    Late payment impact timeline:

    • 30 days late: Major score drop (60-110 points typical depending on starting score)
    • 60 days late: Larger drop
    • 90+ days late: Severe drop, potential collections
    • Remains on report: 7 years from delinquency date
    • Impact diminishes: Gradually over time but affects score full 7 years

    If you missed payment:

    • Pay immediately (damage control)
    • Call creditor requesting goodwill deletion if first-time offense
    • Set up automatic payments preventing recurrence
    • Understand recovery takes time—patience required

    Factor 2: Credit Utilization (30%) — Fast Impact

    Utilization calculation:

    • Per card: Balance ÷ credit limit = percentage
    • Overall: Total balances ÷ total limits = percentage
    • Both matter for scoring

    Optimal utilization targets:

    • Under 10%: Excellent (maximizes score)
    • Under 30%: Good (acceptable, minimal score impact)
    • 30-50%: Fair (starting to hurt score)
    • 50-75%: Poor (significant score damage)
    • Over 75%: Very poor (major score reduction)
    • Maxed out: Severe damage

    Quick score boost strategies:

    Pay down balances:

    • Target cards over 30% utilization first
    • Even $500 reduction can increase score 10-20 points if near threshold
    • Pay before statement closing date (reported balance matters, not payment due date balance)

    Request credit limit increases:

    • Increases denominator lowering utilization percentage
    • Example: $2,000 balance on $5,000 limit = 40% utilization
    • Limit increased to $8,000: Same $2,000 balance = 25% utilization
    • Request online or phone call typically
    • Minimal impact from soft inquiry if done carefully

    Spread balances across cards:

    • Instead of $3,000 on one $5,000 limit card (60%)
    • Split: $1,500 on each of two cards (30% each)
    • Overall utilization unchanged but per-card improved

    Pay multiple times monthly:

    • Keep reported balance low even if charging heavily
    • Pay after each major purchase before statement close
    • Reported balance stays minimal despite high monthly spending

    Factor 3: Length of History (15%) — Slow Building

    Optimization strategies:

    Keep old accounts open:

    • Closing oldest account reduces average account age
    • Even unused accounts contribute to history length
    • Small annual charge on old cards preventing closure (pay immediately)

    Become authorized user:

    • Added to parent/spouse’s old account
    • Inherit account age and payment history
    • Instant history boost for credit-building
    • Choose account: 5+ years old, perfect payment record, low utilization

    Avoid churning accounts:

    • Opening and closing cards frequently lowers average age
    • Keep cards long-term even after signup bonuses earned

    Factor 4: New Credit (10%) — Application Management

    Hard inquiry impact:

    • Each credit application = hard inquiry
    • Typical impact: 5-10 point temporary decrease
    • Multiple inquiries compound effect
    • Recovery: 3-6 months back to pre-inquiry score
    • Remains on report: 2 years but only affects score first 12 months

    Rate shopping exception:

    • Multiple mortgage/auto loan inquiries within 14-45 days (depending on model) count as single inquiry
    • Allows rate shopping without penalty
    • Does NOT apply to credit cards (each application separate inquiry)

    Optimization strategies:

    • Space credit card applications 3-6 months apart minimum
    • Concentrate mortgage/auto shopping within 2-week window
    • Use pre-qualification (soft pull) before applying when available
    • Avoid unnecessary credit checks (store cards at checkout, etc.)

    Factor 5: Credit Mix (10%) — Minor Factor

    Optimal mix:

    • Revolving credit (credit cards): At least 2-3 cards
    • Installment loans (auto, mortgage, student, personal): At least 1-2
    • Mix demonstrates management of different credit types

    Don’t force it:

    • Only 10% of score—smallest factor
    • Don’t take loan solely for credit mix
    • Natural accumulation over time (mortgage, auto loan eventually)
    • Focus on major factors (payment history, utilization) for biggest impact

    Building Credit from Scratch

    Timeline Expectations

    Credit score appearance:

    • Minimum requirement: 6 months credit history
    • At least one account reported in last 6 months
    • First score typically appears month 6-7

    Score progression with perfect behavior:

    • Month 6: First score 640-680 typical
    • Month 12: 680-720 range with perfect payments
    • Month 24: 720-760 range
    • Month 36-48: 760-800+ range achievable
    • Requires: Perfect payment history, low utilization, no negatives

    Starting Strategies

    Secured credit card (easiest approval):

    • Deposit $200-$500 becoming credit limit
    • Reports to bureaus like regular card
    • Use for small purchases, pay full balance monthly
    • After 6-12 months: Graduate to unsecured card, deposit returned
    • Recommended: Discover Secured, Capital One Secured

    Credit-builder loan:

    • Small loan ($300-1,000) held by lender
    • Make monthly payments for 6-24 months
    • Payments reported to bureaus building history
    • At end: Receive loan amount minus interest
    • Available through credit unions, online lenders

    Authorized user strategy:

    • Added to family member/spouse’s account
    • Immediate history boost (inherits account age and payment record)
    • Choose wisely: Old account (5+ years), perfect history, low utilization
    • Don’t need physical card or access—just authorized user status

    Student credit cards (if applicable):

    • Designed for limited/no credit students
    • Easier approval than regular cards
    • Lower limits initially
    • Require student status verification
    Advertisement
    Reserved space for in-content ad

    Common Credit Score Mistakes

    Mistake 1: Carrying Balances for Score Benefits

    The myth: “I need to carry a balance and pay interest to build credit”

    The reality: Using cards and paying in full monthly builds credit identically to carrying balances but costs zero interest

    The cost: Carrying $2,000 at 18% APR costs $360 annually in unnecessary interest

    Mistake 2: Closing Old Credit Cards

    The damage:

    • Reduces total available credit (increases utilization)
    • Eventually reduces average account age (when closed account ages off report)
    • Loses payment history contribution

    Example impact:

    • Close card: $5,000 limit, 8 years old
    • Utilization jumps from 20% to 35% (if had balances on other cards)
    • Average age drops from 6 years to 4 years
    • Score drop: 20-40 points typical

    Mistake 3: Applying for Multiple Cards Quickly

    The problem:

    • Each application = hard inquiry
    • 5 applications in 2 months = 5 inquiries
    • Cumulative score impact: 25-50 points temporary drop
    • Plus signals credit desperation to lenders

    Mistake 4: Ignoring Credit Reports

    Consequences:

    • Identity theft undetected
    • Reporting errors damaging score unnecessarily
    • Collections on accounts you don’t recognize
    • Missed opportunities to dispute inaccuracies

    Solution: Check reports annually minimum, monitor scores monthly

    Mistake 5: Maxing Out Credit Cards

    Impact:

    • 100% utilization = severe score damage
    • Example: 740 score drops to 640 when cards maxed (100-point drop)
    • Signals financial distress to lenders
    • Recovery: Pay down to under 30% for score rebound

    Why Credit Scores Matter

    Without understanding credit scores, borrowers pay hundreds of thousands unnecessarily in lifetime interest through suboptimal scores easily improvable with knowledge, miss opportunities through preventable score damage from common mistakes, and lack framework for strategic score optimization maximizing borrowing power—while score-savvy individuals maintain excellent ratings (740+) through understanding five weighted factors, optimize behavior around scoring model mechanics producing maximum results, and save $200,000-$400,000 lifetime through lowest-cost borrowing access impossible without score knowledge enabling targeted strategic improvement beyond vague “be responsible” advice lacking actionable specificity.

    Understanding credit scores enables individuals to:

    • Save hundreds of thousands in lifetime interest through score optimization
    • Target improvement efforts on highest-impact factors (payment history 35%, utilization 30%)
    • Avoid common mistakes inadvertently damaging scores
    • Build credit strategically from zero reaching excellent range in 2-3 years
    • Monitor scores and reports preventing identity theft and errors
    • Understand score variations across models and bureaus avoiding confusion
    • Access premium credit opportunities requiring excellent scores

    Credit score knowledge transforms scoring from mysterious black box into understood system enabling strategic optimization through targeted behaviors producing measurable score increases and lifetime borrowing cost reductions worth tens to hundreds of thousands of dollars.

    Common Misunderstandings

    Many people assume credit scores primarily reflect income and wealth. In reality, scores measure only credit management behavior—billionaires can have poor scores from missed payments while modest earners maintain 800+ scores through perfect payment records, proving scores independent of financial success measuring solely borrowing history and responsible credit use not overall financial standing creating possible disconnect where high earners have poor credit and careful moderate earners have excellent credit.

    Another common misconception is checking your own credit hurts your score. In practice, checking your own credit through official channels (AnnualCreditReport.com, card issuer score monitoring, Credit Karma, etc.) counts as soft inquiry with zero score impact—only lender credit checks when applying for new credit (hard inquiries) affect scores modestly and temporarily, proving self-monitoring encouraged and harmless enabling fraud detection and improvement tracking impossible when avoided based on false belief creating vulnerability.

    Some believe paying off collections or charge-offs immediately removes them from credit reports. However, negative items remain on reports for 7 years from original delinquency date regardless of subsequent payment—paying updates status to “paid collection” but doesn’t delete, recent scoring models (FICO 9, VantageScore 3/4) ignore paid collections though older models still count them, proving payment helpful for credit access but doesn’t erase history requiring realistic expectations about timeline for score recovery after negative items versus assumption that payment creates instant restoration.

    How Credit Score Understanding Fits Into Financial Success

    Credit score optimization provides highest-return financial activity requiring only knowledge and discipline not additional money, enables access to lowest-cost borrowing saving hundreds of thousands lifetime through rate differences, and creates opportunities in premium credit products and favorable terms—making score knowledge essential component of comprehensive financial success impossible without understanding scoring mechanics, five weighted factors, and strategic optimization behaviors producing measurable score increases enabling wealth building through reduced borrowing costs and enhanced credit access impossible for those treating scores as mysterious unchangeable numbers beyond control.

    For example, two siblings both age 25 starting first jobs earning $45,000. Sibling A treats credit casually—pays bills usually on time but sometimes late (2-3 late payments annually), keeps credit cards at 60-70% utilization, applies for new cards impulsively (5-6 applications yearly), closes old cards when done using rewards. After 10 years age 35: Credit score 620 (fair category) from accumulated late payments, high utilization, short average history from closed accounts. Buys $250,000 home requiring mortgage, approved at 7.5% rate (subprime) due to 620 score, monthly payment $1,748, total interest over 30 years $379,280. Buys $25,000 vehicle, approved at 12% rate, monthly payment $556, total interest $8,360. Over next 30 years: Paid $387,640 total interest across mortgage and multiple vehicles ($379,280 mortgage + three $8,360 vehicles). Sibling B learns credit score system age 25 understanding five factors and weights—maintains perfect payment record through automatic payments, keeps utilization under 10% through payoff discipline and limit increases, spaces card applications 6+ months, never closes old accounts building history. After 10 years age 35: Credit score 780 (very good verging excellent) from perfect behavior. Buys identical $250,000 home, approved at 6.0% rate (prime) due to 780 score, monthly payment $1,499, total interest $289,595. Buys identical $25,000 vehicle, approved at 4.5% rate, monthly payment $466, total interest $2,935. Over next 30 years: Paid $198,400 total interest ($289,595 mortgage + three $2,935 vehicles). Difference between siblings: $189,240 less interest paid ($387,640 vs $198,400) from credit score differential on identical purchases at identical incomes—pure savings from score knowledge and optimization requiring no additional money just strategic behavior understanding. Sibling A’s 620 score cost nearly $200,000 lifetime versus Sibling B’s 780 score from identical starting point and earning capacity—difference entirely from score knowledge enabling strategic behavior optimization versus casual credit management creating massive unnecessary costs.

    Credit score understanding separates strategic optimizers saving hundreds of thousands through highest-return financial knowledge from casual credit users paying enormous unnecessary premiums through lack of scoring system understanding creating preventable lifetime costs from behaviors easily corrected with knowledge.

    Recent Updates and Trends

    In recent years, alternative data scoring has expanded—FICO 10 and UltraFICO considering rent, utility, and banking data enabling “credit invisible” consumers to establish scores, though adoption uneven across lenders creating mixed accessibility benefits requiring time for widespread implementation.

    Free credit score access has democratized—most major credit card issuers now providing free FICO scores to cardholders versus historical paid-only access, dramatically improving score monitoring accessibility enabling better optimization though creating confusion about score variations and which scores matter for specific applications.

    Paid collections treatment has improved—newer models (FICO 9, VantageScore 3.0/4.0) ignoring paid collection accounts versus older models counting them, benefiting consumers who pay off collections though many lenders still use older models particularly for mortgages creating inconsistent benefits across credit types.

    Credit score education has increased—financial literacy initiatives, free resources, and consumer awareness growing though substantial gaps remain with many people still believing myths (carrying balances helps scores, checking own credit hurts, etc.) requiring continued education efforts.

    Fundamental credit score principles remain timeless: payment history matters most (35% of score) making on-time payments essential, credit utilization heavily impacts scores (30%) making balance management critical, strategic behavior around five weighted factors produces measurable score improvements, and score optimization saves hundreds of thousands lifetime through reduced borrowing costs—regardless of alternative data evolution, free score proliferation, paid collection treatment improvements, or education expansion, understanding FICO/VantageScore mechanics, maintaining excellent scores through strategic behavior, and avoiding common mistakes produces superior lifetime financial outcomes through lowest-cost credit access impossible without score knowledge and optimization.

    3 Things You Can Do Today

    Ready to optimize your credit score? Here are three simple steps you can take right now:

    1. Check your credit utilization and create immediate reduction plan if over 30% – Log into all credit card accounts noting: Current balance, credit limit, utilization (balance ÷ limit). Calculate overall: Total balances ÷ total limits. Identify: Any card over 50% (critical priority), overall utilization over 30% (action needed). Create payoff plan: Extra $200-500 monthly toward highest utilization cards, target bringing all under 30% then under 10% for maximum score benefit. Quick boost strategy: Pay down before statement closing date (reported balance matters not payment due date balance), request limit increases on cards below 30% (increases denominator), spread balances across cards if concentrated. Example: Currently $6,000 total balance on $10,000 limits (60% utilization damaging score), pay down $3,000 bringing to 30% = potential 40-60 point score increase within one reporting cycle. Takes 20 minutes creating concrete reduction plan with measurable score impact versus continuing high utilization indefinitely.

    2. Set up automatic minimum payments on all credit accounts as safety net – Log into every credit account (cards, loans, etc.), navigate to automatic payment settings, configure automatic minimum payment from checking account. This guarantees: Never miss payment (35% of score protected), late payment prevention (60-110 point drops avoided), payment history perfection over time. Still manually pay full balance monthly but automatic minimum as backup prevents disaster if forget, traveling, or disrupted routine. Example setup: Credit card minimum $35, auto loan $425, student loan $180—all automatic from checking. One-time 30-minute setup preventing potential payment misses costing hundreds of score points and thousands in interest through default rates if payment 60+ days late. Single missed payment can drop 740 score to 640 taking 12-18 months recovery—automatic minimums prevent catastrophe for zero ongoing effort after initial setup.

    3. Calculate your specific lifetime borrowing cost difference between current score and 760+ target – Note current credit score (from card issuer, Credit Karma, etc.), identify score category and typical rates: 800+ (6.0% mortgage, 4.5% auto), 740-799 (6.25% mortgage, 5.0% auto), 670-739 (6.75% mortgage, 6.5% auto), 620-669 (7.5% mortgage, 12% auto), below 620 (8.5%+ mortgage, 18% auto if approved). Use online mortgage calculator: $300,000 home 30-year at your rate vs 760+ rate noting monthly and total interest difference. Repeat for auto: $25,000 vehicle 60-month. Example current 660 score (6.75% mortgage): Total interest $400,355, versus 760+ score (6.0%): Total interest $347,515, difference $52,840 single mortgage. Add multiple vehicles lifetime: $15,000-25,000 additional. Total your opportunity: Often $100,000-200,000 lifetime difference between current and optimal score. Write target: “Improve from 660 to 760+ saving $150,000 lifetime borrowing costs.” Creates compelling motivation with concrete financial benefit versus abstract “better score” goal. Takes 15 minutes quantifying personal opportunity making invisible costs visible and actionable driving committed score improvement impossible without calculated personal impact awareness.

    These actions create credit score optimization foundation within 60 minutes—identified and planned utilization reduction producing immediate score boost, implemented automatic payment safety net preventing catastrophic score damage, and calculated personal lifetime savings opportunity from score improvement creating powerful motivation—transforming scores from mysterious numbers into understood optimizable system producing measurable financial benefits through strategic behavior changes.

    Advertisement
    Reserved space for in-content ad

    Quick FAQ

    How long does it take to build a credit score from zero?
    Minimum timeline: 6 months for first score appearance (requires at least 6 months credit history with one account reported). Typical progression with perfect behavior: Month 6-7 first score 640-680, month 12 reach 680-720 range, month 24 reach 720-760 range, month 36-48 reach 760-800+ potential. Faster strategies: Become authorized user on old account (inherits history immediately boosting initial score), secured credit card plus credit builder loan simultaneously (multiple account types), perfect payment record with sub-10% utilization throughout. Realistic expectation: Reach “good” credit (670+) in 12-18 months, “very good” (740+) in 24-36 months from complete zero with consistent responsible behavior. Cannot rush legitimately—time required for history building though strategic authorized user status can accelerate initial scoring.

    Will closing a credit card hurt my score?
    Usually yes through two mechanisms: (1) Immediate utilization increase—closing $5,000 limit card when have $2,000 balances elsewhere changes overall utilization from 20% to 40% potentially (example: $2,000 total balance ÷ $10,000 total limits = 20%, close card reducing limits to $5,000 = $2,000 ÷ $5,000 = 40%), (2) Eventual average age reduction—closed account continues reporting 10 years then falls off reducing average account age. Impact varies: Closing newest card minimal damage, closing oldest card with $10,000 limit and 15-year history = 30-60 point score drop typical. Exceptions where closing acceptable: High annual fee card not worth keeping ($450+ fee, minimal rewards value), cleaning up after identity theft, consolidating accounts for simplification when have many cards with long histories making one closure minimal percentage impact. General rule: Keep old cards open even if unused, put small recurring charge annually preventing issuer closure.

    How much does a single late payment hurt credit score?
    Depends on starting score and severity: 30 days late with 780 score: 90-110 point drop typical (780 → 670-690), 30 days late with 680 score: 60-80 point drop (680 → 600-620), 60 days late: Larger drops, 90+ days or collections: Severe damage potentially 150+ points. Recovery timeline: 3 months significant recovery if perfect behavior resumed, 9-12 months mostly recovered, 18-24 months fully recovered approaching pre-late score, remains on report 7 years but impact diminishes over time. Single late payment with otherwise perfect history recovers faster than multiple lates or late payments plus other negatives. Prevention worth extraordinary effort—one missed $35 minimum payment can cost 100 score points taking year recovering versus 5-minute automatic payment setup preventing disaster entirely.

    Should I pay off collections or leave them unpaid?
    Pay them with realistic expectations: Paying changes status from “unpaid collection” to “paid collection” but doesn’t remove from report (remains 7 years from original delinquency), newer scoring models (FICO 9, VantageScore 3.0/4.0) ignore paid collections benefiting score, older models (FICO 8 and earlier still used by many mortgage lenders) count paid collections same as unpaid, paying prevents lawsuit and wage garnishment, improves credit applications even if score impact minimal (lenders see responsible resolution). Strategy: Negotiate pay-for-delete (creditor agrees to remove from report if paid) before paying though success rates low, if can’t get deletion pay anyway preventing legal action and satisfying debt ethically, document everything in writing, expect modest score improvement (10-30 points typical) not dramatic change, focus forward on building positive history outweighing old negatives over time. Don’t avoid paying hoping collections disappear sooner—7-year clock starts from original delinquency not payment date.

    Why are my credit scores different across websites and apps?
    Normal variation from: (1) Different scoring models—FICO vs VantageScore calculate differently (30-50 point variation normal), (2) Different FICO versions—FICO 8 (monitoring) vs FICO 2/4/5 (mortgage) vs FICO Auto 8 (vehicle loans) each weighted slightly differently, (3) Different credit bureaus—Equifax vs Experian vs TransUnion have slightly different data (not all creditors report to all three), (4) Different update timing—scores reflect data at specific moment, creditors report different dates creating snapshot differences. Example reality: Credit Karma VantageScore 3.0: 720, Discover FICO 8: 735, Experian app FICO 8: 728, mortgage lender FICO (2/4/5 average): 715—all same person same week, normal variation. Don’t obsess over which is “real”—all reflect credit standing, use any for monitoring trends, understand mortgage lenders use FICO 2/4/5 (oldest versions) while most monitoring shows FICO 8 (newer), focus on behaviors improving all scores (payment history, utilization) rather than optimizing specific model.

    Explore More in Money Basics

    Disclosure

    This article is provided for educational purposes only and does not constitute financial advice, credit counseling, or guarantee of specific score improvements. Credit scoring models (FICO, VantageScore) are proprietary—exact formulas secret and subject to change. Score factors and weights represent general published information—individual score calculations vary based on complete credit profiles. Score improvement timelines represent typical scenarios with perfect behavior—actual results vary significantly based on starting point, negative items present, and consistency of positive behavior. Interest rate examples represent recent market ranges—actual rates vary by lender, market conditions, and individual qualifications. Score ranges and approval odds are generalizations—lenders have individual underwriting criteria beyond scores. Free credit score sources may show different scores than lenders use for decisions—monitoring scores useful for trends not precise lending decision prediction. Credit repair services claiming instant score increases often fraudulent—legitimate improvement requires time and responsible behavior. Authorized user strategy effectiveness varies—some lenders discount authorized user accounts. Individual circumstances, credit histories, and appropriate strategies vary requiring personalized assessment. This article does not address all credit score factors, calculations, or implications. Consult qualified financial professionals or credit counselors for personalized guidance. Beware credit repair scams promising guaranteed results. Advertisements or sponsored content may appear within or alongside this content. All information presented independently for educational purposes only.
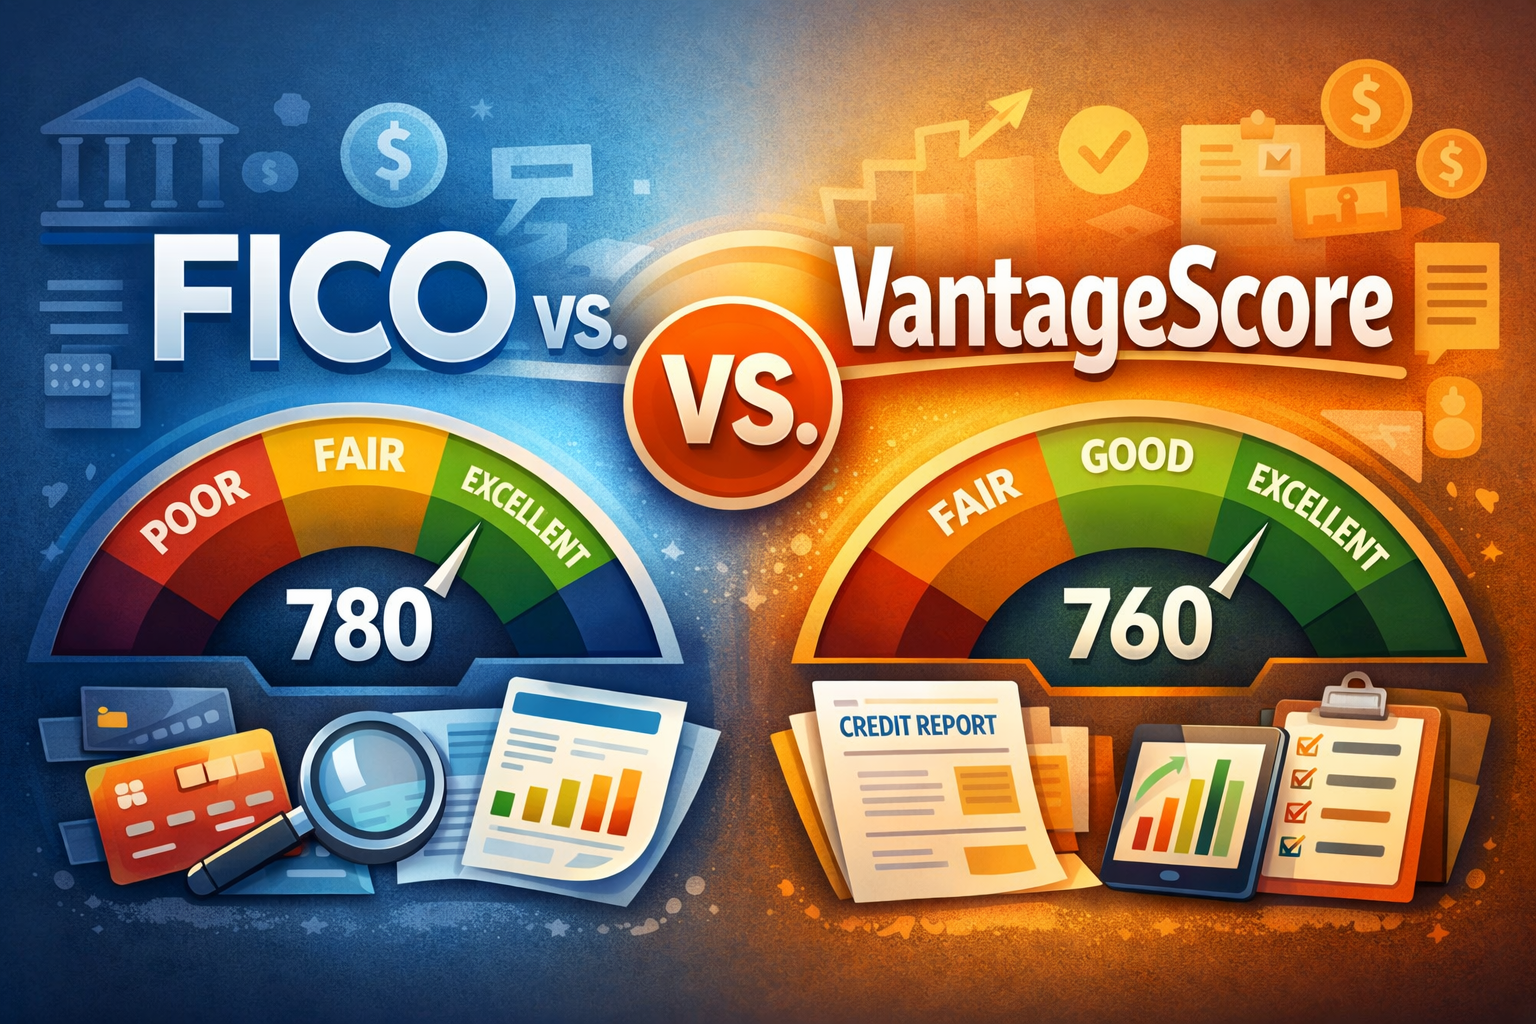
  • 4.2 Why Credit Matters: How It Affects Loans, Jobs, and Your Financial Life

    4.2 Why Credit Matters: How It Affects Loans, Jobs, and Your Financial Life

    Credit matters because modern financial life fundamentally requires credit access for major purchases like homes and vehicles, employment and housing opportunities increasingly depend on credit standing, and strategic credit use provides substantial financial advantages through lower borrowing costs, valuable rewards, superior fraud protection, and emergency flexibility impossible to replicate through cash-only approaches—while excellent credit scores save tens to hundreds of thousands of dollars in lifetime interest costs, poor or absent credit creates significant barriers to housing, employment, and financial opportunities, and understanding credit transforms it from mysterious threat into powerful tool enabling wealth building and financial flexibility when used strategically rather than avoided through fear or misused through ignorance creating destructive debt patterns.

    Notebook sketch explaining personal finance

    This article is designed for anyone questioning whether credit matters, individuals considering cash-only approaches, or those wanting comprehensive understanding of credit’s role in financial success. You do not need financial expertise or current credit to understand why credit matters—fundamental principles accessible to everyone regardless of current situation, though requires openness to reconsidering assumptions about debt and credit that may prevent optimal financial outcomes despite well-intentioned beliefs about responsibility and risk avoidance.

    Understanding why credit matters enables recognition that credit literacy represents essential modern financial skill not optional luxury, strategic credit use accelerates wealth building through leverage and optimization impossible through exclusive cash use regardless of income level, and credit system participation when done responsibly provides competitive advantages in housing, employment, and financial flexibility creating opportunities unavailable to credit-avoiders despite equal or superior cash resources—making credit understanding and strategic usage fundamental components of comprehensive financial success impossible to achieve fully without credit system participation and optimization in modern economy requiring credit for full opportunity access.

    Educational disclaimer: This article provides general educational information about credit’s role in personal finance. Individual circumstances, credit needs, appropriate usage, and risk tolerance vary significantly. Credit carries risks including debt accumulation and financial damage from mismanagement. This is not financial advice or recommendation of specific credit usage. Consult qualified financial professionals for personalized guidance matching individual situations and goals.

    Credit Enables Major Life Purchases

    Homeownership Requires Credit

    Reality of home buying:

    • Median home price: $350,000-$450,000 (varies by location)
    • 20% down payment: $70,000-$90,000
    • Remaining 80%: Requires mortgage ($280,000-$360,000)
    • Saving full purchase price in cash: 20-40+ years for most people

    Credit requirements for mortgages:

    • Minimum credit score: 620 for conventional loans (580 for FHA)
    • Credit history: Minimum 2 years established credit
    • Payment history: No recent late payments or defaults
    • Debt-to-income ratio: Total debt payments under 43% of income typically

    Even with large down payment, no credit = no mortgage:

    • Example: $100,000 saved for down payment on $350,000 home
    • Sufficient for 29% down (well above 20% standard)
    • But zero credit history = mortgage denial
    • “Credit invisible” status prevents approval despite substantial assets
    • Forced to continue renting or delay homeownership years building credit

    Alternative scenario with credit:

    • Same $100,000 down payment plus established credit history
    • Approved for $250,000 mortgage at 6.5% (30 years)
    • Monthly payment: $1,580 (principal and interest)
    • Builds equity immediately versus rent building landlord’s equity
    • After 15 years: $150,000+ equity from payments plus appreciation

    Wealth-building impact:

    • Homeowner: $350,000 asset, $150,000+ equity after 15 years
    • Renter (no credit access): $0 equity, $285,000 paid in rent ($1,580 × 180 months)
    • Difference: $150,000+ wealth gap from credit access enabling homeownership

    Reliable Transportation and Credit

    Vehicle necessity for most Americans:

    • 87% of workers commute by personal vehicle (limited public transit most areas)
    • Reliable transportation essential for employment access
    • New vehicle average: $48,000
    • Quality used vehicle: $20,000-$30,000

    Cash-only vehicle purchase challenges:

    • Saving $25,000 cash: 3-5 years for most people
    • Meanwhile: Driving unreliable $3,000-$5,000 vehicle
    • Repair costs: $2,000-$4,000 annually on aging vehicles
    • Breakdown risk: Employment jeopardy from unreliable transportation
    • Safety concerns: Older vehicles lack modern safety features

    Credit-enabled vehicle purchase:

    • $5,000 down payment + $20,000 auto loan
    • 5% APR, 60 months (good credit rate)
    • Monthly payment: $377
    • Total cost: $22,620 ($20,000 principal + $2,620 interest)
    • Immediate reliable transportation enabling employment stability
    • Lower repair costs: $500-$1,000 annually on reliable vehicle
    • Safety: Modern vehicle with current safety technology

    Comparison over 5 years:

    • Cash-only approach: $5,000 unreliable car + $15,000 repairs = $20,000 spent, unreliable vehicle at end
    • Credit approach: $5,000 down + $22,620 financed = $27,620 spent, owned reliable vehicle worth $12,000 at end
    • Net difference: $7,620 more spent but received reliable transportation, employment stability, safety
    • Often worth premium for security and opportunity enablement

    Education and Career Investment

    Higher education costs:

    • 4-year public university: $40,000-$100,000 total
    • 4-year private university: $150,000-$300,000
    • Graduate/professional programs: $50,000-$200,000+

    Return on education investment:

    • Bachelor’s degree holders earn $1 million+ more lifetime versus high school only
    • Professional degrees (law, medicine, MBA): $2-4 million additional lifetime earnings
    • Career opportunities and advancement dependent on credentials

    Student loans enabling investment:

    • Federal student loans: 4-7% interest rates
    • Deferred repayment until after graduation
    • Income-driven repayment options
    • Investment in earning capacity versus consumption

    Example productive debt:

    • $60,000 student loans for engineering degree
    • Starting salary: $75,000 (versus $35,000 without degree)
    • Extra earnings year 1: $40,000
    • Loan paid off in 3-4 years from differential earnings
    • Remaining 35+ career years: $1.5 million+ additional earnings
    • ROI: 25:1 or higher on education investment
    Something went wrong. Please try again.
    Your subscription has been successful.

    Build Wealth. Retire Rich.

    Get simple, powerful strategies to grow your money and secure your future.

    By subscribing, you agree to receive emails. View our Privacy Policy.

    Credit Scores Impact Borrowing Costs

    Massive Lifetime Interest Differences

    Mortgage cost comparison by credit score:

    Example: $350,000 mortgage, 30-year fixed

    Excellent credit (760+ score): 6.0% APR

    • Monthly payment: $2,098
    • Total paid over 30 years: $755,505
    • Total interest: $405,505

    Good credit (680 score): 6.75% APR

    • Monthly payment: $2,270
    • Total paid over 30 years: $817,276
    • Total interest: $467,276
    • Extra cost vs excellent: $172/month, $61,771 total

    Fair credit (620 score): 7.75% APR

    • Monthly payment: $2,502
    • Total paid over 30 years: $900,720
    • Total interest: $550,720
    • Extra cost vs excellent: $404/month, $145,215 total

    Poor credit (580 score): 8.5% APR (if approved)

    • Monthly payment: $2,691
    • Total paid over 30 years: $968,760
    • Total interest: $618,760
    • Extra cost vs excellent: $593/month, $213,255 total

    Key insight: Over $200,000 difference between excellent and poor credit on single mortgage

    Auto Loan Cost Variations

    Example: $30,000 vehicle, 60-month loan

    Excellent credit (720+): 4.5% APR

    • Monthly payment: $559
    • Total paid: $33,540
    • Total interest: $3,540

    Good credit (660-719): 7.0% APR

    • Monthly payment: $594
    • Total paid: $35,640
    • Total interest: $5,640
    • Extra cost: $35/month, $2,100 total

    Fair credit (620-659): 10.5% APR

    • Monthly payment: $642
    • Total paid: $38,520
    • Total interest: $8,520
    • Extra cost: $83/month, $4,980 total

    Poor credit (below 620): 15%+ APR or denial

    • Monthly payment: $713+
    • Total paid: $42,780+
    • Total interest: $12,780+
    • Extra cost: $154/month, $9,240 total

    Lifetime Borrowing Cost Impact

    Typical person’s lifetime major borrowing:

    • 2-3 mortgages over lifetime
    • 5-8 vehicle loans over working years
    • Student loans (if applicable)
    • Occasional personal loans or HELOCs

    Cumulative credit score impact example:

    Person with excellent credit (760+) lifetime:

    • 3 mortgages at best rates: Interest saved $150,000 vs fair credit
    • 6 auto loans at best rates: Interest saved $25,000 vs fair credit
    • Credit cards paid strategically: $0 interest, +$15,000 rewards
    • Total advantage: $190,000+ over lifetime

    Person with fair/poor credit (620-660) lifetime:

    • Paid $150,000 extra mortgage interest
    • Paid $25,000 extra auto interest
    • Credit card debt interest: $30,000 over years
    • Total extra cost: $205,000 lifetime

    Difference: Nearly $400,000 lifetime from credit score management alone

    Something went wrong. Please try again.
    Your subscription has been successful.

    Build Wealth. Retire Rich.

    Get simple, powerful strategies to grow your money and secure your future.

    By subscribing, you agree to receive emails. View our Privacy Policy.

    Credit Affects Housing and Employment

    Rental Applications Require Credit Checks

    Standard rental application process:

    • Credit check required by most landlords
    • Minimum credit score requirements (typically 620-650)
    • Recent evictions or collections scrutinized
    • Payment history review for responsibility indicators

    No credit vs bad credit in rental market:

    • No credit (“credit invisible”): Often treated like bad credit
    • Landlord perspective: No payment history = unknown risk
    • Common requirements for weak/no credit applicants:
    • Higher security deposit (2-3 months vs standard 1 month)
    • Co-signer requirement (parent, guarantor)
    • Prepaid rent (first, last, security = 3+ months upfront)
    • Premium rental rates or limited property access

    Example rental barrier:

    • Desired apartment: $1,500/month
    • Applicant with good credit: $1,500 first month + $1,500 security = $3,000 move-in
    • Applicant with no/poor credit: $1,500 first + $1,500 last + $3,000 security + $500 application fee = $6,500 move-in
    • $3,500 penalty for weak credit status

    Employment Background Checks

    Credit checks in hiring process:

    • 47% of employers conduct credit checks (especially financial services, government, management)
    • Legal in most states for certain positions
    • Modified credit report (no credit score, just history)
    • Looking for: Responsibility indicators, financial stress signs, fraud concerns

    Positions commonly requiring credit checks:

    • Financial services (banks, investment firms, insurance)
    • Executive and management positions
    • Government jobs requiring security clearances
    • Positions with financial responsibility or access
    • Jobs handling cash or valuable inventory

    Red flags employers identify:

    • Recent bankruptcies (financial stress indicator)
    • Collections and charge-offs (payment avoidance)
    • Excessive debt relative to income (vulnerability to bribery/theft)
    • Pattern of late payments (general irresponsibility)

    Career opportunity impact:

    • Denied employment despite qualifications due to credit issues
    • Security clearance denial preventing government/defense work
    • Promotions blocked due to credit concerns in financial responsibility roles
    • Career advancement limited by credit standing in certain industries

    Insurance Premiums and Credit-Based Scoring

    Credit-based insurance scores:

    • Auto and homeowner insurance companies use credit-based scores
    • Correlation between credit scores and insurance claims (statistical)
    • Legal in most states for rate-setting

    Premium differences by credit tier:

    Auto insurance example (full coverage):

    • Excellent credit: $1,200 annually
    • Good credit: $1,500 annually ($300 more)
    • Fair credit: $1,900 annually ($700 more)
    • Poor credit: $2,400+ annually ($1,200+ more)

    Lifetime auto insurance cost difference:

    • 40 years driving with excellent vs poor credit
    • $1,200 annually vs $2,400 = $1,200 annual difference
    • Over 40 years: $48,000 extra paid for identical coverage
    Advertisement
    Reserved space for in-content ad

    Strategic Credit Use Provides Benefits

    Credit Card Rewards and Cash Back

    Typical rewards rates:

    • Basic cash back cards: 1-1.5% on all purchases
    • Category bonus cards: 2-5% on specific categories (groceries, gas, dining)
    • Premium travel cards: 2-3% effective value with optimization

    Annual rewards calculation:

    • $30,000 annual spending on 2% cash back card
    • Rewards earned: $600 annually
    • Over 30 years: $18,000 cash back (assuming paid in full monthly, zero interest)

    Cash-only alternative:

    • Same $30,000 annual spending in cash/debit
    • Rewards earned: $0
    • Difference: $18,000 forfeited over 30 years from payment method choice alone

    Important caveat:

    • Rewards only valuable if carrying zero balance (paying in full monthly)
    • $600 rewards negated by just 2 months carrying $5,000 balance at 18% APR ($150 interest)
    • Disciplined use required for rewards to provide actual benefit

    Superior Fraud Protection

    Credit card fraud liability:

    • Federal law: Maximum $50 liability (most issuers waive entirely)
    • Fraudulent charges: Dispute process, temporary credit while investigating
    • Zero liability policies: Most major cards offer complete protection
    • Your actual funds never touched (credit line used, not bank account)

    Debit card fraud liability:

    • Report within 2 days: $50 maximum liability
    • Report within 60 days: $500 maximum liability
    • Report after 60 days: Unlimited liability (total loss possible)
    • Funds immediately removed from bank account
    • Investigation takes days/weeks while you lack access to money

    Real-world fraud scenario:

    • $3,000 fraudulent charges
    • Credit card: Dispute, temporary credit, keep using card, resolved in 7-10 days, $0 liability
    • Debit card: $3,000 withdrawn from checking, bills potentially bounce, overdraft fees, 2-4 weeks investigation, stress and inconvenience

    Emergency Financial Flexibility

    Credit as emergency backup:

    • Unexpected major expense: $5,000 car repair, medical bill, home repair
    • Emergency fund depleted or insufficient
    • Credit card provides immediate access to needed funds
    • Repay over time without crisis decision-making under pressure

    Example emergency scenario:

    • $4,000 emergency home repair (roof leak)
    • Emergency fund: $2,000 available (recently used for medical)
    • Without credit: High-interest payday loan, skip repair risking $20,000 damage, borrow from family
    • With credit: Charge $4,000, repay $400/month for 11 months, total cost $4,200 (5% effective interest)
    • Repair completed immediately preventing larger damage

    Purchase Protection and Extended Warranties

    Credit card purchase protections:

    • Extended warranty: Additional 1-2 years beyond manufacturer warranty
    • Purchase protection: Damage/theft coverage 90-120 days
    • Return protection: Refund if merchant won’t accept return
    • Price protection: Refund if price drops within 60-90 days

    Value example:

    • $1,500 laptop purchased with credit card
    • Manufacturer warranty: 1 year
    • Card extended warranty: Additional 1 year (free)
    • Laptop fails month 15 (after manufacturer warranty expires)
    • Credit card warranty covers $800 repair cost
    • Cash/debit purchase: Out-of-pocket $800 or replace laptop

    Why Credit Matters

    Without credit access and credit literacy, individuals face substantial barriers to homeownership preventing wealth building through equity accumulation, pay dramatically higher interest costs across lifetime borrowing totaling hundreds of thousands of dollars unnecessarily, and miss opportunities in housing, employment, and financial benefits—while credit-savvy individuals with excellent scores access lowest-cost borrowing enabling wealth building, strategically use credit for rewards and protections adding thousands in value, and maintain flexibility and opportunities unavailable to those avoiding or mismanaging credit creating competitive disadvantages in modern financial system requiring credit participation for optimal outcomes regardless of cash resources.

    Understanding why credit matters enables individuals to:

    • Access homeownership building substantial wealth through equity impossible through renting
    • Secure employment in positions requiring credit checks or security clearances
    • Save hundreds of thousands in lifetime interest through excellent credit scores
    • Earn thousands in rewards through strategic credit card use
    • Maintain superior fraud protection versus cash/debit transactions
    • Access emergency financial flexibility when needed
    • Optimize insurance premiums through credit-based scoring benefits

    Credit matters because modern financial success requires credit system participation and optimization—strategic informed credit use creates competitive advantages while avoidance or misuse creates substantial disadvantages in wealth building, opportunity access, and lifetime costs impossible to overcome through cash resources alone.

    Advertisement
    Reserved space for in-content ad

    Common Misunderstandings

    Many people assume avoiding all credit represents most responsible financial approach. In reality, strategic credit use enables wealth building through homeownership impossible for cash-only individuals despite larger savings, provides employment access in credit-check positions, and captures rewards and protections worth thousands annually, proving credit avoidance creates disadvantages not financial virtue when executed through fear rather than informed strategic decision-making understanding both benefits and appropriate usage boundaries.

    Another common misconception is that only wealthy people benefit from good credit. In practice, excellent credit matters most for middle and lower-income individuals who cannot absorb extra interest costs—$200,000 extra mortgage interest from poor credit represents years of additional work for median earners while barely noticeable to wealthy, proving credit optimization provides greatest relative benefit to those with limited resources making every dollar of interest savings meaningful versus dismissing credit importance as luxury concern for high earners only.

    Some believe building credit requires carrying credit card debt and paying interest. However, credit scores improve maximally through active credit card use paid in full monthly combining payment history, low utilization, and account longevity without interest costs—carrying balances wastes money with zero additional score benefit, proving optimal credit building costs nothing beyond strategic account usage discipline versus myth that credit building requires “paying to play” through unnecessary interest charges benefiting only card issuers not consumers.

    How Credit Understanding Fits Into Financial Success

    Credit understanding provides foundation for optimizing modern financial infrastructure accessing lowest-cost borrowing and maximizing benefits, enables major wealth-building opportunities through homeownership and education impossible through cash-only approaches regardless of savings discipline, and creates competitive advantages in employment, housing, and insurance markets—making credit literacy essential component of comprehensive financial success impossible without understanding credit’s role, maintaining excellent credit standing, and using credit strategically for benefits while avoiding destructive patterns creating long-term damage through misuse or complete avoidance based on misunderstanding.

    For example, two high school friends both disciplined savers entering workforce age 22. Friend A believes “all debt is bad” avoiding credit entirely using cash and debit exclusively. Saves diligently, accumulates $50,000 by age 30 through 15% savings rate. Applies for mortgage buying $300,000 home—denied due to no credit history despite substantial down payment and stable income. Continues renting at $1,800 monthly. Age 35: Still renting, saved $80,000 but cannot access homeownership. Applies for better job in financial services—credit check reveals no history, passed over for candidate with established credit (position requires financial responsibility). Auto insurance: $2,000 annually due to no credit-based insurance score. Never earned credit card rewards, misses employer 401(k) match first 2 years due to budgeting without emergency credit backup forcing cash reserve maintenance. After 20 years age 42: Renting, paid $432,000 in rent over 20 years, owns aging vehicle, $200,000 saved (impressive discipline) but no home equity, missed employment advancement, paid $40,000 auto insurance vs $24,000 with good credit, zero rewards earned, total disadvantage $448,000 ($432,000 rent versus $150,000 mortgage principal paid building equity, $16,000 extra insurance, $12,000 missed rewards = $460,000 vs $12,000 actual mortgage interest paid)—net $448,000 disadvantage from credit avoidance despite superior savings discipline. Friend B understands credit importance, opens credit card age 22 using for routine spending paying full monthly building history. Maintains 760+ score. Age 30: Approved for mortgage 6% rate buying $300,000 home with $50,000 down (identical savings as Friend A). Builds equity immediately. Better job application age 35: Credit check shows excellent standing, hired for position advancing career. Auto insurance: $1,200 annually (versus Friend A’s $2,000) due to excellent credit-based scoring. Earns $600 annually credit card rewards ($12,000 over 20 years). Emergency flexibility: Uses credit strategically avoiding payday loans during unexpected expenses. After 20 years age 42: Owns home worth $450,000 with $200,000 equity (appreciation and principal payments), paid $72,000 mortgage interest total (versus $432,000 rent), saved $16,000 insurance costs, earned $12,000 rewards, advanced career enabled by credit check approval—net position $150,000 home equity wealth built through mortgage access enabled by credit versus rental equivalence, plus $28,000 additional benefits creating $178,000 total advantage over Friend A from credit understanding and strategic use. Identical starting circumstances, identical savings discipline, opposite financial outcomes—Friend B’s credit literacy created $400,000+ wealth difference through enabling homeownership, reducing costs, and accessing opportunities impossible for Friend A despite arguably more “responsible” cash-only philosophy creating paradoxical disadvantage.

    Credit understanding separates those optimizing modern financial opportunities from those disadvantaged by credit system avoidance or misuse—strategic informed credit participation enables wealth building and opportunity access creating competitive advantages impossible to replicate through cash-only approaches regardless of superior savings discipline when credit literacy absent.

    Recent Updates and Trends

    In recent years, alternative data credit scoring has expanded—FICO 10 and UltraFICO considering rent payments, utility bills, and banking history enabling those without traditional credit to establish scores, reducing “credit invisible” population though adoption uneven across lenders creating mixed accessibility benefits.

    Credit card rewards competition has intensified—cards offering 2-5% cash back, valuable travel points, and enhanced benefits making strategic credit use more rewarding than historical minimal rewards environment, though simultaneously tempting overspending through rewards psychology potentially negating benefits when balances carried creating behavioral challenge.

    Credit score access has democratized—free FICO scores through credit card issuers, Credit Karma, and other services versus historical paid-only access enabling better monitoring and optimization, though score proliferation creating confusion about which score matters for specific applications requiring education distinguishing monitoring scores from lending decision scores.

    Credit freeze implementation has become instant and free—federal law requiring zero-cost freezes and real-time online implementation enabling better identity theft protection, though requiring proactive management when applying for legitimate credit creating friction potentially causing missed opportunities when forgotten requiring balance between security and accessibility.

    Fundamental credit importance remains timeless: modern economy requires credit access for major purchases and opportunities, excellent credit scores save enormous amounts in lifetime borrowing costs justifying optimization efforts, strategic credit use provides benefits impossible through cash-only approaches, and credit literacy represents essential financial skill not optional luxury—regardless of alternative scoring evolution, rewards intensification, free score accessibility, or security measure improvements, understanding credit’s role, maintaining excellent standing, and using strategically while avoiding destructive patterns produces superior lifetime financial outcomes through enabling wealth building and accessing opportunities impossible without credit system participation and optimization.

    3 Things You Can Do Today

    Ready to optimize credit’s role in your financial success? Here are three simple steps you can take right now:

    1. Calculate your lifetime borrowing cost difference between current and excellent credit scores – Check your current credit score (free through credit card issuer, Credit Karma, or similar). Note current score and category: Below 620 poor, 620-679 fair, 680-739 good, 740+ excellent. Visit mortgage and auto loan calculator websites. Input typical borrowing: $300,000 mortgage 30-year, $25,000 auto loan 60-month. Calculate at your current score’s rate versus excellent credit rate (760+). Example current 660 score: Mortgage 7% ($1,995 monthly) vs 760+ score 6% ($1,799 monthly) = $196 monthly difference × 360 months = $70,560 lifetime savings potential. Auto 8% ($507 monthly) vs 760+ 4.5% ($466 monthly) = $41 monthly × multiple vehicles lifetime = $15,000+ savings. Total your lifetime opportunity: Often $100,000-300,000 difference between current and optimal credit standing. Write this number down making invisible cost visible and actionable. Takes 15 minutes creating compelling motivation for credit improvement versus abstract “good credit matters” understanding without personal quantification.

    2. If avoiding credit, open first credit card building history OR if established credit, optimize current usage – Credit avoiders: Visit secured credit card comparison sites (Discover, Capital One secured cards common). Apply for secured card requiring $200-500 deposit becoming credit limit. Use for small recurring payment (streaming service, phone bill), set up automatic full payment monthly from checking. This builds credit history with zero risk of debt accumulation through automatic full payment. Within 6-12 months: First credit score appears, graduate to unsecured card, begin building credit enabling future opportunities. Established credit users: Review current credit card usage ensuring pay full balance monthly (avoiding interest), utilization under 30% ideally under 10% (current balance ÷ total limits), on-time payments 100% (set up automatic minimum payments as backup), maintain old accounts even if unused (length of history). If carrying balances: Create aggressive payoff plan calculating interest costs and commitment to elimination. Takes 20-30 minutes beginning credit journey or optimizing existing credit creating foundation for lifetime benefits impossible without credit establishment and proper management.

    3. Audit one major area where credit standing costs you money and create improvement plan – Identify highest-cost credit impact: Renting requiring extra deposit due to credit? Calculate extra cost ($1,500 additional security typical). Auto insurance premium elevated? Get quote at excellent credit scenario versus current ($600-1,200 annual difference common). Current loan high interest? Calculate refinance savings potential with improved credit. Employment opportunities limited? Identify positions requiring credit checks in desired field. Choose one area, quantify current cost, research required score improvement (fair to good = 60 points typical, good to excellent = 40 points). Create 6-12 month improvement plan: Pay down credit card balances lowering utilization (fastest impact), dispute any credit report errors (immediate score increase when corrected), maintain perfect payment record (set up automatic payments), become authorized user on family member’s old account if possible (instant history boost). Set target: “Improve score from 650 to 720 in 9 months enabling auto insurance reduction saving $800 annually.” Track monthly progress toward specific financially meaningful outcome versus abstract “better credit” goal lacking concrete benefit motivation. Takes 20 minutes creating targeted improvement plan producing measurable financial benefits impossible without specific goal and action plan beyond general credit awareness.

    These actions create credit optimization foundation within 60 minutes—calculated personal lifetime borrowing cost difference making abstract credit importance concrete and quantified, initiated credit building or optimized existing credit creating foundation for benefits, and targeted one specific high-cost area creating focused improvement plan producing measurable financial gains—transforming credit from ignored or feared topic into actively managed component of financial success producing substantial lifetime benefits through strategic understanding and optimization impossible without deliberate attention and action.

    Advertisement
    Reserved space for in-content ad

    Quick FAQ

    Can I be financially successful avoiding all credit and debt?
    Technically possible but substantially more difficult and limiting: Can save cash for vehicles and rent versus own (foregoing home equity wealth building), maintain large cash emergency reserves versus credit flexibility (opportunity cost of uninvested funds), pay higher insurance premiums (no credit-based scoring benefit), face housing barriers (higher deposits, limited options), miss employment opportunities (positions requiring credit checks), forfeit rewards worth thousands (2% on $30,000 annual spending = $600 yearly), and accept higher lifetime costs overall. Reality: Cash-only succeeds for disciplined savers but requires substantially more saved money achieving same outcomes, limits major wealth building through homeownership, and pays premium through missed benefits and higher costs totaling often $500,000+ lifetime versus strategic credit use. Recommended: Understand credit as tool enabling opportunities when used responsibly not moral failing requiring avoidance.

    Does excellent credit really save hundreds of thousands of dollars lifetime?
    Yes—calculation: Mortgage on $350,000 home: Excellent credit 6% = $755,505 total paid over 30 years, Poor credit 8.5% = $968,760 total paid, difference $213,255. Multiple vehicles lifetime: 6 vehicles excellent credit 4.5% vs poor credit 12% = $20,000+ difference. Credit card rewards: $600 annually over 40 years = $24,000 (versus $0 cash-only). Lower insurance premiums: $600 annually over 40 years = $24,000. Conservative total: $280,000+ lifetime benefit from excellent versus poor credit on identical purchases and circumstances. High borrowing individuals (expensive homes, locations) see differences exceeding $500,000 lifetime. Single mortgage alone often creates $100,000-200,000 difference proving credit score optimization among highest-ROI financial activities possible requiring only knowledge and discipline not additional money.

    If I have no credit history, how quickly can I establish good credit?
    Timeline from zero credit: Month 0: Open secured credit card or become authorized user on family member’s account. Month 6: First credit score appears (requires 6 months history minimum), typically 640-680 range with perfect payment record. Month 12: Score reaches 680-720 range (good category) with continued perfect payments and low utilization. Month 24-36: Score reaches 740+ (excellent) with established history and continued responsible use. Accelerators: Authorized user on old account (inherits account age immediately), multiple account types (credit card + installment loan creates credit mix), credit builder loan (small loan specifically for building credit), consistent on-time payments (most important factor 35% of score). Strategy: Start with one secured card, perfect payments for 6 months establishing initial score, then add accounts strategically building history reaching good credit within 12-18 months and excellent within 24-36 months from complete zero.

    What if I believe all debt is morally wrong or religiously prohibited?
    Respectfully, distinguish between: (1) High-interest consumer debt (credit cards, payday loans) used for lifestyle consumption—arguably problematic financially and potentially morally, (2) Strategic low-interest productive debt (mortgages, education, business) enabling wealth building and opportunity—different category economically and ethically. Additionally: Can build credit without ever carrying debt—use credit card for small purchases, pay full balance immediately, never pay interest but establish payment history and credit scores enabling future opportunities. Can maintain excellent credit without borrowing—authorized user status, credit builder accounts, strategic card use with zero debt all build scores without personal borrowing or interest payment. Even strict debt-avoidance philosophies can accommodate credit score building enabling housing access, employment opportunities, and cost savings without violating principles through distinguishing between credit history (capability to borrow) and actual debt (money owed). Recommended: Consult religious/philosophical advisors about distinction between credit capacity and debt carrying if concerned.

    How much does credit really matter compared to income and savings?
    All three essential with different roles: Income = ability to save and cover expenses (foundation). Savings = emergency protection and financial security (stability). Credit = access to opportunities and cost optimization (leverage and efficiency). Comparison scenarios: High income + no credit = Limited homeownership access despite ability to afford, higher insurance costs, missed rewards, employment barriers in credit-check positions. High savings + no credit = Cannot leverage savings into homeownership despite $100,000 saved, forced to rent or delay major purchases. Good credit + low income = Access to opportunities (approved for mortgage despite modest income when within debt-to-income limits), lower costs on necessary borrowing, employment access. Optimal: All three working together—sufficient income enabling saving, adequate savings providing security, excellent credit enabling opportunity access and cost optimization. Credit doesn’t replace income/savings but multiplies their effectiveness through enabling leverage and reducing costs impossible without credit participation regardless of cash resources.

    Explore More in Money Basics

    Disclosure

    This article is provided for educational purposes only and does not constitute financial advice or recommendation of specific credit usage strategies. Credit usage carries risks including debt accumulation and financial damage from mismanagement. Individual circumstances, credit needs, appropriate usage, and risk tolerance vary significantly. Interest rate examples represent recent typical ranges—actual rates vary by lender, borrower qualifications, and market conditions. Credit score impact calculations based on general industry data—individual results vary. Lifetime cost comparisons use simplified scenarios for illustration—actual outcomes depend on numerous factors including specific borrowing amounts, terms, rates, and repayment patterns. Employment and rental credit check policies vary by employer and landlord. Insurance premium impacts from credit-based scoring vary by state regulations and insurer practices. Credit card rewards value depends on responsible usage including paying balances in full monthly—carrying balances negates rewards through interest costs. Alternative data credit scoring adoption uneven across lenders. This article does not address all credit implications, uses, or considerations. Consult qualified financial professionals for personalized guidance matching individual situations and goals. Advertisements or sponsored content may appear within or alongside this content. All information presented independently for educational purposes only.

    The Credit Score Advantage for College Students

    Every College Student Needs to Understand Credit Scores

    Your credit score affects your first apartment, car loan, and financial future. This practical booklet gives you a clear 7-chapter roadmap and a powerful 30-day action plan to build credit the right way.

    • Understand how credit scores actually work
    • Check your credit report and fix errors
    • Boost your score with smart strategies
    • Follow a simple 30-day improvement plan
    Get the Booklet →
  • 4.1 What Is Credit? A Beginner’s Guide to How It Really Works

    4.1 What Is Credit? A Beginner’s Guide to How It Really Works

    Credit is the ability to borrow money or access goods and services with the understanding that payment will be made later—a contractual promise to repay borrowed funds plus any agreed-upon interest or fees within specified timeframe creating financial flexibility enabling major purchases, emergency coverage, and strategic cash flow management when used responsibly. Unlike cash transactions requiring immediate full payment or debit transactions drawing directly from existing bank balances, credit creates temporary debt obligation allowing consumption before payment through lender trust in borrower’s future repayment based on creditworthiness assessment, making credit simultaneously powerful financial tool enabling opportunities impossible through cash-only approaches and potentially dangerous trap creating unsustainable debt when misused or misunderstood resulting in long-term financial damage from compounding interest and damaged credit standing affecting future borrowing costs and approval possibilities.

    Notebook sketch explaining personal finance

    This article is designed for anyone new to credit concepts, individuals wanting comprehensive credit understanding, or those seeking to use credit effectively while avoiding common pitfalls. You do not need financial expertise or prior credit experience to understand credit fundamentals—basic concepts accessible to everyone regardless of background, though requires careful attention to terms, costs, and responsible usage principles differentiating wealth-building credit use from debt-trap patterns creating long-term financial harm through misunderstanding or mismanagement of borrowing obligations.

    Understanding what credit is matters because modern financial life frequently requires credit access for housing, transportation, and emergency flexibility, misunderstanding credit costs thousands annually through unnecessary interest and fees while damaging future borrowing ability, and appropriate credit use enables wealth building through strategic leverage and credit score optimization—while informed credit users maintain low-cost access to necessary credit enabling major purchases and financial flexibility, optimize credit scores reducing borrowing costs substantially, and avoid debt traps destroying wealth, creating financial success impossible without credit literacy in modern economy requiring credit understanding for full participation and opportunity access.

    Educational disclaimer: This article provides general educational information about credit concepts. Individual credit situations, terms, costs, and appropriate usage vary significantly. Credit products carry risks including debt accumulation and credit score damage from mismanagement. This is not financial advice or recommendation of credit usage. Consult qualified financial professionals for personalized guidance. Credit agreements legally binding—understand terms before acceptance.

    Understanding Credit Fundamentals

    Core Definition

    Credit in simple terms:

    • Permission to use someone else’s money now
    • Promise to pay it back later
    • Usually with interest (cost of borrowing)
    • Based on lender’s trust in your ability and willingness to repay

    The credit transaction:

    • Borrower (you): Receives money, goods, or services immediately
    • Lender (creditor): Provides money, goods, or services with expectation of future repayment
    • Credit agreement: Legal contract specifying terms (amount, interest rate, repayment schedule)
    • Interest: Cost paid for privilege of borrowing (lender’s profit)

    How Credit Works

    Example credit transaction:

    • You want $1,000 item but only have $100 cash
    • Credit card company lends you $1,000
    • You receive item immediately
    • You owe credit card company $1,000 plus interest
    • You repay over time through monthly payments
    • Total paid might be $1,150 ($1,000 principal + $150 interest over repayment period)

    Key components of any credit:

    • Principal: Original amount borrowed ($1,000 example)
    • Interest rate: Annual percentage cost of borrowing (18% APR typical credit card)
    • Term: Time period for repayment (varies by credit type)
    • Monthly payment: Required periodic payment amount
    • Total cost: Principal + all interest and fees

    Credit vs Cash vs Debit

    Cash transaction:

    • Immediate payment from existing funds
    • No debt created
    • No interest charged
    • Transaction complete immediately
    • Example: Pay $1,000 cash for item, own it outright, done

    Debit card transaction:

    • Immediate payment from bank account
    • Your existing money, just electronic
    • No debt created
    • No interest charged
    • Example: Pay with debit, $1,000 deducted from checking immediately

    Credit transaction:

    • Delayed payment using borrowed money
    • Debt created (owe lender)
    • Interest charged (unless paid immediately)
    • Transaction creates obligation requiring future payment
    • Example: Charge $1,000 on credit card, pay back $1,150 over 6 months

    Why Credit Exists

    Benefits for borrowers:

    • Make purchases before having full amount saved
    • Handle emergencies without sufficient cash reserves
    • Smooth income fluctuations or timing mismatches
    • Build credit history enabling future borrowing
    • Leverage for wealth building (strategic debt use)

    Benefits for lenders:

    • Earn interest income on money lent
    • Profitable business model (banking, credit cards)
    • Risk-adjusted returns through interest rates and fees

    Economic benefits broadly:

    • Enables major purchases (homes, education) impossible through cash-only
    • Facilitates commerce and economic activity
    • Allows productive investment in assets that appreciate
    • Creates economic growth through consumption and investment
    Advertisement

    Financial Wellness Planner

    Types of Credit

    Revolving Credit

    Definition: Credit line you can use repeatedly up to limit, paying down and reusing

    Credit cards (most common revolving credit):

    • Credit limit: Maximum you can borrow (example: $5,000 limit)
    • Use repeatedly: Charge purchases, pay down balance, charge again
    • Minimum payment required monthly
    • Interest charged on unpaid balance (typically 15-25% APR)
    • Available credit changes based on current balance

    Example revolving credit usage:

    • Credit limit: $5,000
    • Month 1: Charge $1,000, pay $500, balance $500, available credit $4,500
    • Month 2: Charge $2,000, pay $1,500, balance $1,000, available credit $4,000
    • Revolves continuously based on usage and payments

    Other revolving credit examples:

    • Home equity line of credit (HELOC)
    • Personal line of credit
    • Business line of credit

    Installment Credit

    Definition: Fixed loan amount repaid in regular installments over set term

    Characteristics:

    • Borrow specific amount once (example: $20,000 auto loan)
    • Fixed monthly payment
    • Fixed term (36 months, 60 months, 30 years for mortgages)
    • Balance decreases with each payment until zero
    • Cannot reborrow after paying down (closed-end credit)

    Common installment credit types:

    Auto loans:

    • Amount: $15,000-$40,000 typical
    • Term: 36-72 months usually
    • Rate: 4-10% APR depending on credit
    • Example: $25,000 car, 60 months, 6% = $483 monthly payment

    Mortgages:

    • Amount: $150,000-$500,000+ typical
    • Term: 15 or 30 years standard
    • Rate: 5-8% depending on credit and market
    • Example: $300,000 home, 30 years, 6.5% = $1,896 monthly

    Student loans:

    • Amount: Varies by education cost
    • Term: 10-25 years typical
    • Rate: 4-8% federal, 7-14% private

    Personal loans:

    • Amount: $1,000-$50,000 typical
    • Term: 12-60 months
    • Rate: 6-36% depending on credit

    Open Credit

    Definition: Balance must be paid in full each period

    Examples:

    • Charge cards (American Express traditional cards): Full balance due monthly, no revolving
    • Utility bills: Borrow service for month, pay in full when bill arrives
    • Cell phone service: Use first, pay bill in full monthly

    Characteristics:

    • Short-term credit only (typically 30 days)
    • No option to carry balance (or limited)
    • No interest charged if paid by due date
    • Late fees if not paid in full

    Secured vs Unsecured Credit

    Secured credit (backed by collateral):

    • Asset pledged guaranteeing repayment
    • Lender can seize collateral if default
    • Lower interest rates (less lender risk)
    • Examples: Mortgages (house collateral), auto loans (vehicle collateral), secured credit cards (cash deposit collateral)

    Unsecured credit (no collateral):

    • Based solely on creditworthiness and promise to repay
    • No specific asset securing loan
    • Higher interest rates (greater lender risk)
    • Examples: Most credit cards, personal loans, student loans

    How Credit Costs Money

    Interest Rates and APR

    Annual Percentage Rate (APR):

    • Yearly cost of borrowing expressed as percentage
    • Includes interest rate plus some fees
    • Standard comparison metric across credit products

    How interest accumulates:

    • Credit cards: Daily compounding typically
    • APR ÷ 365 = daily rate
    • Applied to average daily balance
    • Compounds (interest on interest) if not paid

    Example: Credit card interest calculation

    • Balance: $2,000
    • APR: 18%
    • Daily rate: 18% ÷ 365 = 0.0493% daily
    • Daily interest: $2,000 × 0.000493 = $0.99 per day
    • Monthly interest: ~$30 if balance maintained
    • Pay $50 monthly: $30 interest, $20 principal reduction
    • Time to pay off $2,000 paying $50/month: 62 months (over 5 years!)
    • Total paid: $3,100 ($2,000 principal + $1,100 interest)

    Fees and Charges

    Common credit-related fees:

    Credit card fees:

    • Annual fee: $0-$550+ (premium cards)
    • Late payment fee: $25-$40
    • Over-limit fee: $25-$35 (less common now)
    • Balance transfer fee: 3-5% of amount transferred
    • Cash advance fee: 3-5% plus immediate interest
    • Foreign transaction fee: 1-3% of purchase amount

    Loan fees:

    • Origination fee: 1-8% of loan amount
    • Application fee: $25-$100
    • Prepayment penalty: Variable (some loans charge for early payoff)

    Mortgage fees (one-time):

    • Appraisal: $300-$600
    • Title insurance: $500-$1,500
    • Origination: 0.5-1% of loan amount
    • Total closing costs: 2-5% of home price

    The True Cost of Credit

    Example comparing cash vs credit purchase:

    Scenario: $3,000 purchase

    Option A: Pay cash

    • Total cost: $3,000
    • Ownership: Immediate, debt-free

    Option B: Credit card, minimum payments, 18% APR

    • Monthly payment: $75 (2.5% minimum)
    • Time to pay off: 72 months (6 years)
    • Total interest paid: $2,441
    • Total cost: $5,441 (81% more than cash!)

    Option C: Credit card, but aggressive payoff

    • Monthly payment: $300
    • Time to pay off: 11 months
    • Total interest paid: $276
    • Total cost: $3,276 (9% more than cash)

    Key insight: Repayment speed dramatically affects total cost

    Something went wrong. Please try again.
    Your subscription has been successful.

    Build Wealth. Retire Rich.

    Get simple, powerful strategies to grow your money and secure your future.

    By subscribing, you agree to receive emails. View our Privacy Policy.

    Creditworthiness and Credit Decisions

    How Lenders Evaluate Borrowers

    The Five Cs of Credit:

    1. Character (credit history):

    • Past repayment behavior
    • Credit score (300-850 scale)
    • Payment history on previous debts
    • Bankruptcies, collections, late payments

    2. Capacity (ability to repay):

    • Income level and stability
    • Employment history
    • Debt-to-income ratio (total debt payments ÷ income)
    • Other financial obligations

    3. Capital (financial resources):

    • Savings and assets
    • Down payment amount
    • Net worth
    • Reserve funds

    4. Collateral (secured credit only):

    • Value of asset securing loan
    • Loan-to-value ratio
    • Quality and liquidity of collateral

    5. Conditions (economic factors):

    • Purpose of loan
    • Economic environment
    • Industry stability

    Credit Scores

    Definition: Numerical representation of creditworthiness (300-850 scale)

    Score ranges and meanings:

    • 800-850: Exceptional (best rates, highest approval odds)
    • 740-799: Very good (excellent rates, high approval)
    • 670-739: Good (favorable rates, good approval)
    • 580-669: Fair (higher rates, conditional approval)
    • 300-579: Poor (very high rates or denied)

    Impact on borrowing costs:

    Example: $300,000 mortgage, 30 years

    • 760+ score: 6.0% rate → $1,799 monthly, $647,514 total paid
    • 680 score: 6.5% rate → $1,896 monthly, $682,632 total paid
    • 620 score: 7.5% rate → $2,098 monthly, $755,279 total paid
    • Difference 760 vs 620: $299/month, $107,765 over life of loan

    Credit score factors (FICO model):

    • Payment history: 35% (on-time vs late payments)
    • Amounts owed: 30% (utilization, total debt)
    • Length of credit history: 15% (age of accounts)
    • New credit: 10% (recent applications, new accounts)
    • Credit mix: 10% (variety of credit types)

    Credit Reports

    Definition: Detailed history of credit usage and payment behavior

    Information in credit reports:

    • Personal information (name, address, SSN)
    • Credit accounts (cards, loans, mortgages)
    • Payment history (on-time, late, missed)
    • Credit inquiries (who checked your credit)
    • Public records (bankruptcies, liens, judgments)
    • Collections (accounts sent to collections)

    Three major credit bureaus:

    • Equifax
    • Experian
    • TransUnion

    Access to credit reports:

    • Free annual report from each bureau at AnnualCreditReport.com
    • Review for errors and accuracy
    • Monitor for identity theft signs

    Why Understanding Credit Matters

    Without credit understanding, people pay thousands unnecessarily through high-interest debt and poor credit decisions, damaged credit scores create years of elevated borrowing costs affecting major purchases like homes and vehicles, and lack of credit literacy prevents strategic credit use for wealth building and financial flexibility—while credit-literate individuals maintain excellent scores enabling lowest-cost borrowing, use credit strategically for benefits and flexibility without accumulating destructive debt, and optimize credit profiles accessing financial opportunities impossible for those lacking credit knowledge or avoiding credit entirely through misconception that all debt harmful regardless of type, terms, or strategic application enabling wealth building.

    Understanding what credit is enables individuals to:

    • Make informed decisions about when and how to use credit appropriately
    • Understand true costs of borrowing avoiding debt traps
    • Build and maintain excellent credit scores reducing lifetime borrowing costs
    • Distinguish between productive and destructive debt usage
    • Access credit when needed for emergencies or opportunities
    • Negotiate better terms through credit knowledge and strong creditworthiness
    • Avoid common credit mistakes damaging financial health long-term

    Credit knowledge transforms borrowing from mysterious potentially dangerous activity into understood financial tool enabling strategic use supporting financial goals while avoiding pitfalls destroying wealth through misunderstanding or mismanagement.

    Advertisement
    Reserved space for in-content ad

    Common Misunderstandings

    Many people assume all credit and debt inherently bad requiring complete avoidance. In reality, strategic credit use enables major purchases impossible through cash-only approaches (homes, education, reliable transportation), excellent credit provides financial flexibility for emergencies and opportunities, and maintaining no credit history creates “credit invisible” status preventing approval even when financially qualified, proving appropriate credit use essential component of modern financial success not moral failing or guaranteed path to financial destruction when understood and managed responsibly versus avoided entirely through misconception.

    Another common misconception is that carrying credit card balance helps credit scores. In practice, credit scores improve through on-time payments and low utilization regardless of whether balance paid in full monthly—carrying balances costs substantial interest ($1,000 annually on $5,000 average balance at 20% APR) with zero credit score benefit, proving “pay in full monthly” superior to “carry small balance” myth wasting money unnecessarily based on misunderstanding of credit score factors prioritizing payment history and utilization percentage not whether interest paid.

    Some believe checking credit score damages credit. However, checking your own credit (soft inquiry) never affects score—only lender credit checks when applying for new credit (hard inquiries) impact scores modestly and temporarily, proving monitoring your own credit encouraged and harmless enabling early error detection and fraud awareness impossible when avoiding credit monitoring based on false belief that checking harms scores creating uninformed vulnerability to identity theft and reporting errors.

    How Credit Fits Into Financial Success

    Credit provides essential financial infrastructure enabling major purchases and emergency flexibility, strategic credit use accelerates wealth building through leverage (appreciating assets like homes) and optimization (rewards, 0% promotional financing), and excellent credit scores reduce lifetime borrowing costs by tens to hundreds of thousands of dollars through lower interest rates—making credit literacy fundamental component of complete financial success impossible without understanding credit systems, maintaining strong credit standing, and using credit strategically for benefits while avoiding destructive debt patterns creating long-term financial damage through misuse or misunderstanding.

    For example, two individuals both age 25 starting careers earning $50,000. Person A avoids all credit based on “debt is bad” philosophy using cash/debit exclusively. Cannot establish credit history, denied apartment due to no credit (cash deposit required), eventually needs car but can’t get loan (no credit history)—pays $8,000 cash for older unreliable vehicle. Wants to buy home age 35 but denied mortgage despite 10 years stable employment and $40,000 saved down payment—no credit history makes them “credit invisible” and higher risk requiring either denied or extremely high rates. After 20 years: Renting due to mortgage denial, owns aging vehicle paid cash, no credit card rewards accumulated, limited financial flexibility, ironically paying higher lifetime costs through rent premiums and inability to access advantageous homeownership despite cash-only “responsible” approach. Person B understands credit from start, uses strategically. Opens credit card age 25, uses for routine spending paying full balance monthly building history and earning 2% cash back. Maintains 750+ credit score through responsible use. Age 28: Approved for auto loan 4% rate buying $22,000 reliable vehicle. Age 30: Approved for mortgage 6% rate buying $250,000 home. Over 15 years: Earned $6,000+ credit card rewards, saved $15,000+ in interest through excellent credit scores enabling lowest rates, built $100,000 home equity through ownership versus rent. After 20 years age 45: Excellent credit enabling best rates and opportunities, substantial home equity wealth, accumulated rewards, financial flexibility through credit access when needed. Difference: $100,000+ home equity wealth, $20,000+ rewards and interest savings, superior financial flexibility and opportunities—all from understanding credit as tool rather than avoiding entirely. Person B not reckless borrower carrying debt irresponsibly but strategic credit user leveraging system benefits while avoiding pitfalls through understanding enabling wealth building impossible for Person A despite arguably more “disciplined” cash-only approach creating paradoxical disadvantage through credit system avoidance.

    Credit understanding separates those optimizing modern financial infrastructure from those disadvantaged by credit avoidance or misuse—strategic informed credit use enables wealth building and opportunity access impossible through either complete avoidance based on misconception or destructive overuse from lack of understanding.

    Recent Updates and Trends

    In recent years, alternative credit scoring models have expanded—FICO 10 and VantageScore considering rent, utility, and phone payments enabling those without traditional credit to establish creditworthiness, reducing “credit invisible” population historically disadvantaged by lack of traditional credit history despite responsible payment behavior in other domains.

    Buy-now-pay-later services have proliferated—Affirm, Klarna, Afterpay offering point-of-sale financing for online purchases making credit access frictionless potentially increasing debt accumulation among younger consumers unfamiliar with traditional credit risks while offering alternative to high-interest credit cards for planned purchases when used responsibly.

    Credit card rewards have intensified—cards offering 2-5% cash back or valuable travel points making strategic credit use more financially rewarding for those paying balances in full monthly versus historical minimal rewards environment, though simultaneously tempting overspending through rewards psychology potentially negating benefits when balances carried.

    Credit freezes have become free and instant—federal law requiring free credit freezes enabling stronger identity theft protection versus historical fees and delays making security measure more accessible, though requiring active management when applying for legitimate credit creating friction potentially causing missed opportunities when forgotten.

    Fundamental credit principles remain timeless: credit enables purchases before saving full amount creating flexibility and opportunity access, interest costs money making responsible use requiring discipline and understanding, credit scores dramatically affect borrowing costs justifying maintenance of excellent credit, and strategic credit use accelerates wealth while irresponsible use destroys it—regardless of scoring model evolution, new credit product proliferation, reward intensification, or security measure improvements, understanding credit fundamentals, maintaining strong creditworthiness, and using credit strategically versus destructively produces superior lifetime financial outcomes through appropriate leverage of modern financial infrastructure impossible without credit literacy.

    3 Things You Can Do Today

    Ready to understand and optimize your credit? Here are three simple steps you can take right now:

    1. Request your free credit reports from all three bureaus – Visit AnnualCreditReport.com (only official free source authorized by federal law). Request reports from all three bureaus: Equifax, Experian, TransUnion. Review each carefully: Check all accounts listed are yours (identity theft detection), verify balances and payment history accurate (error detection), confirm personal information correct. Common errors: Accounts not belonging to you, incorrect payment history marking on-time payments as late, outdated negative information exceeding legal reporting periods (7-10 years typically). Dispute any errors directly with bureau through their website. Takes 30 minutes accessing and reviewing establishing baseline credit understanding. Without this review, errors may damage scores unnecessarily or identity theft proceed undetected creating substantial future problems impossible to address without awareness of credit report contents.

    2. Check your credit score using free sources and understand factors affecting it – Free score sources: Credit card issuers (most provide free FICO score now), Credit Karma or similar services (VantageScore version, different but similar to FICO), Discover Credit Scorecard (free even without Discover card). Note your current score and range: 300-579 poor, 580-669 fair, 670-739 good, 740-799 very good, 800-850 exceptional. Understand five factors: Payment history 35% (pay everything on time!), amounts owed 30% (keep credit card balances below 30% of limit ideally), length of history 15% (maintain old accounts), new credit 10% (limit applications), credit mix 10% (variety of account types). Identify your weak areas: Late payments → set up automatic payments, high utilization → pay down balances or request limit increases, short history → maintain accounts long-term building age. Takes 15 minutes establishing score awareness and improvement roadmap.

    3. If you have credit cards, calculate actual interest costs on any balances and create payoff plan – For each credit card with balance: Note current balance, interest rate (APR), minimum payment. Calculate interest cost: Balance × (APR ÷ 12) = monthly interest charge. Example: $3,000 balance at 18% APR = $3,000 × 0.015 = $45 monthly interest. If paying only minimums: Use online credit card payoff calculator showing total interest and time. Typical $3,000 at 18% paying $75 minimums = 63 months, $1,769 interest, $4,769 total paid. Create aggressive payoff plan: How much can you pay beyond minimum? Example: $300 monthly instead of $75 = 11 months, $276 interest, $3,276 total paid. Difference: $1,493 interest saved, 52 months faster payoff. Write plan: “Pay $300 monthly on card until eliminated, total time 11 months.” Commit to no new charges while paying off. Takes 15 minutes creating concrete escape plan from high-interest debt cycle impossible without calculating actual costs making invisible damage visible and actionable.

    These actions create credit awareness and improvement foundation within 60 minutes—reviewed credit reports identifying errors and establishing baseline, checked scores understanding factors requiring improvement, and created specific payoff plans escaping high-cost debt—transforming credit from mysterious potentially dangerous activity into understood manageable aspect of financial life enabling strategic optimization impossible without foundational knowledge and specific action plans addressing individual situations.

    Credit Score Booklet

    Build Your Credit Before You Graduate

    A simple 30-day plan to help college students build credit, avoid costly mistakes, and save thousands.

    Get the Booklet →

    Quick FAQ

    Is it better to avoid credit entirely and use only cash/debit?
    No—strategic credit use provides: (1) Credit history necessary for major purchases (mortgages, auto loans even when you can afford them require credit history), (2) Fraud protection superior to debit cards (credit card liability limited to $50 legally, debit fraud affects actual bank funds), (3) Rewards (2-5% cash back on purchases paid in full), (4) Emergency flexibility when needed, (5) Credit score building enabling lowest rates when borrowing necessary. Cash/debit-only approach creates “credit invisible” status preventing mortgage approval even with large down payment and stable income. Recommended: Use credit cards for routine spending, pay full balance monthly, never carry high-interest debt, build excellent credit enabling opportunities while avoiding interest costs.

    Does carrying a small credit card balance help my credit score?
    No—complete myth wasting money. Credit scores improve through: (1) On-time payments (happens whether balance paid in full or carried), (2) Low utilization (percentage of limit used, under 30% ideal, actually better at 1-10%), (3) Length of history, (4) Credit mix. Carrying balance costs interest with zero score benefit. Example: $1,000 average balance at 20% APR = $200 annual interest wasted for no credit benefit. Correct approach: Use cards actively (generates payment history), pay full balance monthly (avoids interest), maintain low utilization (shows responsibility), keep accounts open long-term (builds history). This maximizes score while minimizing costs versus “carry balance” myth costing money unnecessarily.

    Will checking my own credit score hurt my credit?
    No—checking your own credit (soft inquiry) never affects scores. Types of inquiries: Soft inquiries (no impact): Checking your own credit, pre-qualified offers, employer background checks, existing creditor account reviews. Hard inquiries (small temporary impact): Applying for new credit card, applying for loan, applying for mortgage. Hard inquiries: Typically reduce score 5-10 points temporarily, recover within months, shopping for same loan type within 14-45 days counts as single inquiry. Checking own credit encouraged: Monitor for errors, detect fraud early, understand factors affecting score, track improvement progress. Fear of checking based on misunderstanding prevents valuable monitoring making you vulnerable to identity theft and reporting errors impossible to address without awareness.

    What is a good credit score and how long does it take to build?
    Score ranges: 740+ excellent (best rates, highest approval), 670-739 good (favorable rates), 580-669 fair (higher rates, conditional approval), below 580 poor (very high rates or denied). Building timeline from zero: 6 months: First score appears (need minimum 6 months credit history), 1-2 years: Reach 650-700 range with responsible use, 3-5 years: Reach 740+ with consistent on-time payments and low utilization, 7+ years: Potential for 800+ with perfect history. Faster building: Become authorized user on someone’s old account (inherits account age and history), secured credit card if no approval for regular card ($200-500 deposit becomes credit limit), credit-builder loan through credit unions. Damaged credit rebuilding: Similar timeline but starting from lower point, negative items remain 7 years (bankruptcy 10 years) but impact diminishes over time, consistent positive behavior gradually outweighs old negatives.

    What credit utilization ratio should I maintain?
    Utilization = current balance ÷ total credit limit across all cards. Ideal: Under 10% for best scores (example: $1,000 balance on $10,000 total limits = 10%), Acceptable: Under 30% (maintains good scores), Problematic: Over 50% (indicates financial stress to lenders, reduces scores), Critical: Over 75% or maxed out (major score damage). Example impact: Same person, $5,000 credit limit: 5% utilization ($250 balance) = 760 score, 50% utilization ($2,500 balance) = 680 score, 90% utilization ($4,500 balance) = 620 score. Strategies maintaining low utilization: Pay before statement closing date (balance reported is statement balance not payment due date), request credit limit increases (larger denominator lowers percentage), spread spending across multiple cards (keeps individual card percentages low), pay multiple times monthly (keeps reported balance minimal). Note: 0% utilization sometimes scores slightly lower than 1-10% (shows lack of usage) so some minimal activity optimal.

    Explore More in Money Basics

    Disclosure

    This article is provided for educational purposes only and does not constitute financial advice, credit counseling, or recommendation of specific credit products or strategies. Credit usage carries risks including debt accumulation, interest costs, and potential credit score damage from mismanagement. Interest rates, fees, terms, and credit score impacts vary significantly by individual circumstances, lender, and credit product. Examples use simplified scenarios—actual costs and outcomes differ. Credit score factors and calculations are proprietary to credit bureaus and scoring models (FICO, VantageScore)—exact impacts vary. Credit decisions should consider individual financial situation, goals, risk tolerance, and ability to repay. Credit agreements are legally binding contracts—read terms carefully before acceptance. Late payments and defaults have serious consequences including credit damage, collections, and legal action. Individual circumstances, credit histories, incomes, and appropriate credit usage vary requiring personalized assessment. This article does not address all credit types, terms, or considerations. Consult qualified financial professionals, credit counselors, or attorneys for personalized guidance. Credit bureau contact information and dispute processes available on bureau websites. Advertisements or sponsored content may appear within or alongside this content. All information presented independently for educational purposes only.