Category: Debt Management

  • 5.10 How to Become Debt-Free: A Step-by-Step Plan

    5.10 How to Become Debt-Free: A Step-by-Step Plan

    Becoming debt free means eliminating all consumer debt obligations—credit cards, personal loans, auto loans, and other non-mortgage debt—achieving financial state where income no longer consumed by monthly payments enabling complete redirection of formerly-obligated funds toward wealth building, emergency reserves, and discretionary goals. Representing transformative financial milestone affecting 30-40% of American households who’ve achieved zero consumer debt status, debt freedom creates dramatic lifestyle improvements including $300-1,500 monthly cash flow liberation from eliminated payments, reduced financial stress and marriage conflict, improved credit scores enabling better rates on necessary future borrowing, and psychological freedom from payment obligations constraining choices and creating perpetual anxiety about bills and emergencies. While journey from typical $15,000-30,000 consumer debt to complete elimination requires 18-36 months sustained discipline through aggressive payments, strategic method selection (debt snowball, avalanche, or consolidation), spending behavior modification, and emergency fund establishment preventing reaccumulation, debt-free status produces measurable wealth acceleration—individuals redirecting $800 monthly from debt payments to investments accumulate $190,000 over 20 years at 8% returns versus perpetual debtors paying $192,000 in interest over same period creating $382,000 wealth differential demonstrating becoming debt free as essential wealth-building prerequisite impossible for perpetually-obligated individuals spending 15-25% income on interest and minimum payments instead of productive asset accumulation.

    This article is designed for anyone carrying consumer debt wanting complete elimination roadmap, individuals frustrated by perpetual payment obligations seeking freedom, or those beginning debt-free journey needing comprehensive strategy. You do not need financial expertise to become debt free—fundamental concepts accessible through systematic approach combining method selection, payment discipline, and behavioral change, though requires honest commitment sustaining 18-36 month elimination timeline without deviation, realistic budget creation aligning spending with income while maximizing debt payments, and permanent lifestyle adjustments preventing reaccumulation after freedom achieved, making debt-free journey requiring both mechanical execution (payments, methods, strategies) and psychological transformation (spending habits, financial priorities, lifestyle choices) impossible when viewing as temporary sacrifice versus permanent behavior change enabling sustained freedom.

    Understanding becoming debt free matters because debt-free status liberates $500-1,500 monthly from payments enabling emergency fund establishment, retirement acceleration, and goal achievement impossible when perpetually obligated, eliminates financial stress and relationship conflict from payment burdens and economic vulnerability, and creates wealth-building foundation allowing compound returns versus compound interest costs—while debt-free individuals accumulate $200,000-500,000+ additional lifetime wealth through payment redirection to investments versus perpetual debtors paying $150,000-300,000 in interest over working years, demonstrating debt freedom as critical wealth-building milestone not merely payment elimination but fundamental financial transformation enabling prosperity impossible for perpetually-indebted individuals regardless of income level when debt service consumes growth capacity preventing wealth accumulation through interest costs and opportunity costs exceeding any temporary convenience or lifestyle benefits.

    Educational disclaimer: This article provides general educational information about debt elimination strategies and debt-free living. Individual debt situations, appropriate methods, elimination timelines, and outcomes vary significantly based on circumstances including total debt, income, expenses, and personal discipline. This is not financial advice or guarantee of specific results. Debt elimination requires sustained commitment and behavior changes. Some situations may require professional credit counseling or financial advice. Debt-free journey timelines represent typical scenarios assuming consistent execution—actual results vary based on individual circumstances and commitment maintenance.

    The Debt-Free Vision

    What Debt-Free Life Looks Like

    Financial benefits of debt freedom:

    • Cash flow liberation: $500-1,500 monthly formerly consumed by debt payments redirected to priorities
    • Emergency resilience: No payment obligations creating vulnerability during income disruption
    • Credit score improvement: Paid accounts and zero utilization improving scores 50-100 points
    • Interest savings: Zero dollars wasted on interest enabling 100% productive asset allocation
    • Financial flexibility: Career changes, entrepreneurship, lifestyle adjustments possible without payment constraints

    Psychological and lifestyle benefits:

    • Stress reduction: No anxiety about payment deadlines, collection calls, or financial emergencies
    • Relationship improvement: Money conflicts eliminated through shared debt freedom achievement
    • Sleep quality: No 3am worry about making next month’s payments
    • Decision freedom: Job changes, education, relocation possible without debt obligations
    • Generosity capacity: Ability helping family, contributing charitably, supporting causes

    Debt-free versus debt-burdened comparison:

    Debt-burdened household ($60,000 income):

    • Monthly gross income: $5,000
    • Debt payments: $1,200 (24% of gross income)
    • After essential expenses: $800 remaining for savings, emergencies, goals
    • Emergency fund: $500 (inadequate)
    • Retirement savings: $100 monthly (2% of income, insufficient)
    • Financial stress: High (one emergency creates crisis)
    • Job flexibility: Low (cannot reduce income, chained to current employment)

    Debt-free household (same $60,000 income):

    • Monthly gross income: $5,000
    • Debt payments: $0
    • After essential expenses: $2,000 remaining
    • Emergency fund: $15,000 (3+ months expenses, adequate)
    • Retirement savings: $750 monthly (15% of income, on-track)
    • Financial stress: Low (buffer handles emergencies)
    • Job flexibility: High (can pursue opportunities, negotiate, change careers)

    Wealth accumulation differential over 20 years:

    • Debt-burdened: $100 monthly retirement = $59,000 accumulated at 8%
    • Debt-free: $750 monthly retirement = $443,000 accumulated at 8%
    • Difference: $384,000 from debt freedom enabling increased savings

    Timeline to Debt Freedom

    Typical elimination timelines by debt load:

    Small debt ($5,000-10,000):

    • Aggressive approach ($500-800 monthly): 6-20 months
    • Moderate approach ($300-500 monthly): 12-36 months
    • Minimal approach ($200-300 monthly): 24-48 months

    Medium debt ($10,000-25,000):

    • Aggressive approach ($800-1,200 monthly): 10-30 months
    • Moderate approach ($500-800 monthly): 18-48 months
    • Minimal approach ($300-500 monthly): 36-72 months

    Large debt ($25,000-50,000):

    • Aggressive approach ($1,500-2,500 monthly): 12-36 months
    • Moderate approach ($1,000-1,500 monthly): 24-48 months
    • Minimal approach ($600-1,000 monthly): 48-84 months

    Timeline acceleration factors:

    • Intensity level (aggressive versus moderate approach)
    • Income increases or side income addition
    • Spending reduction through lifestyle adjustments
    • Windfall application (tax refunds, bonuses, inheritances)
    • Method selection (avalanche versus snowball versus hybrid)

    Advertisement

    Financial Wellness Planner

    Creating Your Debt-Free Plan

    Step 1: Complete Debt Inventory and Assessment

    Comprehensive debt listing:

    • Every debt with: Creditor name, balance, APR, minimum payment, due date
    • Total debt calculation
    • Total minimum payments required monthly
    • Weighted average APR across all debts

    Example comprehensive inventory:

    • Credit card A: $4,500 at 22%, $135 minimum, due 15th
    • Credit card B: $6,800 at 19%, $204 minimum, due 5th
    • Credit card C: $2,200 at 24%, $66 minimum, due 20th
    • Auto loan: $12,000 at 8%, $365 minimum, due 1st
    • Personal loan: $5,500 at 14%, $180 minimum, due 10th
    • Total debt: $31,000
    • Total minimums: $950 monthly
    • Average APR: 16.4%

    Step 2: Calculate Maximum Payment Capacity

    Income assessment:

    • Primary employment gross monthly: $X
    • Side income current or potential: $Y
    • Total available income: $X + $Y

    Expense analysis:

    • Essential fixed: Housing, utilities, insurance, transportation = $A
    • Essential variable: Groceries, fuel, necessary medical = $B
    • Discretionary current: Dining, entertainment, shopping, subscriptions = $C
    • Total expenses current: $A + $B + $C

    Payment capacity calculation:

    • Current available: Income – (Essential + Minimum Debt Payments)
    • Aggressive available: Income – Essential + Discretionary Cuts + Side Income

    Example capacity building:

    • Income: $5,000 monthly
    • Essential expenses: $2,800 (housing, utilities, groceries, insurance, fuel)
    • Current discretionary: $700 (dining $300, entertainment $150, shopping $150, subscriptions $100)
    • Current minimums: $950
    • Current surplus: $550 ($5,000 – $2,800 – $700 – $950)
    • Aggressive cuts: Reduce discretionary to $200 (saves $500)
    • Side income: DoorDash 15 hours weekly = $700
    • Aggressive capacity: $1,750 total ($950 minimums + $550 current + $500 cuts + $700 side income)

    Step 3: Select Elimination Method

    Method selection based on personality:

    Debt Snowball (smallest first) choose if:

    • Need quick psychological wins (3-6 months first victory)
    • Multiple small balances under $2,000
    • Emotionally-driven decision maker
    • Previous debt attempts failed from discouragement

    Debt Avalanche (highest APR first) choose if:

    • Mathematically-oriented wanting maximum savings
    • Comfortable with delayed gratification (12+ months first win acceptable)
    • Large interest rate gaps (24% versus 6%)
    • High total debt where savings substantial ($2,000+)

    Hybrid approach (quick win then avalanche) choose if:

    • Want psychological boost AND mathematical optimization
    • One small balance under $1,000 for immediate victory
    • Then systematic highest-rate attack

    Step 4: Create Month-by-Month Projection

    Detailed timeline planning:

    • Month-by-month payment allocation
    • Victory milestones (each debt elimination)
    • Balance progression tracking
    • Debt-free date projection

    Example snowball timeline ($31,000 debt, $1,750 monthly):

    • Months 1-3: Attack $2,200 (smallest), pay $1,016 monthly, eliminate month 3
    • Months 4-8: Attack $4,500, pay $1,151 monthly (rolled $1,016), eliminate month 8
    • Months 9-14: Attack $5,500, pay $1,355 monthly, eliminate month 14
    • Months 15-20: Attack $6,800, pay $1,535 monthly, eliminate month 20
    • Months 21-28: Attack $12,000, pay $1,750 monthly, eliminate month 28
    • Debt-free in 28 months (2 years 4 months)

    Debt-Free Journey Phases

    Phase 1: Foundation and Launch (Months 1-3)

    Critical initial actions:

    • Build $1,000 starter emergency fund (prevents reactive charging)
    • Create detailed budget and tracking system
    • Implement chosen method (snowball/avalanche)
    • Set up automatic minimum payments preventing missed payments
    • Remove credit cards from wallet (freeze or cut up)
    • Delete saved card information from online accounts

    Behavior changes launching immediately:

    • Cash/debit only for discretionary spending
    • 30-day purchase delay rule for non-essentials
    • Weekly spending tracking and budget review
    • Side income commencement if planned

    First victory targeting:

    • Focus entire extra payment on attack debt
    • If snowball, aim for 3-6 month first elimination
    • Track progress weekly creating motivation
    • Visualize balance reduction (charts, thermometers)

    Phase 2: Momentum Building (Months 4-12)

    Maintaining commitment through middle months:

    • First debt eliminated (snowball) or substantial progress (avalanche)
    • Roll payments creating increasing attack amounts
    • Celebrate milestones preventing burnout
    • Adjust budget as needed without reducing debt payment

    Common challenges and solutions:

    Challenge: Debt fatigue and temptation

    • Problem: Tired of sacrifice, tempted by lifestyle inflation
    • Solution: Review debt-free vision, calculate months remaining, plan celebration

    Challenge: Unexpected expenses

    • Problem: $800 car repair threatens progress
    • Solution: Use starter emergency fund, pause aggressive payments 1-2 months to replenish, resume

    Challenge: Income disruption

    • Problem: Hours cut or job change reducing income
    • Solution: Maintain minimums, reduce to basics, increase side income, resume aggressive when stable

    Momentum maintenance tactics:

    • Track cumulative interest saved versus minimum-only approach
    • Visual progress: Debt thermometer showing remaining balance
    • Accountability: Share progress with partner, friend, or online community
    • Small rewards: $25-50 celebration each debt eliminated

    Phase 3: Acceleration and Final Push (Months 13-24+)

    Characteristics of final phase:

    • 3-4 debts already eliminated (snowball) or largest high-rate gone (avalanche)
    • Payment amounts dramatically increased through rolled payments
    • Debt-free date clearly visible (under 12 months remaining)
    • Psychological shift from burden to achievable goal

    Final push strategies:

    • Apply ALL windfalls to remaining debt (tax refunds, bonuses)
    • Temporary intensity increase (extra side gig hours, selling items)
    • Zero discretionary spending final 90 days if close to finish
    • Countdown tracking (days until debt free)

    Example final acceleration:

    • Month 20: One debt remaining, $8,000 balance
    • Standard payment: $1,500 monthly = 5.5 months remaining
    • Acceleration: $2,500 tax refund applied + increase payment to $2,000 through temporary cuts
    • New timeline: 3 months to complete elimination
    • Victory: Debt-free month 23 versus projected month 26
    Advertisement
    Reserved space for in-content ad

    Staying Debt Free After Elimination

    The Critical Transition Period

    First 90 days debt-free (highest risk period):

    • Psychological adjustment from restriction to freedom
    • Temptation to “celebrate” with spending creating reaccumulation
    • Muscle memory of using credit for convenience
    • Lack of clear goals for liberated cash flow

    Preventing immediate reaccumulation:

    • Redirect ENTIRE former debt payment to goals (not lifestyle inflation)
    • Keep credit cards closed/frozen for 90 days minimum
    • Build full emergency fund (3-6 months expenses) first priority
    • Maintain budget tracking preventing spending creep

    Example successful transition:

    • Become debt-free, was paying $1,200 monthly to debt
    • Immediate allocation: $1,000 to emergency fund (build to $18,000 over 18 months), $200 small lifestyle improvement (recognition, not inflation)
    • After emergency fund complete: $750 retirement, $250 goals (vacation, car replacement), $200 lifestyle
    • Result: Sustained debt-free through purposeful redirection

    Emergency Fund as Debt Prevention

    Full emergency fund building:

    • Target: 3-6 months essential expenses
    • Single income: 6 months minimum
    • Dual income: 3-4 months acceptable
    • Self-employed/commission: 6-12 months recommended

    Emergency fund prevents:

    • $1,200 car repair → Use fund versus charging to cards
    • $800 medical expense → Use fund versus payment plan at 18%
    • $2,500 home repair → Use fund versus contractor financing
    • Job loss → Maintain expenses 3-6 months without debt

    Fund replenishment discipline:

    • After emergency use, temporarily reduce lifestyle/savings to rebuild
    • Replenish within 3-6 months maintaining buffer
    • Never consider fund as “available money” for wants

    Strategic Credit Card Use (If Choosing to Use)

    Rules for debt-free credit card usage:

    • Rule 1: Pay FULL balance every month without exception
    • Rule 2: Only charge what already budgeted and affordable
    • Rule 3: Track spending ensuring alignment with budget
    • Rule 4: Automatic full payment set up preventing carries
    • Rule 5: If cannot pay full balance even once, freeze cards immediately

    Benefits when used strategically:

    • Rewards: 1-2% cash back = $500-1,000 annually on normal spending
    • Fraud protection: Better than debit card security
    • Purchase protections: Extended warranties, damage coverage
    • Credit score maintenance: Active accounts with perfect payment history

    Warning signs requiring card freeze:

    • Carried balance even $100 for one month
    • Unsure what charged this month (tracking breakdown)
    • Charging to make budget work versus charging budgeted amounts
    • Using cards for emotional spending or impulse purchases
    • Statement balance surprises (thought would be lower)

    Permanent Lifestyle Adjustments

    Maintaining debt-free mindset:

    • Live on less than earn (permanent spending discipline)
    • Save for purchases (car replacement fund, vacation fund, gift fund)
    • Resist lifestyle inflation (maintain reasonable living despite income increases)
    • Question purchases (need versus want, alignment with values)

    Specific behavior changes maintaining freedom:

    • 30-day purchase delay for items over $100 preventing impulse buying
    • Cash flow planning for irregular expenses (annual insurance, property taxes)
    • Sinking funds for anticipated needs (car replacement, home maintenance)
    • Annual budget reviews adjusting for income and expense changes

    Wealth Building After Debt Freedom

    Redirecting Liberated Cash Flow

    Recommended allocation of former debt payments:

    Phase 1: Emergency fund completion (3-18 months)

    • 100% of former debt payment to emergency fund until 3-6 months expenses saved
    • Creates financial foundation preventing future debt

    Phase 2: Wealth acceleration (ongoing)

    • 60-70% to retirement and investments
    • 15-20% to sinking funds (car replacement, home maintenance)
    • 10-15% to goals (vacation, education, gifts)
    • 5-10% to lifestyle improvements (rewarding sustained discipline)

    Example wealth building ($1,200 monthly liberated from debt):

    • Retirement: $800 (67%)
    • Sinking funds: $200 (17%)
    • Goals: $120 (10%)
    • Lifestyle: $80 (6%)

    Compound Returns Versus Compound Interest

    Perpetual debt scenario (20 years):

    • Maintain $15,000 average balance at 18% APR
    • Pay $450 monthly (minimums preventing principal reduction)
    • Total paid over 20 years: $108,000 ($450 × 240 months)
    • Still owe: $15,000 (perpetual minimums never eliminate debt)
    • Net position: -$123,000 (paid interest plus balance remaining)
    • Wealth accumulated: $0

    Debt-free wealth building scenario (20 years):

    • Eliminate $15,000 debt in 36 months paying $500 monthly
    • Total paid: $18,000 (including interest)
    • Redirect $500 monthly to investments for remaining 204 months
    • Invested amount: $102,000 ($500 × 204)
    • Growth at 8% annually: $248,000 final value
    • Net position: +$230,000 ($248,000 accumulated – $18,000 debt paid)

    Wealth differential: $353,000 (debt-free $230,000 versus perpetual debt -$123,000)

    Long-Term Wealth Acceleration

    Debt-free household wealth advantages:

    • Maximum retirement contributions (15-20% versus 3-5% for indebted)
    • Home ownership acceleration (extra principal or larger down payments)
    • Investment opportunities (real estate, business, education)
    • Generational wealth transfer (inheritance, education funding for children)
    • Compound returns working decades uninterrupted by payment obligations

    30-year wealth comparison ($60,000 income):

    Perpetually-indebted household:

    • $800 monthly debt payments for 30 years = $288,000 paid to creditors
    • $200 monthly retirement (all affordable) = $293,000 accumulated at 8%
    • Rents entire 30 years (cannot qualify for mortgage with debt burden)
    • Net worth age 55: $293,000

    Debt-free household:

    • Eliminate debt in 3 years, debt-free 27 years
    • $900 monthly retirement for 27 years = $983,000 accumulated at 8%
    • Home purchase year 5, own outright year 30 (paid off early)
    • Home equity: $400,000
    • Net worth age 55: $1,383,000

    Wealth difference: $1,090,000 from debt freedom

    Advertisement
    Reserved space for in-content ad

    Why Understanding Becoming Debt Free Matters

    Without understanding debt freedom journey, individuals either perpetuate debt through minimum payments lacking elimination strategy costing $150,000-300,000 in lifetime interest, or attempt elimination without comprehensive plan causing abandonment through discouragement when progress slower than expected, missing transformative financial milestone liberating $500-1,500 monthly enabling emergency fund establishment, retirement acceleration, and wealth building impossible when perpetually obligated—while debt-free individuals redirect formerly-consumed payments to investments accumulating $200,000-500,000+ additional lifetime wealth through compound returns versus compound interest costs, experience reduced financial stress and relationship conflict, and achieve financial flexibility enabling career changes and goal pursuits impossible for debt-burdened counterparts, demonstrating becoming debt free as critical wealth-building prerequisite not merely payment elimination but fundamental financial transformation enabling prosperity regardless of income level creating measurable outcome differences impossible for perpetually-indebted individuals when debt service consumes growth capacity.

    Understanding becoming debt free enables individuals to:

    • Create comprehensive elimination plan with specific monthly allocations and timeline
    • Select appropriate method (snowball, avalanche, hybrid) matching personality and debt composition
    • Maintain commitment through 18-36 month journey preventing discouragement-driven abandonment
    • Implement permanent behavior changes preventing reaccumulation after freedom achieved
    • Build emergency fund establishing debt prevention infrastructure
    • Redirect liberated cash flow strategically accelerating wealth building
    • Sustain debt-free status through lifestyle discipline and spending alignment

    Debt freedom knowledge transforms elimination from vague aspiration into systematic achievable process with specific steps, timelines, and behavioral requirements, enabling complete consumer debt elimination creating wealth-building foundation through payment redirection impossible when viewing as temporary sacrifice versus permanent lifestyle transformation requiring sustained commitment and behavior changes maintaining freedom decades beyond initial achievement.

    Common Misunderstandings

    Many people view debt freedom as requiring extreme sacrifice and deprivation impossible to sustain long-term. In reality, most achieve debt freedom through moderate lifestyle adjustments not starvation budgets—cutting $300-500 discretionary spending monthly from dining out, entertainment, and subscriptions plus adding $400-600 side income 10-15 hours weekly creates $700-1,100 monthly attacking debt without eliminating all enjoyment or quality of life, proving debt freedom achievable through strategic adjustments not dramatic lifestyle destruction making sustained 18-36 month commitment realistic versus unsustainable extreme approaches causing burnout and abandonment.

    Another common misconception is debt freedom only achievable for high-income earners with substantial discretionary income. In practice, debt freedom more dependent on discipline than income—$40,000 earner eliminating $12,000 debt in 24 months through aggressive $600 monthly achieves freedom faster than $100,000 earner perpetually carrying $25,000 through lifestyle inflation and lack of commitment, proving behavior and intensity more important than income level making debt freedom achievable at any income through prioritization and sustained discipline not requiring salary doubling or windfall inheritance.

    Some believe achieving debt freedom means never using credit cards or borrowing again creating financial limitation. However, debt-free individuals can strategically use credit cards when paying full balances monthly capturing rewards and protections without interest costs, and appropriately borrow for appreciating assets (mortgages) or high-ROI investments (strategic education) when terms favorable and within budget, proving debt freedom means eliminating consumer debt specifically not absolute avoidance of all credit or strategic borrowing making lifestyle sustainable and optimal versus unnecessarily restrictive misinterpretation preventing legitimate financial tools when used appropriately.

    How Becoming Debt Free Fits Into Financial Success

    Becoming debt free enables wealth acceleration through payment redirection from interest costs to compound returns accumulating $200,000-500,000+ additional lifetime wealth, creates financial resilience through emergency fund capacity and zero payment obligations surviving income disruptions impossible when debt-burdened, and establishes psychological freedom reducing stress and enabling career flexibility making debt-free status critical wealth-building prerequisite not optional enhancement—making debt freedom understanding essential requiring comprehensive elimination strategy with method selection and timeline projection, permanent behavior changes preventing reaccumulation through spending discipline and emergency fund establishment, and strategic wealth redirection of liberated cash flow maximizing compound return benefits, transforming debt elimination from vague goal into systematic achievable process creating measurable prosperity impossible for perpetually-indebted individuals regardless of income level when debt service consumes growth capacity preventing wealth accumulation through interest costs and opportunity costs exceeding any temporary convenience benefits.

    For example, two households both age 35 earning identical $70,000 annually. Household A carrying $28,000 consumer debt ($8,000 credit cards at 20%, $12,000 auto loan at 9%, $8,000 personal loan at 14%) paying $840 monthly minimums perpetually. Makes minimums indefinitely, balances barely shrink due to insufficient payments, continues pattern 30 years. Age 65: Paid $302,400 to creditors over 30 years ($840 × 360 months), still carrying $15,000 remaining debt from perpetual minimums and periodic reaccumulation, retirement savings $150 monthly all affordable = $220,000 accumulated, rents entire period unable to qualify for mortgage with debt burden = $0 home equity, net worth $220,000 minus $15,000 debt = $205,000. Household B understands debt freedom, creates aggressive elimination plan. Year 1-2: Implements debt snowball, cuts discretionary spending $400 monthly, adds DoorDash side gig $600 monthly, attacks debt with $1,840 total monthly ($840 minimums + $400 cuts + $600 side income). Eliminates all $28,000 in 18 months (paid $33,120 including interest). Year 3: Debt-free, builds emergency fund redirecting entire $1,840 monthly, accumulates $22,000 in 12 months. Year 4-5: Emergency fund complete, redirects $1,300 monthly to retirement ($900) and home down payment savings ($400), saves $60,000 total. Year 6: Purchases $300,000 home with $60,000 down, mortgage $240,000 at 6.5%, payment $1,520 monthly, redirects additional $300 monthly to principal accelerating payoff. Year 7-20: Continues $900 retirement plus $600 extra mortgage principal ($300 regular plus $300 former debt payment), pays off home year 20 (age 55). Year 21-30: Redirects $1,520 mortgage payment to retirement continuing $900 base = $2,420 monthly invested. Age 65: Retirement savings $900 monthly for 28 years plus $2,420 monthly final 10 years = $895,000 accumulated at 8%, home worth $500,000 owned outright = $0 mortgage, net worth $1,395,000. Difference: Household A’s perpetual debt created $205,000 net worth consuming $302,400 in payments with zero home equity, Household B’s debt freedom created $1,395,000 net worth (6.8x higher) from identical income through 18-month aggressive elimination enabling payment redirection demonstrating $1,190,000 wealth differential from understanding debt freedom requiring initial 18-month sacrifice creating permanent liberation impossible when perpetually obligated accepting lifetime payment burden versus temporary intensity achieving freedom.

    Debt freedom understanding separates wealthy liberated individuals accumulating substantial assets through payment redirection from perpetually-obligated strugglers enriching creditors through lifetime interest payments, requiring both systematic elimination execution and permanent behavioral transformation preventing reaccumulation creating generational wealth differences impossible without debt freedom literacy.

    Recent Updates and Trends

    In recent years, debt-free living movement has gained mainstream visibility through social media success stories and financial influencer advocacy creating increased cultural acceptance, though fundamental elimination mechanics unchanged with snowball/avalanche methods and aggressive payment discipline remaining core strategies regardless of social validation or community support amplifying motivation through shared celebration.

    Buy-now-pay-later services have complicated debt-free journeys through installment payment proliferation creating payment stack confusion when multiple BNPL obligations added to traditional debt loads, though strategic approach unchanged requiring comprehensive debt inventory including all payment obligations and systematic elimination regardless of specific product formats making BNPL inclusion essential not separate consideration.

    Inflation and cost-of-living increases have pressured debt elimination timelines through reduced discretionary income for aggressive payments, though fundamental intensity principle unchanged with side income addition and spending reduction still creating payment capacity regardless of baseline budget tightness making commitment and creativity more important than perfect economic conditions for debt freedom achievement.

    Online debt-free communities and apps have enhanced accountability and tracking simplifying execution and motivation maintenance, though completion still dependent on individual discipline not technological tools making community support valuable enhancement not replacement for sustained personal commitment required achieving freedom.

    Fundamental debt freedom principles remain timeless: eliminate consumer debt through aggressive payments liberating $500-1,500 monthly, prevent reaccumulation through emergency fund and behavior changes, redirect liberated cash flow to wealth building creating compound return benefits, and maintain freedom through permanent spending discipline aligned with income—regardless of social movement visibility, BNPL proliferation, economic pressures, or community tool development, understanding systematic elimination approach combining method selection with behavioral transformation produces debt freedom creating wealth-building foundation impossible for perpetually-indebted individuals consuming growth capacity through payment obligations regardless of supportive cultural trends or technological conveniences.

    3 Things You Can Do Today

    Ready to begin debt-free journey? Here are three simple steps you can take right now:

    1. Create complete debt-free plan with inventory, method selection, payment capacity, and projected timeline – Complete debt inventory: List every consumer debt with balance, APR, minimum payment (example: Card A $4,200 at 19%, Card B $6,500 at 22%, Auto $11,000 at 8%, total $21,700). Calculate current minimums total ($650 example). Select method: Snowball (smallest first psychological wins) or avalanche (highest APR mathematical optimization) based on personality assessment, rank debts accordingly. Determine payment capacity: Current income minus essential expenses minus minimums = current surplus (example: $4,500 income – $2,600 essential – $650 minimums = $1,250 discretionary). Identify cuts: Review discretionary identifying $300-500 monthly reductions (example: Dining $200, entertainment $100, subscriptions $100 = $400 cuts). Add side income: Identify $400-800 realistic monthly (example: DoorDash 12 hours weekly = $600). Calculate total capacity: Minimums + cuts + side income (example: $650 + $400 + $600 = $1,650 total monthly). Project timeline: Use debt calculator entering all debts with method and total payment determining months to freedom (example: $21,700 at $1,650 monthly = 15 months debt-free). Create month-by-month plan: List which debt attacked each month with projected elimination dates creating concrete roadmap. Write commitment: “Total debt: $21,700. Method: [Snowball/Avalanche]. Payment: $1,650 monthly ($650 minimums + $400 cuts + $600 side income). Timeline: 15 months. Debt-free date: [Month Year].” Takes 45 minutes creating comprehensive strategic plan transforming vague “pay off debt” into specific actionable monthly allocations with concrete freedom date impossible when attempting elimination without systematic approach and timeline projection.

    2. Build $1,000 starter emergency fund THIS MONTH before aggressive debt attack preventing reactive charging – Determine funding sources: Identify immediate cash sources totaling $1,000. Example sources: Tax refund $600, sell unused items $250 (bike, electronics, furniture), reduce this month’s discretionary to zero $150 = $1,000 total. Alternative if no lump sources: Extreme 30-day intensity saving $35 daily through zero discretionary spending plus daily DoorDash 4 hours = $1,050 in 30 days. Open separate savings account: High-yield online savings (Ally, Marcus, CIT) separate from checking preventing casual access, name account “Emergency Fund ONLY” creating psychological barrier. Deposit $1,000: Immediate transfer completing starter fund. Establish rules: Use ONLY for genuine emergencies over $200 that are unexpected necessities (car repairs, medical, essential home repairs), NOT for planned expenses, wants, or convenience. Replenishment commitment: If used, immediately pause aggressive debt payments and rebuild fund within 60 days before resuming debt attack. Fund purpose: Prevents $800 car repair forcing credit card charging restarting debt cycle, provides psychological security reducing financial anxiety, creates small buffer enabling focused debt elimination without constant emergency vulnerability. Protection: Remove debit card from account or don’t order one requiring manual transfer for access creating friction preventing casual spending. Verification: Write commitment “Emergency fund complete: $1,000 in [Account]. Use only for emergencies over $200. Will replenish within 60 days if used before resuming debt payments.” Takes 1-30 days depending on method but prevents debt restart through reactive emergency charging making this FIRST step before aggressive elimination protecting progress impossible when attempting debt freedom without emergency buffer creating vulnerability forcing renewed borrowing.

    3. Implement immediate debt freedom behaviors TODAY creating foundation before timeline starts – Credit card removal: Remove ALL credit cards from wallet immediately, cut up cards or freeze in ice block creating access friction, delete saved card information from ALL online merchants (Amazon, retailers, subscriptions). Budget creation: Create zero-based budget allocating every income dollar (housing, utilities, groceries, debt payments, goals) using app (YNAB, EveryDollar, Mint) or spreadsheet. Tracking start: Track every dollar spent for next 30 days using app or receipts revealing actual spending patterns versus assumed. Automatic payments: Set up automatic minimums on all non-attack debts preventing missed payments damaging credit while focusing energy on attack debt. Cash envelope trial: Withdraw cash for problem categories (dining $100, entertainment $50, shopping $50) using physical cash preventing overspending when envelope empty. Purchase delay rule: Commit to 30-day delay for ANY purchase over $50 not essential, write on calendar “Okay to buy [item] after [30 days]” preventing impulse buying. Side income launch: If planning side gig, complete sign-up process TODAY (DoorDash, Uber, Instacart applications, freelance profile creation), commit to start date within 7 days beginning income generation. Accountability: Inform spouse/partner/trusted friend of debt-free commitment, share starting debt amount and projected timeline creating external accountability, schedule 30-day check-in reviewing progress. Visualization: Create visual progress tracker (thermometer showing total debt, bars for each individual debt) posting prominently (refrigerator, bathroom mirror, office wall) creating daily reminder. Celebration planning: Mark calendar with projected debt-free date, plan celebration dinner $50 budget recognizing achievement without excessive spending. Write commitments: “Cards removed, budget created, tracking started, minimums automated, cash envelopes ready, purchases delayed, side income launching [date], accountability partner [name], visual tracker posted, celebration planned [date].” Takes 2-3 hours implementing systematic behavioral foundation making debt freedom sustainable versus relying on willpower alone creating inevitable failure when foundational disciplines absent impossible when attempting elimination without immediate concrete behavior changes establishing success infrastructure.

    These actions create debt-free journey foundation within 4-5 hours—comprehensive plan with method, capacity, and timeline projecting 15-month freedom example, $1,000 emergency fund preventing reactive reaccumulation, and immediate behavioral implementation removing cards, creating budget, launching tracking—transforming debt freedom from distant dream into concrete systematic process with specific monthly actions and predictable timeline impossible without strategic planning, emergency protection, and foundational behavior establishment creating success probability through systematic approach versus vague commitment lacking execution infrastructure.

    Quick FAQ

    How long does it take to become debt free?
    Typically 12-36 months for most consumer debt loads ($10,000-30,000) with aggressive payments, though timeline depends on total debt, payment capacity, and intensity level: Timeline factors—Total debt amount ($10,000 versus $50,000 dramatically different), monthly payment capacity (income minus essential expenses creating $500-2,000 available), intensity level (aggressive cuts and side income versus moderate approach), method selection (avalanche slightly faster mathematically versus snowball), windfall application (tax refunds, bonuses accelerating elimination). Typical scenarios—$15,000 debt, $700 monthly payment = 24 months. $25,000 debt, $1,200 monthly = 24 months. $35,000 debt, $1,500 monthly = 27 months. Acceleration strategies—Side income addition (DoorDash, freelance) adding $500-800 monthly cuts timeline 30-40%, spending freeze periods redirecting 100% discretionary ($400-800) temporarily accelerating payoff, windfall application ($3,000 tax refund = 3-6 months acceleration on typical debt). Realistic expectations—Under $10,000 achievable in 12-18 months with moderate intensity, $10,000-25,000 achievable in 18-30 months with aggressive approach, $25,000-50,000 achievable in 24-48 months with sustained commitment, over $50,000 requires 36-60 months or higher income/intensity. Key insight: Completion time more dependent on payment amount and discipline than total debt, making $30,000 eliminated faster with $1,500 monthly than $15,000 with $300 monthly demonstrating intensity importance over absolute debt amount for timeline determination.

    Should I save emergency fund or pay debt first?
    Build $1,000 starter emergency fund FIRST, then attack debt aggressively, then complete full 3-6 month emergency fund after debt-free, preventing reactive reaccumulation: Recommended sequence—Step 1: Save $1,000 starter fund as quickly as possible (1-2 months through cuts and hustle), prevents 80%+ of emergency credit card usage. Step 2: Attack debt aggressively with all available payment capacity (18-36 months typically), maintain $1,000 buffer throughout. Step 3: After debt-free, build full emergency fund (3-6 months expenses) before major investing (6-18 months typically). Step 4: Wealth building with fully-funded emergency protection. Rationale—$1,000 prevents most emergency charging ($800 car repair, $600 medical, $500 appliance) maintaining debt elimination progress without derailment, but larger fund delays debt attack costing thousands in continued interest accumulation while saving making starter fund optimal balance. Example comparison—Have $8,000 available, considering full emergency fund versus debt attack. Option A: Save full $18,000 emergency fund first (requires 12+ months), THEN attack $15,000 debt (18 months), total 30 months, interest paid $3,500. Option B: Save $1,000 starter (immediate), attack debt with remaining $7,000 + future payments (12 months to eliminate), build full fund after (10 months), total 22 months, interest paid $1,200, saves $2,300 and 8 months. Danger of no buffer—Attempting debt freedom without ANY emergency fund forces credit card usage when $800 car repair occurs negating progress and restarting debt cycle, proving $1,000 minimum essential not optional. Full fund argument—Some advocate completing full fund before debt (Dave Ramsey approach emphasizes behavior over math), acceptable if provides psychological security enabling commitment, though mathematically costs $2,000-5,000 in extra interest versus starter-fund-then-debt approach making starter fund generally optimal balance.

    What do I do with liberated cash flow after becoming debt free?
    Redirect ENTIRE former debt payment to financial priorities avoiding lifestyle inflation, with emergency fund completion first then retirement acceleration and goal funding: Critical principle—Do NOT increase lifestyle spending significantly immediately after debt freedom (lifestyle inflation trap), maintain similar living standard redirecting payments to wealth building creating freedom’s actual financial benefit. Immediate priority (first 6-18 months debt-free)—Build/complete full emergency fund 3-6 months essential expenses, example $1,000 monthly debt payment becomes $1,000 monthly emergency fund contributions building $18,000 in 18 months creating complete financial security before other priorities. Ongoing allocation after emergency fund complete—60-70% to retirement and investments (maximize compound return benefits), 15-20% to sinking funds (car replacement, home maintenance preventing future debt), 10-15% to goals (vacation, education, gifts), 5-10% to lifestyle improvements (rewarding discipline sustainably). Example allocation $1,200 monthly liberated—Retirement $800, sinking funds $200, goals $120, lifestyle $80 creating wealth building without deprivation. Retirement prioritization—Maximize employer match immediately (free money), increase to 15% income minimum for comfortable retirement, contribute additional beyond if goals funded creating tax advantages and compound time. Sinking fund importance—Save monthly for predictable irregular expenses (car replacement $200/month, home maintenance $100/month, insurance $50/month) preventing reactive borrowing when needs arise years later maintaining debt-free status. Lifestyle improvement guidance—Allow modest increase recognizing achievement (restaurant budget $100→$150 monthly) without returning to pre-debt spending creating sustainable balance, major increase (buying new car, moving to expensive apartment) defeats freedom purpose making restraint essential. Wealth acceleration power—$1,000 monthly invested at 8% = $590,000 in 25 years creating retirement security versus lifestyle inflation consuming entire amount leaving zero wealth demonstrating redirection critical not merely achieving freedom but maintaining discipline utilizing benefits.

    How do I stay motivated during the debt-free journey?
    Use victory celebrations, visual progress tracking, accountability partnerships, and regular future-state visualization maintaining 18-36 month commitment: Motivation strategies—Victory celebrations: Small rewards ($25-50) each debt eliminated, medium celebration (nice dinner $75) halfway point, planned significant celebration ($200-500 budgeted) at final debt freedom creating positive reinforcement milestones preventing burnout. Visual progress tracking—Debt thermometer showing declining balance posted prominently, cross-off list eliminating accounts, countdown calendar showing days/months until projected freedom creating daily visual reminder and tangible progress. Accountability system—Share commitment and progress with spouse/partner requiring joint agreement and mutual encouragement, join debt-free online community (Reddit r/DaveRamsey, Facebook groups) posting updates receiving support, accountability partner (friend, family) checking in monthly reviewing progress preventing isolation and private abandonment. Future state visualization—Monthly review of debt-free vision (what will do with liberated payments), calculate investment growth from redirected payments ($800 monthly = $195,000 in 20 years), envision stress-free life without payment obligations creating aspirational pull. Interest savings tracking—Calculate cumulative interest saved versus minimum-only approach showing $5,000+ saved typically through aggressive elimination creating mathematical validation, run projection showing total paid under current plan versus perpetual minimums ($25,000 versus $85,000) reinforcing commitment value. Milestone focus—Break journey into quarterly goals (eliminate 2 debts this quarter) making 24-month timeline manageable through 3-month increments, celebrate quarter completions maintaining momentum. Challenge periods—Expect motivation dips months 6-12 (middle fatigue), combat through vision review, progress celebration, community engagement, temporary intensity increase (extra side gig hours) creating renewed energy. Intensity variation—Allow 80/20 approach (80% months aggressive payments, 20% months moderate when needed for sustainability) preventing burnout while maintaining overall trajectory, temporary payment reduction acceptable during emergencies or major stress if resume quickly. Key: Motivation ebbs and flows naturally, systematic strategies (celebrations, tracking, accountability) maintain commitment through low periods enabling completion versus relying on constant enthusiasm creating abandonment when motivation wanes.

    Should I invest while paying off debt or focus exclusively on debt?
    Depends on debt type and interest rates: Pause investing for high-interest consumer debt (over 8-10% APR), maintain employer match on 401k during elimination, resume full investing after debt-free: General framework—High-interest debt (credit cards 15-25%, personal loans 12-20%): Stop ALL investing beyond employer match, attack debt aggressively saving guaranteed 15-25% “return” through interest elimination exceeding stock market expected returns. Moderate-rate debt (6-10% APR): Consider continuing modest investing (5% income) while attacking debt, acceptable trade-off. Low-rate debt (under 6% like mortgages, some student loans): Continue normal investing (15% income) while making standard payments, investment returns likely exceed debt costs. Employer match exception—ALWAYS capture full employer 401k match even during debt elimination (50-100% instant return impossible to beat), contribute minimum required for full match, redirect all other investment capacity to debt. Example decision—Have $18,000 credit cards at 20%, $500 monthly available beyond minimums, employer offers 50% match up to 6% salary. Optimal: Contribute 6% salary for match ($300 monthly if $60k income), apply remaining $500 to credit card debt, DON’T contribute beyond match (attacking 20% guaranteed savings more valuable than 8% expected stock returns). Rationale—Paying 20% credit card debt = guaranteed 20% return risk-free, investing in stocks = 8-10% expected return with volatility risk, making debt elimination superior mathematically and risk-wise for high-interest balances. After debt-free— Immediately maximize retirement contributions (15-20% income) making up for elimination period intensity through increased rate, compound returns accelerate quickly creating wealth building momentum. Key insight: Temporary investment pause during high-interest debt elimination (18-30 months typically) costs minimal compound time while saving thousands in guaranteed interest elimination making debt freedom priority over investing until consumer debt eliminated, then aggressive investment restarts capturing long-term compound benefits without high-interest debt drag.

    Explore More in Money Basics

    Disclosure

    This article provides general educational information about debt elimination strategies and debt-free living. Individual debt situations, appropriate methods, elimination timelines, and outcomes vary significantly based on circumstances including total debt, income, expenses, interest rates, and personal discipline. This is not financial advice, guarantee of specific results, or recommendation of specific strategies for all situations. Debt elimination requires sustained commitment and significant behavior changes over 18-36 month timelines typical. Timeline projections assume consistent payments without interruption—actual elimination periods vary based on income stability, emergency disruptions, and commitment maintenance. Interest savings calculations and wealth accumulation comparisons represent typical scenarios with assumptions about payment amounts, investment returns, and sustained discipline—actual results vary substantially. Emergency fund recommendations represent general guidelines—appropriate amounts vary by individual circumstances and risk factors. Some situations may require professional credit counseling, financial advice, or debt management assistance beyond self-directed elimination approaches. Debt-free journey phases and challenges described represent common patterns not universal experiences. Wealth building after debt freedom assumes sustained investment discipline and market returns—investment returns not guaranteed and vary with market conditions. Lifestyle adjustment recommendations represent balanced approaches—individual circumstances may warrant different allocations. Credit card usage after debt freedom carries reaccumulation risks requiring strict discipline and immediate cessation if unable to pay full balances monthly. Job flexibility and career change discussions following debt freedom depend on individual skills, markets, and opportunities not guaranteed by debt-free status alone. Consult qualified financial professionals, credit counselors, or debt advisors for personalized guidance matching individual circumstances, debt compositions, and behavioral readiness. Focus on sustainable long-term behavior changes alongside mechanical debt elimination. Advertisements or sponsored content may appear within or alongside this content. All information presented independently for educational purposes only.

  • 5.9 Debt Consolidation Explained: Should You Combine Your Debt?

    5.9 Debt Consolidation Explained: Should You Combine Your Debt?

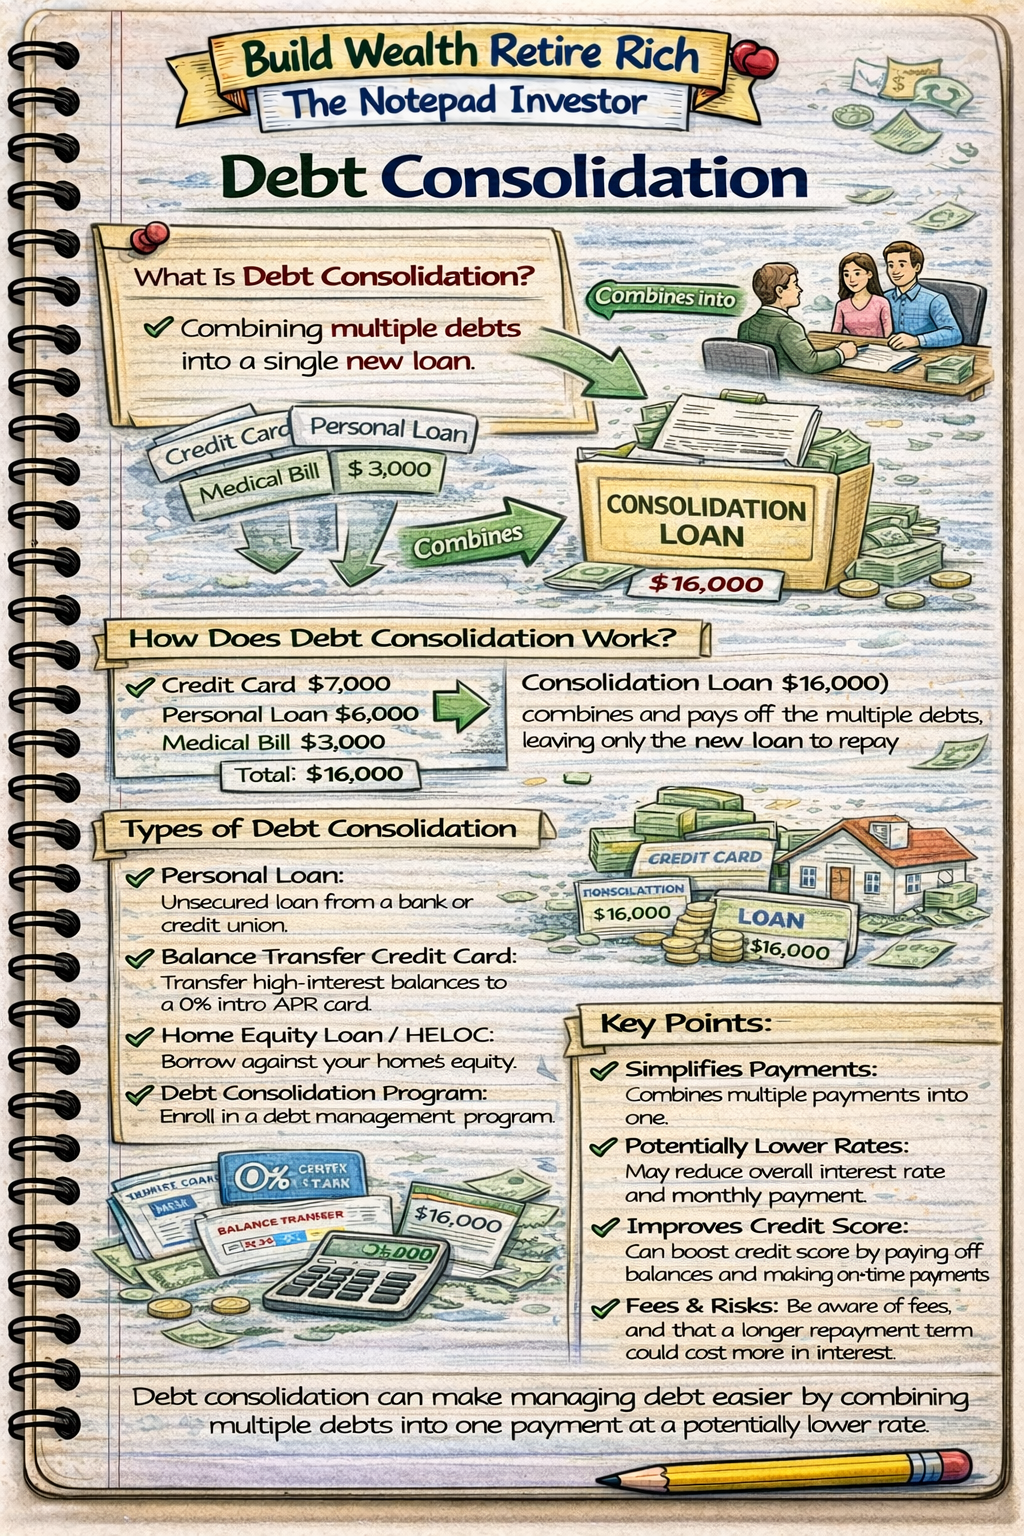
    Debt consolidation is debt management strategy combining multiple debts into single loan with unified payment—typically using personal loan, balance transfer credit card, or home equity loan to pay off scattered high-interest obligations, replacing multiple monthly payments and varying interest rates with one streamlined payment at potentially lower rate. While effective when executed strategically saving $3,000-8,000 in interest on typical $15,000-25,000 consolidated debt through rate reduction from 18-24% credit cards to 8-15% consolidation loans, debt consolidation represents solution addressing symptoms not root causes—consolidating without addressing overspending patterns merely creates temporary relief before reaccumulating debt on cleared credit cards creating double burden of consolidation loan plus new credit card balances, making success dependent on behavioral changes preventing future debt cycles not merely mechanical loan replacement. Understanding consolidation mechanics, appropriate use cases, various product types (personal loans, balance transfers, home equity), hidden costs (origination fees, extended terms, restarted interest clocks), and critical success requirements (closing cleared accounts, budget discipline, addressing spending root causes) determines whether consolidation creates pathway to debt freedom saving thousands through simplified repayment or dangerous trap creating larger problems through cleared credit lines tempting renewed spending impossible without comprehensive consolidation literacy recognizing solution limitations alongside legitimate benefits.

    Notebook sketch explaining personal finance

    This article is designed for anyone considering debt consolidation, individuals overwhelmed by multiple payments and rates wanting simplification, or those evaluating consolidation loan offers from lenders. You do not need financial expertise to understand consolidation—fundamental concept accessible as combining multiple payments into one, though requires honest assessment determining whether multiple debts result from temporary circumstances versus chronic overspending, realistic evaluation of discipline preventing cleared credit card reuse, and comprehensive cost analysis ensuring consolidation actually improves situation not merely shifts debt while adding fees creating worse outcome than maintaining current payments, making consolidation decision requiring behavioral honesty alongside mathematical calculation impossible when viewing as magical debt elimination versus strategic restructuring requiring sustained commitment preventing future accumulation.

    Understanding debt consolidation matters because appropriate consolidation saves $3,000-10,000 interest through rate reduction while simplifying payments reducing missed payment risks, inappropriate consolidation costs $5,000-15,000 additional through origination fees and extended terms while creating double-debt trap from cleared account reuse, and strategic selection among consolidation products (personal loan versus balance transfer versus home equity) determines total costs and foreclosure risks—while consolidation-literate individuals use strategic restructuring as component of comprehensive debt elimination plan combining rate reduction with budget discipline and account closure preventing reuse, versus irresponsible consolidators viewing as debt elimination without behavior change perpetuating cycles through cleared account spending creating $30,000+ debt from original $15,000 through successive consolidation-and-reaccumulation rounds impossible to escape without understanding consolidation limitations requiring root cause resolution alongside mechanical loan replacement.

    Educational disclaimer: This article provides general educational information about debt consolidation strategies and products. Individual consolidation suitability, rates, terms, and outcomes vary significantly based on circumstances including credit, income, debt types, and lender. This is not financial advice or recommendation of specific consolidation approaches or products. Consolidation carries risks including origination fees, extended repayment terms, home foreclosure risk (if using home equity), and potential debt reaccumulation if spending patterns unchanged. Some debt types ineligible for consolidation. Tax implications vary by product type. Consult qualified financial professionals or credit counselors for personalized guidance matching individual situations.

    Debt Consolidation Fundamentals

    What Consolidation Is and Isn’t

    What consolidation IS:

    • Combining multiple debts into single loan with one payment
    • Potentially lowering average interest rate through product selection
    • Simplifying payment management reducing missed payment risks
    • Creating fixed repayment timeline (versus revolving credit perpetuation)
    • Strategic debt restructuring as component of elimination plan

    What consolidation IS NOT:

    • Debt elimination or forgiveness (still owe full amount plus interest)
    • Magical solution fixing overspending root causes
    • Automatic guarantee of lower rates or payments
    • Risk-free—carries costs, risks, and requires discipline
    • Substitute for budget discipline and spending behavior change

    How Consolidation Works

    Basic consolidation process:

    Step 1: Inventory all debts

    • List every debt with balance, APR, minimum payment
    • Calculate total debt amount
    • Determine weighted average current APR
    • Example: Credit card A $5,000 at 22%, Credit card B $8,000 at 19%, Credit card C $3,000 at 24% = $16,000 total at 20.6% weighted average

    Step 2: Obtain consolidation loan

    • Apply for personal loan, balance transfer, or home equity product
    • Qualify based on credit, income, debt-to-income ratio
    • Receive loan proceeds ($16,000 in example)

    Step 3: Pay off original debts

    • Use loan proceeds to pay all consolidated debts to $0
    • Verify zero balances on all paid accounts
    • Obtain written confirmation of payoff

    Step 4: Make single consolidated payment

    • One monthly payment to consolidation lender
    • Fixed rate and term (typically 24-60 months)
    • Structured repayment timeline versus revolving minimums

    Consolidation Benefits When Used Appropriately

    Interest rate reduction:

    • Replace 18-24% credit cards with 8-15% loan
    • Save $2,000-5,000 interest on $15,000 debt over typical term
    • Example: $15,000 at 20% over 48 months = $18,200 total versus same at 12% = $16,800 total, saves $1,400

    Payment simplification:

    • Replace 5 separate payments with 1 unified payment
    • Single due date reducing missed payment risk
    • Easier budgeting and tracking
    • Reduced mental burden from payment juggling

    Fixed repayment timeline:

    • Defined payoff date (versus perpetual revolving minimums)
    • Cannot add new charges to closed-end loan
    • Forced structured elimination
    • Example: 48-month loan = debt-free in 4 years guaranteed if payments maintained

    Potential payment reduction:

    • Lower rate plus extended term can reduce monthly payment
    • Frees cash flow for emergency fund or other goals
    • Warning: Extended terms increase total interest despite lower payments
    Advertisement

    Financial Wellness Planner

    Types of Debt Consolidation Products

    Personal Consolidation Loans

    How personal loans work:

    • Unsecured installment loan from bank, credit union, or online lender
    • Fixed amount, fixed rate, fixed term (24-84 months typical)
    • Proceeds deposited to account, borrower pays off debts
    • Single monthly payment to lender until fully repaid

    Personal loan rates and terms:

    • Excellent credit (740+): 8-12% APR typical
    • Good credit (670-739): 12-18% APR
    • Fair credit (620-669): 18-24% APR
    • Poor credit (below 620): 24-36% or denied
    • Loan amounts: $1,000-$50,000 typical
    • Terms: 24-60 months most common

    Personal loan fees:

    • Origination fee: 1-8% of loan amount
    • Example: $15,000 loan with 5% fee = $750 deducted from proceeds
    • Receive $14,250, repay $15,000 plus interest
    • Prepayment penalties: Some lenders charge early payoff fees
    • Late payment fees: $25-40 typical

    Personal loan consolidation example:

    • Current debt: $18,000 across 4 cards at 20% average, $540 minimums
    • Consolidation: $18,000 personal loan at 12%, 48 months, 5% origination fee
    • Fee: $900 (reducing proceeds to $17,100, need $900 from savings to fully pay debts)
    • New payment: $474 monthly (lower than $540 minimums)
    • Total paid: $22,752 + $900 fee = $23,652
    • Original path (minimums): Would pay $35,000+ over 12+ years
    • Savings: $11,000+ through consolidation assuming no reuse of cards

    Personal loan advantages:

    • No collateral required (no foreclosure risk)
    • Fixed rate and payment (predictable budgeting)
    • Defined payoff timeline
    • Often lower rates than credit cards

    Personal loan disadvantages:

    • Origination fees reduce net savings
    • Rates depend heavily on credit score
    • Some lenders charge prepayment penalties
    • Doesn’t address spending behavior

    Balance Transfer Credit Cards

    How balance transfers work:

    • Transfer existing credit card balances to new card with promotional 0% APR
    • Promotional period: 12-21 months typical
    • Transfer fee: 3-5% of transferred amount
    • After promotion: Reverts to regular APR (15-25% typical)

    Balance transfer example:

    • Current: $12,000 across 3 cards at 21% average
    • Transfer: To 0% card for 18 months with 3% fee
    • Fee: $360 (3% of $12,000)
    • Payment plan: $12,360 ÷ 18 months = $687 monthly required
    • Payoff: Completely eliminated in 18 months
    • Total cost: $12,360 ($12,000 + $360 fee)
    • Original path: $12,000 at 21% paying $687 monthly = $14,820 total (30 months)
    • Savings: $2,460 through balance transfer

    Balance transfer advantages:

    • 0% APR during promotion (all payments attack principal)
    • Massive interest savings if paid during promotion
    • No origination fee (just 3-5% transfer fee)
    • Can keep original cards open (credit utilization benefit)

    Balance transfer disadvantages and risks:

    • Must pay off before promotion ends (reverts to 18-25% APR)
    • Requires good credit for approval (670+ typically)
    • New purchases usually no grace period (accrue interest immediately)
    • Payments applied to 0% balance first (new purchases accrue interest)
    • Late payment can cancel promotion immediately
    • Temptation to use old cards creating double debt

    Home Equity Loans and HELOCs

    Home equity loan (second mortgage):

    • Lump sum loan secured by home equity
    • Fixed rate and payment (7-11% typical currently)
    • Terms: 10-30 years
    • Borrow up to 85% of home equity typically

    HELOC (Home Equity Line of Credit):

    • Revolving credit line secured by home
    • Variable rate (7-11% typical)
    • Draw period: 10 years typically
    • Repayment period: 10-20 years after draw period

    Home equity consolidation example:

    • Current debt: $25,000 credit cards at 20% average
    • Home equity: $100,000 available (home worth $400,000, mortgage $200,000)
    • HELOC: Borrow $25,000 at 8.5% variable
    • Pay off all credit cards with HELOC proceeds
    • New payment: $300 monthly (10-year repayment)
    • Total paid: $36,000 versus $50,000+ on credit cards
    • Savings: $14,000+

    Home equity advantages:

    • Lowest rates available (secured by home)
    • Largest amounts available (based on home equity)
    • Potential tax deductibility of interest (consult tax professional)
    • Extended repayment reducing monthly payment

    Home equity CRITICAL RISKS:

    • FORECLOSURE RISK: Home is collateral, default = lose house
    • Transforms unsecured debt into secured debt risking shelter
    • Using home equity for consumption debt extremely risky
    • If reaccumulate credit cards, face BOTH home payment AND new debt
    • Home value decline creates underwater scenario
    • Generally NOT recommended for credit card consolidation

    Debt Management Plans (Credit Counseling)

    How DMPs work:

    • Nonprofit credit counseling agency negotiates with creditors
    • Reduced interest rates (often 8-12% versus 18-25%)
    • Waived fees and penalties
    • Single payment to agency, they distribute to creditors
    • Typically 3-5 year programs

    DMP requirements:

    • Close enrolled credit card accounts
    • No new credit while in program
    • Monthly counseling fee: $25-50 typical
    • Setup fee: $0-50

    DMP advantages:

    • No loan or credit check required
    • Reduced rates through creditor agreements
    • Professional support and education
    • Enforced discipline (automatic payments)

    DMP disadvantages:

    • Noted on credit report (not as damaging as default but visible)
    • Requires account closures
    • Monthly fees add cost
    • Not all creditors participate

    When Consolidation Makes Sense

    Good Consolidation Scenarios

    Scenario 1: High-rate debt with good credit

    • Situation: $20,000 credit cards at 22% average, credit score 720+
    • Solution: Personal loan at 10% or balance transfer at 0%
    • Result: Save $4,000-6,000 in interest
    • Requirements: Income stable, won’t reuse cards, disciplined repayment

    Scenario 2: Overwhelming payment juggling

    • Situation: 6+ separate debts, different due dates, missing payments occasionally
    • Solution: Consolidation creating single payment date
    • Result: Simplified management, avoid late fees and score damage
    • Even if rate similar, payment simplification valuable

    Scenario 3: Temporary hardship recovery

    • Situation: Accumulated debt during job loss/medical crisis, now employed
    • Solution: Consolidate at lower rate, structured payoff timeline
    • Result: Predictable path to debt freedom, fresh start
    • Critical: Hardship resolved, won’t reaccumulate

    Scenario 4: Variable rate to fixed rate

    • Situation: Mostly credit card debt at variable 18-24% APR
    • Solution: Fixed-rate personal loan locking rate
    • Result: Protection from rate increases, predictable budgeting

    Poor Consolidation Scenarios

    Red flag scenario 1: Chronic overspending

    • Pattern: Spend more than earn monthly, balances growing continuously
    • Danger: Consolidation clears cards enabling more spending
    • Likely outcome: $15,000 consolidation loan PLUS $15,000 new cards = $30,000 total debt
    • Solution needed: Budget correction first, then maybe consolidation

    Red flag scenario 2: Previous consolidation failures

    • Pattern: Consolidated before, reaccumulated debt, considering again
    • Danger: Behavioral pattern unchanged, will repeat cycle
    • Likely outcome: Third consolidation creating $40,000+ from original $10,000
    • Solution needed: Professional counseling, root cause resolution

    Red flag scenario 3: Using home equity for unsecured debt

    • Pattern: $15,000 credit cards, considering HELOC consolidation
    • Danger: Transform dischargeable unsecured debt into foreclosure risk
    • Likely outcome: Lose home if unable to maintain payments or reaccumulate
    • Solution: Personal loan or balance transfer instead, preserve home safety

    Red flag scenario 4: High fees negating savings

    • Pattern: $8,000 debt at 19%, considering loan at 17% with 8% origination
    • Danger: $640 fee plus minimal rate reduction = no real savings
    • Calculation: 2% rate improvement offset by 8% upfront cost = worse outcome
    • Solution: Aggressive payment on current debt or better consolidation option

    Consolidation Decision Framework

    Ask these critical questions:

    1. Why do I have this debt?

    • One-time emergency/hardship: Consolidation may help
    • Chronic overspending: Fix behavior first

    2. Have I addressed the root cause?

    • Budget balanced, spending under income: Proceed
    • Still spending more than earning: Don’t consolidate yet

    3. Will consolidation actually save money?

    • Calculate: Total cost with consolidation versus without
    • Include ALL fees, extended term costs, potential reaccumulation
    • If saves $2,000+: Worth considering
    • If saves under $500: Probably not worth risk/effort

    4. Can I avoid reusing cleared accounts?

    • Honest assessment: Will close or freeze cards?
    • If uncertain: Consolidation premature

    5. Do I qualify for beneficial rates?

    • Credit 670+: Likely qualify for worthwhile rates
    • Credit under 620: Rates may not improve situation
    Advertisement
    Reserved space for in-content ad

    Consolidation Success Requirements

    Requirement 1: Close or Freeze Paid-Off Accounts

    Critical action after consolidation:

    • Close paid-off credit cards OR freeze preventing use
    • Remove from wallet and delete saved payment info online
    • Only exception: Keep 1-2 oldest cards for credit history (frozen/unused)

    Why this matters:

    • Prevents double-debt trap (consolidation loan PLUS new card balances)
    • Removes temptation during weak moments
    • Forces lifestyle adjustment to actual income

    Account management strategy:

    • Close: Store cards, newest cards, high-fee cards
    • Keep frozen: 1-2 oldest cards for credit history length
    • Freeze method: Cut up cards, call requesting account freeze, remove from all online merchants

    Requirement 2: Budget Discipline and Behavior Change

    Essential budget work:

    • Track spending revealing where money actually goes
    • Identify and eliminate discretionary overspending
    • Align monthly spending with monthly income
    • Build $1,000 emergency buffer preventing reactive charging

    Behavioral changes required:

    • Cash/debit only for discretionary spending
    • Envelope budgeting for problem categories
    • Delay major purchases (30-day rule preventing impulse buying)
    • Address emotional spending triggers

    Requirement 3: Aggressive Repayment Mindset

    Don’t just make minimums on consolidation loan:

    • Consolidation creates opportunity, not finish line
    • Pay extra when possible accelerating elimination
    • Apply windfalls (tax refunds, bonuses) to principal
    • Maintain urgency preventing complacency

    Repayment acceleration example:

    • Consolidation: $18,000 at 12%, 60 months, $400 monthly
    • Standard payoff: 60 months, $24,000 total
    • Aggressive $600 monthly: 36 months, $21,600 total
    • Saves: $2,400 and 24 months through extra payments

    Requirement 4: Emergency Fund Priority

    Build buffer preventing re-accumulation:

    • Save $1,000 starter emergency fund while paying debt
    • Prevents reactive charging for car repairs, medical, etc.
    • After debt-free, expand to 3-6 months expenses

    Emergency fund prevents this scenario:

    • Consolidated debt, closed cards, making progress
    • $800 car repair needed, no emergency fund
    • Forced to reopen credit card or take high-interest loan
    • Cycle restarts through lack of buffer

    Consolidation Costs and Pitfalls

    Hidden Costs to Calculate

    Origination fees:

    • Personal loans: 1-8% of loan amount
    • $20,000 loan with 5% fee = $1,000 cost upfront
    • Deducted from proceeds or added to balance
    • Reduces net interest savings significantly

    Balance transfer fees:

    • 3-5% of transferred amount
    • $15,000 transfer with 3% fee = $450
    • Must be paid off during 0% period to maximize savings

    Extended term costs:

    • Lower monthly payment through 60-84 month terms
    • Dramatically increases total interest despite lower rate
    • Example: $18,000 at 12%—36 months = $21,340 total, 72 months = $24,560 total
    • Extended term costs $3,220 more despite “affordable” payment

    Prepayment penalties:

    • Some lenders charge fee for early payoff
    • 2-5% of remaining balance typical
    • Prevents acceleration, locks borrower into full term
    • Avoid lenders with prepayment penalties when possible

    The Double-Debt Trap

    Most common consolidation failure pattern:

    Step 1: Initial consolidation

    • Have $15,000 across 4 credit cards
    • Take $15,000 personal loan at 12%, pay off all cards
    • New payment: $334 monthly for 60 months

    Step 2: Cleared cards tempt spending

    • Cards show $0 balances, limits restored
    • “Can afford small charges” thinking
    • Gradual reaccumulation over 12-18 months

    Step 3: Double debt crisis

    • Still owe $12,000 on consolidation loan (36 months remaining)
    • Reaccumulated $8,000 across credit cards
    • Total debt: $20,000 (versus original $15,000)
    • Payments: $334 loan + $240 card minimums = $574 monthly
    • Worse position than before consolidation

    Step 4: Desperate second consolidation

    • Try consolidating again: $20,000 new loan
    • Higher rate (credit damaged): 16% versus original 12%
    • Cycle continues if behavior unchanged

    Prevention:

    • Close or freeze ALL paid-off accounts immediately
    • Address spending behavior before consolidating
    • Maintain emergency fund preventing reactive charging

    Consolidation vs Aggressive Payoff Comparison

    Scenario: $18,000 debt at 20% average

    Option A: Consolidate to 12% loan, maintain similar payment

    • Loan: $18,000 at 12%, 60 months, $400 monthly
    • Total paid: $24,000
    • Timeline: 60 months
    • Risk: Card reuse creating double debt

    Option B: Keep current debt, aggressive payments

    • Current: $18,000 at 20%, pay $800 monthly (versus $540 minimums)
    • Total paid: $21,600
    • Timeline: 30 months
    • Benefit: Half the time, $2,400 less, no consolidation fees, no reuse risk

    Option C: Consolidate AND aggressive payments (best outcome)

    • Consolidate to 12%, pay $800 monthly
    • Total paid: $19,800
    • Timeline: 26 months
    • Best: Lowest cost, fastest timeline, rate benefit PLUS aggressive payoff

    Key insight: Consolidation alone not optimal—must combine with aggressive payments

    Advertisement
    Reserved space for in-content ad

    Why Understanding Debt Consolidation Matters

    Without understanding debt consolidation, individuals either miss legitimate savings opportunities ($3,000-8,000 potential through appropriate rate reduction and strategic selection) or fall into double-debt traps creating $30,000+ from original $15,000 through cleared account reuse, lack framework evaluating when consolidation beneficial versus when aggressive payment on current debt superior avoiding fees and risks, and either avoid beneficial consolidation fearing complexity or pursue inappropriate consolidation without addressing root overspending creating worse outcomes—while consolidation-literate individuals use strategic restructuring as component of comprehensive elimination plan saving thousands through rate optimization while implementing behavioral changes preventing reaccumulation, versus irresponsible consolidators viewing as magical debt elimination perpetuating cycles through cleared card spending creating impossible situations impossible to escape without understanding consolidation represents mechanical restructuring not behavioral solution requiring discipline and root cause resolution alongside loan replacement.

    Understanding debt consolidation enables individuals to:

    • Calculate true costs including origination fees and extended term impacts
    • Evaluate appropriate timing ensuring overspending addressed before consolidating
    • Select optimal consolidation product (personal loan vs balance transfer vs DMP)
    • Recognize when aggressive current debt payment superior to consolidation
    • Implement critical success requirements (account closure, budget discipline, emergency fund)
    • Avoid double-debt trap through cleared account management
    • Combine consolidation with aggressive repayment maximizing benefits

    Debt consolidation knowledge transforms debt management from reactive loan-seeking into strategic informed evaluation weighing benefits against risks, recognizing consolidation as tool not solution requiring behavioral foundation, and preventing common pitfalls creating worse situations through cleared account temptation impossible without comprehensive understanding enabling appropriate strategic use when genuinely beneficial versus recognition when premature or unnecessary.

    Common Misunderstandings

    Many people view debt consolidation as debt elimination believing consolidated debt somehow disappears or becomes less serious. In reality, consolidation merely restructures existing debt into different format—still owe full original amount plus interest (often more interest through extended terms despite lower rates), making consolidation mechanical reorganization not magical elimination proving debt remains requiring full repayment through sustained discipline regardless of consolidation status not shortcut avoiding payment obligations through loan replacement.

    Another common misconception is consolidation always reduces monthly payments and total costs. In practice, consolidation often increases total paid through extended terms and origination fees—$18,000 at 20% paying $540 minimums = $35,000+ total over 12+ years, consolidate to 12% over 72 months = $27,600 total (saves $7,400) BUT aggressive $800 monthly on original debt = $21,600 total in 30 months (saves $5,800 versus consolidation), proving consolidation without aggressive payment creates mediocre outcomes versus optimal combination of rate reduction PLUS payment acceleration or aggressive original debt payment without consolidation fees.

    Some believe closing paid-off credit cards after consolidation damages credit scores making account closure inadvisable. However, keeping open zero-balance accounts creates reaccumulation temptation destroying consolidation benefits—credit score temporary 20-30 point dip from closures far preferable to $15,000 reaccumulated debt from open accounts creating $30,000 total burden, proving account closure essential success requirement despite modest score impact making reuse prevention priority over credit score optimization when consolidating demonstrating behavioral protection more valuable than maintaining perfect scores enabling renewed spending.

    How Consolidation Understanding Fits Into Financial Success

    Debt consolidation understanding enables strategic use of restructuring tools saving $3,000-10,000 interest through appropriate rate reduction when behavioral foundation established, prevents double-debt traps costing $15,000-30,000 through cleared account reuse by recognizing consolidation as component not complete solution, and provides framework distinguishing scenarios where consolidation beneficial versus where aggressive current debt payment superior avoiding unnecessary fees and risks—making consolidation literacy essential component of debt elimination requiring honest behavioral assessment ensuring overspending addressed before consolidating, comprehensive cost calculation including all fees and extended term impacts, and disciplined post-consolidation management through account closure and emergency fund preventing reaccumulation, transforming consolidation from feared complexity or false salvation into understood strategic tool appropriately deployed when genuinely beneficial impossible without recognizing both legitimate optimization opportunities and critical success requirements preventing common failure patterns.

    For example, two individuals both age 38 with $22,000 credit card debt at 21% average across 5 cards. Person A hears about consolidation, applies for $22,000 personal loan receiving approval at 14% over 60 months with 6% origination fee ($1,320), pays off all cards with loan proceeds. Month 1-6: Makes $518 monthly loan payment, feels relief from simplified single payment versus 5 previous payments, credit cards show zero balances. Month 7-18: Gradually reuses cards for “emergencies” and conveniences without tracking, accumulates $8,000 across 3 reopened cards. Month 19: Realizes problem, now has $18,500 consolidation loan remaining PLUS $8,000 credit cards = $26,500 total (versus $22,000 original). Payments $518 loan + $240 card minimums = $758 monthly creating financial strain. Age 43 (5 years later): Attempted second consolidation but denied due to debt-to-income ratio, still carrying $15,000 across loan and cards, paid $46,000 total over 5 years ($518 × 60 = $31,080 loan plus $15,000 card payments) yet $15,000 debt remains from perpetual reaccumulation cycle. Person B understands consolidation requirements, first addresses root overspending identifying $400 monthly discretionary cuts, builds $1,000 emergency fund over 3 months, then consolidates $22,000 to balance transfer card 0% for 18 months with 3% fee ($660). Immediately closes 3 newest cards, freezes 2 oldest preventing use. Calculates required payment: $22,660 ÷ 18 = $1,259 monthly required for complete elimination during 0% period. Implements aggressive plan: $400 discretionary cuts + $600 side gig (DoorDash 15 hours weekly) + $300 from previous minimums = $1,300 monthly payment. Month 18: Completely debt-free, paid $23,400 total ($22,000 + $660 fee + $740 remaining interest). Continues $1,300 monthly into investments building wealth. Age 43 (5 years later): Invested $1,300 monthly for 4.5 years (54 months) at 8% return = $93,000 accumulated. Difference: Person A’s consolidation without behavioral change created $15,000 remaining debt plus $46,000 paid with zero wealth = $61,000 hole, Person B’s strategic consolidation with behavior change and aggressive repayment created $93,000 wealth demonstrating $154,000 outcome difference from understanding consolidation as restructuring tool requiring behavioral foundation not magical solution creating superior outcomes through account closure, spending discipline, and aggressive payment impossible without comprehensive consolidation literacy recognizing critical success requirements preventing double-debt trap.

    Debt consolidation understanding separates strategic restructurers optimizing rates while maintaining discipline from failed consolidators creating worse situations through behavioral neglect, requiring both mechanical comprehension and honest self-assessment determining readiness creating dramatically different outcomes impossible without consolidation literacy.

    Recent Updates and Trends

    In recent years, online personal loan marketplaces have proliferated simplifying consolidation product comparison and application, though fundamental evaluation requirements unchanged with borrowers still needing comprehensive cost analysis including origination fees and extended term impacts regardless of application convenience making technology enhancing access not changing strategic decision-making framework determining appropriate consolidation use.

    Balance transfer promotional periods have shortened from 18-21 months typical to 12-18 months more common requiring more aggressive monthly payments for complete elimination during 0% window, though strategic value unchanged with borrowers able to capture substantial savings through disciplined payoff before promotion expires making compressed timelines requiring payment discipline not eliminating consolidation benefit when executed properly.

    Debt consolidation marketing has intensified with lenders aggressively targeting indebted consumers through digital advertising creating awareness but also potential for inappropriate consolidation by borrowers lacking behavioral readiness, though fundamental consolidation principles unchanged requiring honest overspending assessment before pursuing regardless of marketing convenience or lender encouragement making strategic evaluation essential despite increased product accessibility.

    Credit counseling agencies and debt management plans have gained legitimacy through nonprofit certification standards (NFCC, FCAA) improving consumer protection, though DMP enrollment still appears on credit reports creating visibility concerns for some borrowers making alternative consolidation products potentially preferable when qualifying based on credit and income despite DMP legitimate benefits for appropriate candidates.

    Fundamental consolidation principles remain timeless: combine multiple debts into single payment potentially reducing rates and simplifying management, requires behavioral changes preventing cleared account reuse, must include comprehensive cost analysis evaluating all fees and extended term impacts, and works best when combined with aggressive repayment not merely minimum payments—regardless of marketplace proliferation, promotional period changes, marketing intensity, or counseling improvements, understanding consolidation as restructuring tool requiring behavioral foundation alongside mechanical loan replacement produces optimal outcomes through strategic appropriate use preventing common pitfalls impossible without comprehensive literacy recognizing both benefits and critical success requirements.

    3 Things You Can Do Today

    Ready to evaluate debt consolidation strategically? Here are three simple steps you can take right now:

    1. Calculate total consolidation costs versus aggressive current debt payment determining if consolidation actually beneficial – List all debts: Balances, APRs, current minimum payments (example: Card A $6,000 at 22%, Card B $8,500 at 19%, Card C $4,200 at 24%, total $18,700 averaging 21.3%). Current path calculation: Use debt calculator entering all debts with total available monthly payment determining timeline and total paid (example: $700 monthly on current debts = 36 months, $25,200 total paid). Consolidation option research: Get actual rates from 2-3 lenders based on credit score, note origination fees, calculate total cost (example: $18,700 loan at 12% over 48 months with 5% fee = $935 fee + $22,100 paid = $23,035 total including fees). Aggressive current payment alternative: Calculate total if simply increase payments on current debt without consolidating (example: $1,000 monthly on current debts = 22 months, $22,000 total, no fees). Compare three scenarios: Current minimums $25,200 over 36 months, Consolidation $23,035 over 48 months (saves $2,165 but 12 months longer), Aggressive current $22,000 over 22 months (best: saves $3,200 versus consolidation, 26 months faster). Consolidation + aggressive option: Calculate consolidation with aggressive payment (example: $18,700 at 12%, pay $1,000 monthly = 20 months, $19,700 total, best outcome if can sustain). Decision framework: If consolidation saves $2,000+ versus current path AND can prevent card reuse through closures = worth considering. If aggressive current payment achieves similar or better outcome = skip consolidation avoiding fees and risks. If cannot sustain aggressive payments making consolidation enabling lower monthly payment while still providing progress = acceptable trade-off. Write comparison: “Current path: $X over Y months. Consolidation: $A over B months (saves/costs $C). Aggressive current: $D over E months (best outcome). Decision: [Consolidate/Aggressive current/Status quo] based on analysis.” Takes 30 minutes creating data-driven decision preventing emotion-based consolidation when inappropriate or missing opportunity when genuinely beneficial.

    2. Complete honest behavioral assessment determining if overspending addressed before consolidating preventing double-debt trap – Answer critical questions truthfully: (1) Why do I have this debt? One-time emergency/hardship now resolved OR chronic spending exceeding income ongoing? (2) Review last 6 months spending: Is monthly spending less than monthly income creating surplus OR still spending more than earning each month? (3) Have I created and followed budget for minimum 3 months demonstrating discipline OR still ad-hoc spending without tracking? (4) Can I commit to closing/freezing ALL paid-off credit cards permanently OR need to keep them “just in case” indicating behavioral unreadiness? (5) Have I built $1,000 starter emergency fund preventing reactive charging OR no buffer creating vulnerability to forced card use? (6) Have I previously consolidated debt and reaccumulated OR first consolidation attempt? Score assessment: Answer favorably to 5-6 questions (hardship resolved, budget established, spending under income, willing to close cards, emergency fund built, no previous failures) = READY for consolidation with high success probability, proceed with confidence. Answer favorably to 3-4 questions = MARGINAL readiness, address remaining issues before consolidating or risk moderate reaccumulation probability. Answer favorably to 0-2 questions = NOT READY, consolidation premature creating high reaccumulation risk resulting in double-debt trap, address overspending and build behavioral foundation 6-12 months before reconsidering. Behavioral foundation building if not ready: Create zero-based budget allocating every dollar, track spending 90 days revealing patterns, cut discretionary spending $300-500 monthly, save $1,000 emergency fund, practice 30-day purchase delay rule. Reassess readiness: After 6 months behavioral work, retake assessment determining if consolidation timing improved. Write assessment: “Behavioral readiness: [Ready/Marginal/Not ready]. Issues remaining: [List]. Timeline: [Proceed now/Address issues 3 months/Build foundation 6-12 months].” Takes 20 minutes creating honest evaluation preventing premature consolidation when behavioral foundation absent creating failure probability versus recognizing readiness enabling successful consolidation when foundation established.

    3. If consolidating, create account closure and reuse prevention plan executing immediately after payoff – List all accounts being paid off through consolidation: Note which newest (close these), which oldest (potentially keep frozen for credit history). Account closure decisions: Close completely—Store cards, newest cards (under 2 years old), any cards with annual fees not justified by benefits, cards with highest previous balances indicating problem spending. Keep frozen—Maximum 1-2 oldest cards (5+ years old) for credit history length maintenance, must freeze preventing use. Closure execution plan: Day consolidation funds disburse paying cards to zero, call each card being closed requesting permanent account closure, obtain written confirmation of closure within 30 days, verify closures on credit report within 60 days. Freeze execution plan: For cards kept for history, call requesting account freeze or spending block, physically destroy cards cutting into pieces, delete saved card information from all online retailers and subscription services, notify spouse/family members card unavailable preventing authorized user charges. Physical prevention: Remove all credit cards from wallet including frozen ones (keep at home in safe or frozen in ice block creating access friction), delete card details from phone payment apps, unsubscribe from credit card marketing emails preventing reapplication temptation. Alternative payment method: Switch to debit card or cash for all discretionary spending, keep single debit card in wallet, use cash envelope system for problem categories (dining, entertainment, shopping), commit to 90-day credit-free period proving discipline. Emergency backup: If genuinely concerned about emergency access despite building $1,000 fund, keep one frozen card locked in safe with written rule “Use only for expenses over $500 that emergency fund cannot cover, must repay within 30 days” creating accountability. Accountability: Inform spouse/partner/trusted friend of consolidation and closure plan creating external accountability, schedule 30-day check-in reviewing spending and card closure compliance, join debt-free community for ongoing support. Write plan: “Closing: [List cards]. Keeping frozen: [List cards]. Execution date: [When consolidation funds]. Alternative payment: [Debit/Cash/Envelopes]. Emergency protocol: [Plan]. Accountability partner: [Name].” Takes 30 minutes creating systematic reuse prevention impossible without explicit plan executing immediately preventing gradual drift toward card reactivation destroying consolidation benefits.

    These actions create strategic consolidation evaluation and success foundation within 90 minutes—calculated comprehensive costs comparing consolidation versus alternatives determining if genuinely beneficial ($2,165 savings example) or if aggressive current payment superior ($3,200 savings alternative), completed honest behavioral readiness assessment preventing premature consolidation when overspending unaddressed (Ready/Marginal/Not ready determination), and created explicit account closure and reuse prevention plan executing immediately protecting consolidation benefits—transforming consolidation from vague debt solution into informed strategic decision with systematic success infrastructure preventing double-debt trap impossible without comprehensive cost analysis, honest self-assessment, and disciplined post-consolidation management.

    Quick FAQ

    Does debt consolidation hurt my credit score?
    Temporary modest impact (10-30 points typical) from hard inquiry and potential account closures, but long-term neutral or positive if managed well: Short-term impacts—Hard inquiry from loan application drops score 5-10 points (recovers within 6 months), closing paid-off accounts reduces available credit increasing utilization potentially dropping score 10-20 points, new loan reduces average account age slightly. Long-term benefits IF managed properly—On-time consolidated loan payments build positive history improving score over time, reduced utilization if keeping some cards open with zero balances helps scores, successful elimination improving debt-to-income ratio benefits future credit applications. Long-term damage IF mismanaged—Missed payments on consolidation loan drop scores 60-110 points, reaccumulating debt on cleared cards dramatically increases utilization destroying scores, defaulting on consolidation loan creates 100-150 point drop plus collections. Net impact example: Start 680 score, consolidate dropping to 660-665 initially (inquiry + closures), after 12 months on-time payments recover to 670-680, after 24 months successful payoff potentially 690-710 from reduced debt and positive history. Comparison: Consolidation score impact minimal versus continuing to struggle with multiple debts missing payments occasionally (each 30-day late = 60-110 point drop), making consolidation score-neutral or beneficial when executed properly versus destructive when mismanaged through missed payments or reaccumulation. Key: Score dip temporary and modest, focus should be debt elimination not score perfection during process, successful consolidation completion produces better long-term scores than perpetual minimum payment struggle.

    Should I use a home equity loan to consolidate credit cards?
    Generally NO except rare circumstances—transforms dischargeable unsecured debt into foreclosure risk not worth savings: Home equity risks—Lose home if cannot maintain payments (job loss, income reduction, unexpected expenses), reaccumulating credit cards creates BOTH home payment AND new debt potentially forcing foreclosure, underwater home value decline traps borrowers, transforms temporary financial stress into shelter loss. When MAYBE acceptable—Massive debt ($40,000+) where personal loan insufficient, extremely disciplined borrower with proven track record, permanent behavior change demonstrated through 12+ months zero credit card use, substantial home equity buffer ($200,000+) protecting against value decline, stable dual income reducing unemployment risk. Better alternatives—Personal consolidation loan (unsecured, no foreclosure risk), balance transfer credit cards (0% interest if disciplined), debt management plan through credit counseling (negotiated rates without home risk), aggressive payment on current debts avoiding consolidation entirely. Example risk scenario: Consolidate $18,000 cards using HELOC, feel relief from $250 monthly payment versus $540 card minimums, gradually reaccumulate $12,000 on cleared cards over 2 years, now owe $15,000 HELOC (home secured) plus $12,000 cards = $27,000 total, lose job unable to maintain both payments, face foreclosure losing $150,000 home equity over debt problem that started at $18,000. Key principle: Never convert unsecured debt (credit cards dischargeable in bankruptcy as last resort) into secured debt risking primary shelter, modest interest savings ($2,000-4,000 typical) not worth catastrophic foreclosure risk making home equity consolidation inappropriate for consumer debt except extremely rare perfect circumstances with massive debt loads and bulletproof discipline.

    How do I avoid reaccumulating debt after consolidation?
    Close or freeze ALL paid-off accounts, build emergency fund, address overspending root causes through budget discipline, and maintain aggressive consolidated loan repayment: Account management—Close completely: newest cards, store cards, any high-fee cards, cards associated with problem spending. Freeze preventing use: maximum 1-2 oldest cards kept for credit history (cut up cards physically, call requesting account freeze, delete from online merchants). Remove temptation: eliminate cards from wallet, delete saved payment information everywhere, unsubscribe from credit marketing emails. Emergency fund building—Save $1,000 starter fund ASAP preventing reactive charging for car repairs, medical, appliances, while paying consolidated debt, expand to 3-6 months expenses after debt-free creating comprehensive protection. Budget discipline implementation—Track every dollar spent for 90 days revealing patterns, create zero-based budget allocating all income, cut discretionary spending to necessities only temporarily, use cash envelopes for problem categories (dining, shopping, entertainment), practice 30-day purchase delay rule preventing impulse buying. Overspending root cause resolution—Identify triggers: emotional spending, lifestyle inflation, keeping up with others, lack of financial goals, address through counseling if needed, create meaningful financial goals (debt freedom, home purchase, retirement) providing motivation resisting temptation. Payment momentum maintenance—Pay extra on consolidation loan when possible accelerating elimination, apply windfalls (tax refunds, bonuses) to principal creating progress motivation, celebrate milestones ($5,000 paid, halfway point, final payment) maintaining engagement. Accountability systems—Inform spouse/partner of consolidation and reuse prevention commitment creating external accountability, join debt-free community (online forum, in-person group) sharing progress and struggles, schedule regular financial check-ins (monthly budget reviews, quarterly progress assessments) maintaining vigilance. Reality: 60-70% of consolidators reaccumulate debt within 36 months when not implementing systematic prevention, versus 10-20% reaccumulation when closing accounts, building fund, and maintaining discipline making prevention infrastructure essential not optional for consolidation success.

    What’s better: balance transfer or personal loan for consolidation?
    Balance transfer if can pay off during 0% promotion (12-21 months) AND good credit (670+) qualifying for approval, personal loan if need longer timeline or moderate credit making transfer difficult: Balance transfer advantages—0% interest during promotion meaning 100% of payments attack principal creating maximum savings, lower fees (3-5% transfer fee versus 3-8% origination), flexible amounts (up to card limits), can keep original cards open benefiting utilization. Balance transfer requirements—Good credit qualifying for approval (670+ typically), discipline paying off before promotion expires (monthly payment = balance ÷ promotional months), no new purchases on transfer card (lose grace period accruing immediate interest), perfect payment record (one late payment can cancel promotion). Balance transfer risks—If not paid during promotion reverts to 18-25% regular APR negating savings, temptation using old cards creating double debt, new purchases on transfer card accrue interest immediately. Personal loan advantages—Fixed rate and term creating predictable timeline (no promotion expiration worry), longer repayment options (24-84 months) reducing payment if needed, available to broader credit range (620+ often qualify), forced discipline through structured installment (cannot add charges). Personal loan disadvantages—Origination fees (3-8%) reducing net benefit, higher interest rates than 0% transfers (8-18% typical), immediate interest accrual from day one. Decision framework—Use balance transfer if: Have $15,000 or less (typical credit limits), can afford aggressive payment during promotion ($12,000 ÷ 18 months = $667 minimum monthly), credit score 670+ qualifying for approval, proven discipline avoiding old card reuse. Use personal loan if: Need longer than 21 months for comfortable payoff, credit below 670 making transfer approval difficult, larger amounts exceeding typical transfer limits ($20,000+), prefer fixed timeline certainty over promotion management. Combination approach: Transfer what qualifies for 0% (up to limits), consolidate remainder with personal loan, creates hybrid capturing both benefits. Example: Have $25,000 total, qualify for $15,000 balance transfer at 0% for 18 months with 3% fee ($450), take $10,000 personal loan at 10% for 36 months, pay $835 transfer + $323 loan = $1,158 monthly eliminating in 18 months (transfer) and 36 months (loan), total cost $15,450 + $11,628 = $27,078 versus $25,000 at 20% over 4 years = $36,000+, saves $8,000+ through strategic combination.

    Can I consolidate federal student loans with other debt?
    Technically possible but strongly NOT recommended—lose irreplaceable federal protections including income-driven repayment, forgiveness options, and deferment/forbearance: Federal loan protections lost through consolidation—Income-driven repayment plans (SAVE, PAYE, IBR) reducing payments to $0-10% discretionary income if income low, Public Service Loan Forgiveness potentially forgiving $50,000-100,000+ after 120 qualifying payments, deferment and forbearance during unemployment or hardship pausing payments without default, death and disability discharge preventing family liability. What happens when consolidating federal loans into personal loan—Transform federal loans into private debt immediately losing ALL protections permanently, become locked into fixed payment regardless of income changes (no income-driven options), lose forgiveness eligibility costing potential $50,000-100,000+ benefit, no deferment options if unemployment or hardship occurs forcing default risk, consolidation lender can sue and garnish wages without federal program protections. When consolidation MIGHT be acceptable—Have only private student loans (already lack federal protections making consolidation not losing anything), refinancing federal loans separately preserving some protections while lowering rate if credit excellent and income stable. Better approach—Keep federal loans separate using federal consolidation if needed (Direct Consolidation Loan preserving protections), consolidate only credit cards and other consumer debt into personal loan, maintain federal loan protections even if means higher overall interest rate recognizing protection value exceeds rate savings. Example risk: Have $30,000 federal loans at 6% plus $15,000 credit cards at 20%, consolidate ALL into $45,000 loan at 10% over 5 years, lose job unable to maintain $955 monthly payment, no income-driven option available (would have dropped federal payment to $0 under SAVE plan), forced into default destroying credit and facing garnishment, versus keeping separate maintaining federal protections dropping to $0 payment during unemployment while aggressively paying only cards. Key: Federal protections worth more than interest savings in vast majority of circumstances making federal loan consolidation into personal loan major mistake for most borrowers except those certain of permanent stable high income never needing protections (rare certainty).

    Explore More in Money Basics

    Disclosure

    This article provides general educational information about debt consolidation strategies and products. Individual consolidation suitability, rates, terms, fees, and outcomes vary significantly based on circumstances including credit score, income, debt-to-income ratio, debt types, and lender policies. This is not financial advice, endorsement of specific consolidation products or lenders, or guarantee of approval or specific terms. Debt consolidation carries significant risks including origination fees (typically 1-8%), balance transfer fees (3-5%), extended repayment terms potentially increasing total interest paid despite lower rates, home foreclosure risk when using home equity products, potential debt reaccumulation if spending behavior unchanged creating worse financial position than before consolidation. Interest rate and payment examples represent typical scenarios—actual rates vary based on creditworthiness and market conditions. Total cost comparisons assume consistent payments and no reaccumulation—actual results depend on individual discipline and behavior changes. Balance transfer promotional periods vary (12-21 months typical) and require disciplined payoff before expiration to maximize savings. Home equity consolidation particularly risky transforming unsecured dischargeable debt into secured debt risking primary residence foreclosure—generally not recommended for consumer debt consolidation. Federal student loan consolidation into private personal loans eliminates irreplaceable federal protections including income-driven repayment, forgiveness programs, and deferment/forbearance options—strongly discouraged except rare circumstances. Debt management plans through credit counseling appear on credit reports and require account closures. Reaccumulation statistics based on industry observations not controlled scientific studies. Tax implications of different consolidation products vary—interest deductibility depends on product type and individual tax situation requiring professional tax advice. Some debt types may not be eligible for consolidation depending on lender policies. Consult qualified financial professionals, credit counselors (NFCC.org member agencies), or debt advisors for personalized guidance matching individual circumstances, debt compositions, and behavioral readiness. Focus on addressing root spending causes alongside mechanical consolidation preventing future cycles. Advertisements or sponsored content may appear within or alongside this content. All information presented independently for educational purposes only.

  • 5.8 Debt Avalanche Method: Save the Most Money on Interest

    5.8 Debt Avalanche Method: Save the Most Money on Interest

    Debt avalanche method is mathematically-optimal debt elimination strategy prioritizing interest cost minimization by attacking highest APR debt first regardless of balance size—paying minimums on all debts except highest interest rate, applying all extra payment to highest APR debt, then rolling entire payment to next highest rate when first debt eliminated, minimizing total interest paid through mathematical optimization saving $500-2,000 typical versus debt snowball (smallest-first) approach on $15,000-20,000 total debt. While requiring greater discipline and delayed gratification—first victory potentially 8-15 months versus snowball’s 3-6 months—avalanche method produces superior outcomes for number-focused individuals motivated by optimization and comfortable with extended timeline before tangible progress, making avalanche ideal for financially-disciplined borrowers prioritizing total cost reduction over psychological wins, though requiring sustained commitment without early celebration milestones creating 60-70% completion rate versus snowball’s 80%+ due to discouragement risk from delayed first victory. Understanding when avalanche superior versus when snowball’s behavioral advantages outweigh mathematical savings enables informed method selection optimizing individual personality fit—disciplined analytical personalities thrive with avalanche saving maximum interest while psychology-driven individuals achieve better outcomes accepting snowball’s modest premium ensuring execution, demonstrating debt elimination success requires matching strategy to personality not universal method superiority declarations.

    Notebook sketch explaining personal finance

    This article is designed for mathematically-inclined individuals wanting optimal debt elimination strategy, high-discipline borrowers comfortable delayed gratification, or anyone evaluating avalanche versus snowball methods. You do not need advanced math expertise to understand avalanche—basic interest calculation and ranking by APR accessible to anyone, though requires honest self-assessment recognizing whether motivated by mathematical optimization or psychological wins, disciplined commitment maintaining aggressive payments 12-24+ months without early victories, and realistic personality evaluation determining if capable sustaining motivation through extended timeline before first tangible progress milestone preventing discouragement-driven abandonment destroying optimization benefits through perpetual debt continuation.

    Understanding debt avalanche method matters because mathematical optimization saves $500-2,000 interest on typical debt loads through highest-APR-first approach versus random or balance-based methods, 2-4 month faster total elimination timeline through efficient interest minimization creates quicker overall freedom, and strategic approach optimal for specific personality types maximizing outcomes when matched appropriately—while avalanche-method users save maximum interest completing elimination 2-4 months faster than snowball when sustained through completion, versus abandoners perpetuating debt indefinitely through discouragement costing $10,000+ in continued interest when delayed first victory (12+ months typical) causes motivation collapse, proving avalanche produces superior outcomes for disciplined analytical individuals while creating inferior results for psychology-driven majority requiring quick wins impossible without honest personality assessment enabling appropriate method selection optimizing completion probability over theoretical superiority.

    Educational disclaimer: This article provides general educational information about debt avalanche method. Individual debt situations, appropriate strategies, payoff timelines, and interest savings vary based on circumstances including total debt, income, expenses, interest rate composition, and individual discipline. This is not financial advice or recommendation that debt avalanche method optimal for all situations. Debt elimination requires sustained commitment regardless of method. Some individuals may achieve better outcomes with debt snowball or hybrid approaches based on psychological factors. Consult qualified financial professionals or credit counselors for personalized guidance matching individual circumstances and personality profiles.

    Avalanche Method Fundamentals

    How Avalanche Method Works

    Core principles:

    • List all debts from highest to lowest APR
    • Ignore balance amounts completely in ranking
    • Pay minimum payments on all debts except highest APR
    • Apply all extra available payment to highest APR debt
    • When highest APR eliminated, roll entire payment to next highest APR
    • Repeat until all debts eliminated
    • Minimizes total interest paid mathematically

    Step-by-step implementation:

    Step 1: List all debts highest to lowest APR

    • Credit card B: $5,000 at 24% APR, $150 minimum
    • Store card: $800 at 22% APR, $25 minimum
    • Credit card A: $2,500 at 18% APR, $75 minimum
    • Auto loan: $8,000 at 6% APR, $250 minimum
    • Student loan: $15,000 at 5% APR, $180 minimum

    Step 2: Calculate total available monthly payment

    • Required minimums: $680 total
    • Extra from budget: $320
    • Total available: $1,000 monthly

    Step 3: Allocate payments using avalanche ranking

    • Credit card B: $150 minimum + $320 extra = $470 total (attack highest APR)
    • Store card: $25 minimum only
    • Credit card A: $75 minimum only
    • Auto loan: $250 minimum only
    • Student loan: $180 minimum only

    Step 4: Eliminate first debt and roll payment

    • Credit card B: Paid off in 12 months ($470 × 12 = $5,640 covers balance + interest)
    • Roll $470 to Store card (next highest APR) creating $495 monthly payment ($25 + $470)
    • Continue minimums on remaining debts

    Step 5: Continue avalanche through all debts by APR

    • Store card: Paid in additional 2 months with $495 monthly
    • Roll $495 to Credit card A creating $570 monthly ($75 + $495)
    • Credit card A: Paid in additional 5 months
    • Roll $570 to Auto loan creating $820 monthly
    • Auto loan: Paid in additional 10 months
    • Roll $820 to Student loan creating $1,000 monthly
    • Student loan: Paid in additional 15 months
    • Total timeline: 44 months completely debt-free

    Why It’s Called “Avalanche”

    Avalanche metaphor:

    • Like snow avalanche gaining momentum downhill
    • Initial progress slow (attacking large balance at high rate)
    • Acceleration builds as highest-cost debts eliminated
    • Momentum compounds saving more interest each month
    • Final debts fall rapidly despite larger balances through massive payments and low rates

    Mathematical Superiority Principle

    Why avalanche saves most interest:

    • Every dollar of principal reduction on 24% debt saves $0.24 annually
    • Same dollar on 6% debt saves only $0.06 annually
    • Attacking highest rates first maximizes per-dollar interest savings
    • Compound effect over months/years creates substantial total savings

    Interest savings example:

    • $1,000 extra payment to 24% debt: Saves $240 annually in future interest
    • Same $1,000 to 6% debt: Saves $60 annually in future interest
    • Avalanche optimizes every payment maximizing interest reduction
    Advertisement

    Financial Wellness Planner

    Avalanche vs Snowball Detailed Comparison

    Same Debt Load Both Methods

    Starting scenario:

    • Total debt: $31,300 across 5 debts
    • Available payment: $1,000 monthly
    • Debts: Credit card B $5,000 at 24%, Store card $800 at 22%, Credit card A $2,500 at 18%, Auto $8,000 at 6%, Student $15,000 at 5%

    AVALANCHE Results (Highest APR First)

    Attack sequence by APR:

    • 1st: Credit card B $5,000 at 24%
    • 2nd: Store card $800 at 22%
    • 3rd: Credit card A $2,500 at 18%
    • 4th: Auto loan $8,000 at 6%
    • 5th: Student loan $15,000 at 5%

    Victory timeline:

    • Month 12: Credit card B eliminated (first victory after 1 year)
    • Month 14: Store card eliminated
    • Month 19: Credit card A eliminated
    • Month 29: Auto loan eliminated
    • Month 44: Student loan eliminated (DEBT FREE)

    Financial results:

    • Total paid: $32,100
    • Total interest: $800
    • Timeline: 44 months (3 years 8 months)

    SNOWBALL Results (Smallest Balance First)

    Attack sequence by balance:

    • 1st: Store card $800
    • 2nd: Credit card A $2,500
    • 3rd: Credit card B $5,000
    • 4th: Auto loan $8,000
    • 5th: Student loan $15,000

    Victory timeline:

    • Month 3: Store card eliminated (first victory after 3 months)
    • Month 10: Credit card A eliminated
    • Month 20: Credit card B eliminated
    • Month 30: Auto loan eliminated
    • Month 46: Student loan eliminated (DEBT FREE)

    Financial results:

    • Total paid: $32,850
    • Total interest: $1,550
    • Timeline: 46 months (3 years 10 months)

    Method Comparison Summary

    AVALANCHE ADVANTAGES:

    • Interest savings: $750 less paid ($800 vs $1,550)
    • Time savings: 2 months faster (44 vs 46 months)
    • Mathematical optimization: Every payment maximally efficient
    • Percentage savings: 2.3% lower total cost

    SNOWBALL ADVANTAGES:

    • First victory: Month 3 vs Month 12 (9 months earlier)
    • Victories year 1: 2 debts eliminated vs 0
    • Psychological momentum: Regular celebration milestones
    • Completion rate: 80%+ vs 60-70% (behavioral research)

    Key insight:

    • $750 avalanche savings represents excellent value IF completed
    • Snowball’s $750 premium represents insurance against abandonment
    • Abandoned avalanche costs $10,000+ in perpetual interest
    • Completed snowball outperforms abandoned avalanche dramatically

    When Interest Savings Become Significant

    Large savings scenarios (avalanche clearly superior):

    Extreme rate gaps:

    • $8,000 at 29% APR vs $1,000 at 4% APR
    • Avalanche attacks 29% saving $2,320 annually in interest reduction
    • Snowball attacks $1,000 saving $40 annually
    • Gap: $2,280 annual difference making avalanche clearly superior

    High total debt with rate variation:

    • $50,000+ total debt across 10+ accounts
    • Rates ranging 8-26%
    • Avalanche savings: $2,000-5,000 versus snowball
    • Significant dollar amounts justifying mathematical approach

    Minimal savings scenarios (snowball acceptable):

    Similar interest rates:

    • All debts 15-20% APR range
    • Avalanche savings: $200-400 total
    • Psychological benefit of snowball outweighs minimal cost

    Small total debt:

    • Under $10,000 total across 3-4 accounts
    • Avalanche savings: $100-300
    • Quick elimination either method (12-18 months)
    • Method choice less critical with short timeline

    Implementing Avalanche Method Successfully

    Step 1: Accurate Interest Rate Inventory

    Gathering APR information:

    • Check recent statements for each debt
    • Call creditors if APR unclear or variable
    • Note promotional rates and expiration dates
    • Calculate weighted average if multiple APRs on one account

    APR precision importance:

    • 22.99% vs 23.24% APR = different attack priorities
    • Small rate differences matter in avalanche ranking
    • Variable rates: Use current rate for ranking, re-evaluate quarterly

    Organization example:

    • Credit card A: 24.99% APR, $4,500 balance
    • Credit card B: 21.24% APR, $2,800 balance
    • Credit card C: 18.99% APR, $6,200 balance
    • Auto loan: 7.5% APR, $12,000 balance
    • Student loan: 5.8% APR, $18,000 balance

    Step 2: Calculate Maximum Payment Capacity

    Finding aggressive payment amount:

    • List all minimum payments
    • Identify discretionary cuts (aggressive approach)
    • Add side income opportunities
    • Maximize total available for debt elimination

    Example capacity building:

    • Minimums required: $850
    • Discretionary cuts: $400 (dining, entertainment, subscriptions)
    • Side income: $500 (freelance work 10 hours weekly)
    • Total capacity: $1,750 monthly (106% increase over minimums)

    Step 3: Maintain Discipline Through Extended Timeline

    Avalanche-specific challenges:

    • First victory often 8-15 months (versus snowball’s 3-6)
    • Requires intrinsic motivation without external victories
    • Large balance at high rate creates slow visible progress
    • Temptation to switch methods when discouraged

    Discipline maintenance strategies:

    1. Interest savings tracking:

    • Calculate monthly interest saved versus minimum payments
    • Running total of interest avoided through aggressive payments
    • Example: “Saved $185 interest this month, $1,840 total saved so far”
    • Provides tangible progress metric without account elimination

    2. Balance reduction milestones:

    • Celebrate $1,000 increments on attack debt
    • Example: $5,000 → $4,000 → $3,000 mini-celebrations
    • Visual progress bars showing percentage paid

    3. Mathematical focus reinforcement:

    • Monthly calculation of avalanche vs snowball comparison
    • “On track to save $850 versus snowball” validation
    • Spreadsheet showing projected final savings

    4. Commitment devices:

    • Public declaration (accountability community)
    • Automated payments preventing reduction temptation
    • Written commitment reviewing reasons for avalanche choice

    Step 4: Optimize with Balance Transfers

    Avalanche-transfer combination:

    • Transfer highest APR debts to 0% promotional cards
    • Eliminates interest on attack debt during payoff
    • Dramatically increases savings versus standard avalanche

    Example optimization:

    • Credit card $6,000 at 24% (attack debt)
    • Transfer to 0% for 18 months with 3% fee ($180)
    • Pay $400 monthly eliminating in 15 months
    • Interest saved: $1,100+ versus no transfer
    • Total cost: $6,180 vs $7,300+ standard avalanche
    Advertisement
    Reserved space for in-content ad

    Who Should Choose Avalanche Method

    Ideal Avalanche Candidates

    Personality characteristics:

    • Mathematically-oriented: Motivated by numbers, optimization, efficiency
    • High discipline: Sustains commitment without external validation
    • Delayed gratification: Comfortable waiting 12+ months for first victory
    • Analytical decision-maker: Prioritizes logic over emotion
    • Intrinsically motivated: Doesn’t require celebration milestones

    Debt composition favoring avalanche:

    • Extreme rate gaps (24%+ versus 5% creating $1,500+ savings)
    • High total debt ($30,000+) where savings substantial ($2,000+)
    • Few accounts (3-4 debts total creating manageable timeline)
    • Large high-rate balances where avalanche attack makes mathematical sense

    Successful avalanche profile example:

    • Engineer or accountant (number-focused profession)
    • History of completing long-term goals (marathon training, advanced degree)
    • Spreadsheet enthusiast tracking finances meticulously
    • Motivated by optimization and efficiency
    • Comfortable with gradual progress toward distant goals

    Poor Avalanche Candidates

    Personality red flags:

    • Previous debt elimination attempts failed
    • Need frequent validation and celebration
    • Emotionally-driven decision-making
    • Impulsive or easily discouraged
    • Difficulty sustaining motivation without tangible wins

    Better snowball indicators:

    • Multiple small balances under $2,000 (enables quick snowball wins)
    • Similar interest rates across debts (minimal avalanche savings)
    • Need for psychological momentum
    • Spousal disagreement (snowball creates visible progress reducing conflict)

    Self-Assessment Questions

    Choose AVALANCHE if answering “yes” to most:

    • Am I motivated primarily by numbers and optimization?
    • Can I sustain 12+ months effort without tangible victories?
    • Do I track finances meticulously in spreadsheets?
    • Have I successfully completed other long-term goals requiring delayed gratification?
    • Are my interest rate gaps extreme (20%+ differential)?
    • Is my total debt over $25,000 where savings substantial?
    • Do I make decisions based on logic rather than emotion?

    Choose SNOWBALL if answering “yes” to most:

    • Have previous debt payoff attempts failed from discouragement?
    • Do I need frequent wins to maintain motivation?
    • Do I have multiple small balances under $2,000?
    • Am I emotionally-driven in financial decisions?
    • Are my interest rates relatively similar (15-22% range)?
    • Is total debt under $15,000 where method difference minimal?
    • Do I value psychological progress over mathematical optimization?

    Hybrid Approaches

    Modified Avalanche-Snowball

    Quick-win avalanche:

    • Attack smallest balance first (regardless of rate) for immediate victory
    • Switch to avalanche for remaining debts
    • Captures psychological boost plus mathematical efficiency

    Example implementation:

    • Debts: $800 at 15%, $3,000 at 22%, $5,000 at 24%, $8,000 at 6%
    • Snowball first: Attack $800 (2-3 month victory)
    • Then avalanche: Attack 24%, then 22%, then 6%
    • Cost: $50-100 extra interest for quick win
    • Benefit: Motivation boost plus 95% of avalanche savings

    Rate-Threshold Avalanche

    Attack high rates only:

    • Avalanche all debts over 12% APR
    • Switch to snowball for remaining low-rate debts
    • Maximizes interest savings on expensive debt
    • Provides psychological wins on final stretch

    Example:

    • High-rate group: $4,000 at 24%, $3,000 at 20%, $2,500 at 18%
    • Avalanche these first (24% → 20% → 18%)
    • Low-rate group: $8,000 at 7%, $6,000 at 5%
    • Snowball these second ($6,000 → $8,000 for quick final victory)

    Balance-Modified Avalanche

    Avalanche with balance consideration:

    • Attack highest APR as standard avalanche
    • Exception: If rate within 2% and balance 5x smaller, attack small one first
    • Provides flexibility for near-ties

    Example decision:

    • Option A: $6,000 at 21% APR
    • Option B: $1,000 at 19% APR
    • Rate difference: 2% (minimal)
    • Balance ratio: 6:1
    • Decision: Attack $1,000 first (3-month victory worth 2% rate difference)
    • Then attack $6,000 at 21%
    Advertisement
    Reserved space for in-content ad

    Why Understanding Debt Avalanche Method Matters

    Without understanding debt avalanche method, individuals miss mathematical optimization opportunity saving $500-2,000 interest through highest-APR-first approach versus random payments or balance-focused methods, lack framework for informed method selection comparing avalanche and snowball based on personality fit and debt composition, and either choose suboptimal method wasting interest dollars when disciplined enough for avalanche or attempt avalanche without appropriate temperament leading to abandonment—while avalanche-method users maximize interest savings completing elimination 2-4 months faster through mathematical efficiency when personality compatible and commitment sustained, versus inappropriate avalanche attempts by psychology-driven individuals resulting in abandonment perpetuating debt costing $10,000+ through motivation collapse from delayed first victory, demonstrating critical importance of method-personality matching not universal superiority claims making avalanche understanding essential for informed strategic selection optimizing individual outcomes.

    Understanding debt avalanche method enables individuals to:

    • Evaluate mathematical optimization potential calculating interest savings versus snowball
    • Assess personality fit recognizing whether discipline sufficient for delayed gratification
    • Implement highest-APR-first systematically when appropriate maximizing efficiency
    • Combine with balance transfers optimizing interest elimination on attack debt
    • Make informed method choice weighing $500-1,000 savings against psychological factors
    • Consider hybrid approaches capturing optimization benefits with psychological wins
    • Maintain commitment through extended timeline using interest-savings tracking

    Debt avalanche knowledge transforms method selection from random choice or dogmatic adherence into informed personality-based optimization weighing mathematical efficiency against psychological momentum, enabling maximum interest savings when individual temperament compatible with delayed gratification versus recognizing when snowball’s behavioral advantages outweigh modest avalanche premium impossible without understanding both method mechanics and honest self-assessment determining appropriate strategic fit.

    Common Misunderstandings

    Many people assume debt avalanche always superior because it minimizes interest mathematically. In reality, abandoned avalanche produces worse outcomes than completed snowball—$750 theoretical savings becoming $0 when method abandoned after 6 months perpetuating $15,000 debt costing $10,000+ in continued interest over subsequent years, versus snowball’s $750 premium ensuring completion through quick wins creating total interest cost $1,550 versus perpetual debt scenario’s $10,000+, proving mathematical superiority irrelevant without completion making execution probability more important than theoretical optimization for majority requiring psychological momentum impossible through interest-rate-only focus.

    Another common misconception is avalanche dramatically more complex than snowball requiring advanced mathematical skills. In practice, avalanche simply ranks debts by APR instead of balance—anyone capable listing debts smallest-to-largest for snowball equally capable listing highest-to-lowest APR for avalanche with identical execution mechanics thereafter (minimums on all except attack debt, roll payments when eliminated), making complexity difference zero while personality fit for delayed gratification creates actual differentiation not mathematical difficulty proving avalanche accessibility identical to snowball despite perception of increased complexity.

    Some believe small interest rate differences insignificant making avalanche unnecessary perfectionism. However, attacking 24% debt versus 18% debt with $300 monthly creates $18 monthly interest differential accumulating to $500-800 over typical 24-30 month elimination period, making rate optimization worthwhile even for modest differentials when completion assured, though correctly observing that 18% versus 16% differences create minimal savings ($6 monthly = $150-200 total) where snowball’s psychological advantages likely outweigh mathematical premium demonstrating importance of evaluating rate gaps determining when avalanche optimization worthwhile versus when snowball acceptable.

    How Avalanche Understanding Fits Into Financial Success

    Debt avalanche understanding enables informed method selection optimizing mathematical efficiency when personality compatible with delayed gratification saving $500-2,000 interest versus alternative approaches, prevents inappropriate avalanche attempts by psychology-driven individuals requiring quick wins avoiding abandonment costing $10,000+ through motivation collapse, and provides framework evaluating rate gaps determining when optimization worthwhile versus when minimal savings make snowball acceptable—making avalanche literacy essential component of strategic debt elimination requiring honest self-assessment matching method to temperament, realistic evaluation of rate composition determining savings potential, and disciplined commitment sustaining motivation through 12-24 month timeline without early celebration milestones, transforming debt elimination from one-size-fits-all approach into personalized optimization maximizing individual outcomes through appropriate method selection impossible without understanding both avalanche mechanics and personality fit requirements.

    For example, two engineers both age 35 both carrying $22,000 debt across 5 accounts with identical APR composition and $900 monthly payment capacity. Engineer A reads about snowball method’s psychological benefits, implements smallest-first approach despite analytical personality. Month 1-3: Attacks $1,200 smallest balance, eliminates successfully creating quick win. Month 4-8: Attacks $2,800 second balance, eliminates month 8. However, feels frustrated watching $6,000 at 26% APR accrue $130 monthly interest while attacking $2,800 at 17% APR accruing only $40 monthly, recognizes inefficiency bothers analytical mind. Month 9-12: Conflicted between continuing snowball versus switching to avalanche, decision paralysis reduces motivation. Month 13-18: Reduces payment from $900 to $600 “temporarily” due to motivational lapse from method misalignment. After 18 months: Paid $13,500 but remaining debt $13,200 (minimal progress last 6 months), feels defeated by slower-than-expected progress. After 36 months: Finally completes elimination having reduced payments multiple times, total paid $23,800 ($22,000 principal + $1,800 interest). Engineer B understands both methods, recognizes analytical personality compatible with avalanche approach, implements highest-APR-first systematically. Month 1-12: Attacks $6,000 at 26% APR with $900 monthly, balance decreases visibly each month ($6,000 → $5,300 → $4,550 → $3,750…), tracks interest saved versus minimum payments ($156 first month → $2,100 cumulative after 12 months), eliminates month 12. Celebrates with $50 dinner recognizing first milestone. Month 13-16: Attacks $3,500 at 23% APR, eliminates month 16. Month 17-22: Attacks $4,500 at 19% APR, eliminates month 22. Month 23-27: Attacks $5,200 at 7% APR, eliminates month 27. Month 28-30: Attacks final $2,800 at 6% APR, completely debt-free month 30. Total paid: $22,650 ($22,000 + $650 interest). Immediately redirects $900 monthly to investments. Difference: Engineer A’s snowball approach despite analytical personality created motivation misalignment causing payment reductions extending timeline to 36 months costing $23,800 ($1,800 interest) despite method designed for psychological wins not matching individual temperament, Engineer B’s avalanche approach matching analytical personality maintained consistent $900 monthly through interest-savings motivation completing 30 months paying $22,650 ($650 interest) demonstrating $1,150 savings ($1,800 – $650 = $1,150 interest difference) plus 6-month faster timeline from appropriate method-personality matching impossible without avalanche understanding enabling self-assessment determining strategic fit creating superior outcomes through personalized optimization versus dogmatic adherence to single approach.

    Debt avalanche understanding separates strategically-optimized eliminators matching method to personality from misaligned method users either wasting interest through incompatible snowball choice when discipline sufficient for avalanche or attempting avalanche without appropriate temperament leading to abandonment, requiring both method mechanics comprehension and honest self-assessment enabling informed strategic selection producing measurable outcome differences impossible without avalanche literacy.

    Recent Updates and Trends

    In recent years, online debt calculators have proliferated enabling instant avalanche-versus-snowball comparison showing exact interest savings and timeline differences, though fundamental method mechanics unchanged with highest-APR-first approach remaining mathematically optimal regardless of technological tools simplifying comparison analysis making calculator availability enhancing decision-making not altering underlying strategic principles.

    Debt elimination community debates between avalanche and snowball advocates have intensified creating tribal method loyalty, though individual personality fit more important than universal method superiority with both approaches producing successful outcomes when matched appropriately to borrower temperament making debate somewhat counterproductive when framed as absolute superiority rather than personality-based optimization selection.

    Financial advisors increasingly recognize behavioral finance importance acknowledging that mathematically-optimal strategies fail when abandoned, though some remain avalanche purists dismissing snowball’s $500-1,000 premium as wasteful despite completion probability evidence suggesting executed snowball outperforms abandoned avalanche making execution-focused approaches practically superior for psychology-driven majority requiring celebration milestones.

    Hybrid method adoption has grown as borrowers recognize pure avalanche or snowball less optimal than customized approaches combining quick wins with mathematical efficiency, though consistency within chosen framework remains more important than constant optimization attempts creating decision fatigue and reduced execution quality demonstrating value of initial informed selection over perpetual method switching.

    Fundamental avalanche principles remain timeless: highest-APR-first minimizes total interest mathematically, requires discipline sustaining commitment without early victories, produces superior outcomes for analytical personalities comfortable delayed gratification, and should be evaluated against snowball considering both interest savings magnitude and individual psychological factors—regardless of calculator proliferation, community debate intensity, advisor acknowledgment changes, or hybrid approach popularity, understanding highest-APR-first mechanics, calculating interest savings potential, and honestly assessing personality fit produces optimal method selection maximizing individual outcomes through appropriate strategic matching impossible without avalanche literacy enabling informed comparison-based decision-making.

    3 Things You Can Do Today

    Ready to evaluate debt avalanche approach? Here are three simple steps you can take right now:

    1. Calculate exact interest savings comparing avalanche versus snowball on your specific debt revealing whether optimization worthwhile – List all debts with balances and APRs: Example—Credit card A $3,500 at 24%, Credit card B $5,200 at 19%, Auto loan $8,500 at 7%, Student loan $12,000 at 5%. Use online debt calculator (undebt.it, creditkarma debt calculator) entering all debts with available monthly payment amount. Run AVALANCHE calculation: Highest APR first, record total paid, total interest, timeline (example result: $29,800 total, $600 interest, 32 months). Run SNOWBALL calculation: Smallest balance first, record total paid, total interest, timeline (example result: $30,350 total, $1,150 interest, 34 months). Compare results: Calculate savings (example: $550 interest savings, 2 months faster with avalanche = $550 ÷ $29,200 total debt = 1.9% cost difference). Evaluate significance: If savings $500+ and 2+ months faster = avalanche worthwhile if disciplined. If savings under $300 and similar timeline = snowball acceptable accepting minor premium for psychological benefits. Consider rate gaps: If extreme gaps (24% versus 5% = 19% differential) avalanche clearly superior mathematically. If modest gaps (all debts 15-20% range) savings minimal making snowball acceptable. Write comparison: “Avalanche: $X total, Y months. Snowball: $A total, B months. Difference: $C savings (D%), E months faster.” Decision framework: Savings over $1,000 or 10%+ cost difference = avalanche strongly recommended if capable. Savings $300-1,000 = evaluate personality fit determining if worthwhile. Savings under $300 = snowball acceptable for most personalities. Takes 20 minutes revealing exact mathematical difference enabling informed method selection impossible when choosing based on general principles without specific debt composition calculation.

    2. Complete honest self-assessment determining personality fit for avalanche’s delayed gratification requirements – Answer key questions truthfully: (1) Have I successfully completed other long-term goals requiring 12+ months sustained effort without intermediate victories? Examples: Marathon training, advanced degree completion, career certification programs requiring extended study. (2) Am I motivated primarily by mathematical optimization and efficiency versus psychological wins and celebration? (3) Do I track finances meticulously enjoying spreadsheet analysis and optimization? (4) Can I sustain motivation for 12-18 months before first debt elimination without discouragement? (5) Have previous debt elimination attempts succeeded or failed? If failed, what caused abandonment—discouragement from slow progress or other factors? (6) How do I make major decisions—analytical data-driven versus emotional gut-feeling? Score assessment: Answer “yes” to 5-6 questions = Strong avalanche candidate, disciplined analytical personality compatible with delayed gratification making mathematical optimization appropriate choice maximizing interest savings. Answer “yes” to 3-4 questions = Moderate avalanche candidate, consider hybrid approach (quick win first then avalanche) or avalanche with enhanced tracking showing interest savings creating tangible progress metric. Answer “yes” to 0-2 questions = Poor avalanche candidate, snowball method likely produces better outcomes through psychological momentum preventing abandonment making $500 premium worthwhile execution insurance. Additional consideration: If spousal debt elimination requiring agreement, evaluate both personalities choosing method both can sustain preventing conflict from one partner’s discouragement derailing joint effort. Write assessment: “Personality assessment: [Strong/Moderate/Poor] avalanche candidate. Primary motivation: [Mathematical/Psychological]. Recommended method: [Avalanche/Hybrid/Snowball] based on temperament analysis.” Takes 15 minutes creating honest personality evaluation preventing method-temperament misalignment causing abandonment impossible when choosing methods based on theoretical superiority without self-awareness determining strategic fit.

    3. If avalanche chosen, establish interest-savings tracking system creating tangible progress metric during extended first-victory timeline – Create tracking spreadsheet: Columns for Month, Attack Debt Balance, Interest Paid This Month, Interest Saved Versus Minimums, Cumulative Interest Saved, Months Remaining. Calculate monthly interest saved: Compare actual interest paid on aggressive payment versus minimum-only scenario, example—$5,000 balance at 24%, pay $500 ($100 interest, $400 principal) versus minimum $150 ($100 interest, $50 principal), saved $0 interest this month BUT reduced balance $350 more preventing future interest, calculate annual savings $350 × 0.24 = $84 annually = $7 monthly ongoing from this payment. Track cumulative savings: Running total of all interest prevented through aggressive payments versus minimum-only perpetuation, example progression—Month 1: $7 saved, Month 2: $14 saved, Month 3: $22 saved… Month 12: $150 saved, provides tangible progress number despite no account eliminations yet. Visual progress representation: Create bar chart showing attack debt balance declining monthly ($5,000 → $4,500 → $4,000 → $3,500…) plus second chart showing cumulative interest savings increasing ($7 → $14 → $22 → $150…), post prominently (refrigerator, office wall) creating visible daily reminder. Balance milestones celebration: Plan small celebrations every $1,000 reduction on attack debt even without full elimination (example: $5,000 → $4,000 = $25 celebration dinner, $4,000 → $3,000 = another $25 celebration) creating intermediate psychological wins during extended timeline. Monthly review ritual: First of month update tracking, calculate month’s interest saved, review cumulative total, adjust projection to debt-free date if payment increased/decreased. Example monthly update: “Month 8: Attack debt now $3,200 (down $1,800 from start), paid $160 interest versus $240 if minimums only (saved $80 this month), cumulative savings $420 total, 14 months remaining to first elimination.” Takes 1 hour initial setup plus 15 minutes monthly maintenance creating systematic progress tracking preventing discouragement from lack of account eliminations during avalanche’s extended first-victory timeline impossible when relying only on balance reduction without tangible interest-savings metric showing mathematical benefit justifying sustained commitment.

    These actions create avalanche method evaluation and implementation foundation within 2 hours—calculated exact interest savings on specific debt ($550 example) determining whether optimization worthwhile versus accepting snowball’s psychological premium, completed honest personality assessment (strong/moderate/poor avalanche candidate) preventing method-temperament misalignment, and established interest-savings tracking system ($7 monthly increasing to $150+ cumulative) creating tangible progress metric maintaining motivation during extended 12-month first-victory timeline—transforming avalanche decision from abstract method choice into data-driven personality-matched strategic selection with systematic execution infrastructure ensuring sustained commitment impossible without calculation-based comparison, self-assessment, and progress tracking enabling appropriate method selection and disciplined implementation.

    Advertisement
    Reserved space for in-content ad

    Quick FAQ

    What is debt avalanche method exactly?
    Mathematically-optimal debt elimination strategy attacking highest interest rate first regardless of balance size minimizing total interest paid: Core mechanics—List all debts highest to lowest APR (ignore balances completely), pay minimums on all except highest APR, apply all extra payment to highest APR debt, when eliminated roll entire payment to next highest APR creating accelerating payments as expensive debts disappear, repeat until debt-free. Example: $5,000 at 24%, $800 at 22%, $2,500 at 18%, $8,000 at 6%, attack sequence 24% → 22% → 18% → 6% regardless of balances. Mathematical optimization: Every dollar attacking 24% debt saves $0.24 annually in future interest versus same dollar on 6% debt saving only $0.06, maximizing per-dollar interest reduction through highest-rate-first approach. Named “avalanche” because momentum builds as highest-cost debts eliminated creating accelerating interest savings like avalanche gaining speed downhill. Key principle: Prioritizes mathematical efficiency over psychological wins accepting delayed first victory (often 12+ months) requiring discipline and delayed gratification making method optimal for analytical personalities comfortable with extended timelines before tangible progress versus psychology-driven individuals needing quick wins preventing discouragement.

    How much does avalanche actually save versus snowball?
    Typically $500-2,000 on common debt loads ($15,000-30,000 total) depending on rate composition, not $5,000-10,000 feared making premium modest not massive: Savings determinants—Rate gaps between debts (larger gaps = more savings), total debt amount (higher debt = larger absolute savings even if percentage similar), payment aggressiveness (faster payoff = less time for interest differential to compound). Typical scenario savings: $15,000 total debt across 4-5 accounts ranging 15-24% APR, $700 monthly payment, avalanche total paid $16,200 versus snowball $16,850 = $650 savings (4% difference) over 24-26 month elimination. High-savings scenario: $30,000 debt with extreme rate gaps (26% and 29% cards versus 5% student loans), avalanche saves $1,500-2,500 versus snowball (5-8% difference). Low-savings scenario: $12,000 debt with similar rates (all 16-21% range), avalanche saves $200-400 versus snowball (2-3% difference). Time savings: Avalanche typically 2-4 months faster total elimination through mathematical efficiency. Reality check: $650 typical savings represents 2.3% premium on $28,000 total paid making snowball’s psychological benefits often worthwhile trade-off for non-analytical personalities, while $2,000+ savings scenarios clearly favor avalanche making method choice dependent on specific debt composition not universal superiority. Calculation necessity: MUST calculate personal debt scenario using online calculator determining actual savings before method selection—general estimates insufficient for informed decision-making requiring specific debt composition analysis.

    What if I get discouraged before finishing avalanche method?
    Switch to snowball immediately rather than abandoning debt elimination entirely, accepting $500 premium worthwhile preventing perpetual debt: Discouragement recognition signs—Lost motivation to make extra payments, reducing payment amounts from initial commitment, avoiding tracking or thinking about debt progress, considering giving up on aggressive elimination returning to minimums only. Immediate intervention: (1) Calculate remaining debt under both methods showing snowball produces first victory within 3-6 months creating motivation renewal versus avalanche requiring 8-12+ more months, (2) Switch to snowball attacking smallest remaining balance providing quick win restoring momentum, (3) Accept $300-500 additional interest cost as execution insurance preventing complete abandonment costing $10,000+ in perpetual debt. Example switch: Started avalanche 6 months ago, attacked $6,000 at 24%, reduced to $3,500, feeling discouraged no accounts eliminated yet. Remaining debts: $3,500 at 24%, $4,200 at 19%, $1,200 at 17%, $7,500 at 6%. Switch decision: Attack $1,200 at 17% next (smallest) eliminating in 3 months creating victory reviving motivation versus continuing $3,500 requiring 9 more months. Cost: Additional $180 interest accepting 17% attack before finishing 24%, benefit preventing complete abandonment saving plan. Alternative: Hybrid approach—finish current $3,500 at 24% (sunk cost, 9 months remaining), THEN switch to snowball for remaining debts capturing most avalanche savings while providing psychological wins on final stretch. Prevention better than cure: If prone to discouragement choose snowball initially rather than starting avalanche and switching later, or use hybrid (quick win first then avalanche) combining psychological boost with mathematical efficiency. Key insight: Completed snowball vastly superior to abandoned avalanche—$650 snowball interest better than $0 of abandoned theoretical avalanche savings making execution probability paramount not theoretical optimization.

    Can I combine avalanche with balance transfers for maximum savings?
    Yes—powerful combination eliminating interest on attack debt during payoff dramatically increasing total savings: Strategy—Transfer highest APR debt to 0% promotional credit card (typically 12-18 months), attack transferred balance aggressively during promotional period eliminating before reversion to regular APR, roll payment to next highest APR (either transferred again or standard avalanche attack). Example optimization: Have $7,000 at 24% APR (attack debt per avalanche), $4,500 at 19%, $3,200 at 15%, $8,500 at 6%, $900 monthly payment. Transfer $7,000 to 0% for 18 months with 3% fee ($210). Pay $550 monthly to 0% transfer eliminating in 13 months, $350 minimums to other debts. Interest saved: $1,680 (versus 24% standard avalanche) minus $210 fee = $1,470 net savings. After 0% eliminated: Roll $550 to next debt continuing avalanche, dramatically ahead of standard approach. Requirements: Good credit qualifying for 0% transfers (typically 670+ score), discipline avoiding new purchases on transfer card (no grace period), aggressive payment ensuring payoff before promotion ends (reversion to 18-25% negates savings). Optimal combination: Avalanche method identifies highest-cost debts systematically, balance transfers eliminate interest on those debts during payoff, creating maximum mathematical optimization saving $1,500-3,000+ versus standard approaches. Warning: Transfer strategy requires planning—calculate required monthly payment (balance ÷ promotional months) ensuring affordable before transferring, otherwise risk partial payoff and reversion to high regular APR destroying optimization benefit.

    Should I ever switch from avalanche to snowball mid-process?
    Generally no—method consistency more important than optimization, BUT acceptable if extreme discouragement threatens complete abandonment: Stay avalanche when—Making progress on attack debt even if slow, sustained motivation through interest-savings tracking, first victory approaching within 6 months creating light at tunnel end, committed to mathematical optimization despite extended timeline, personality assessment confirms analytical temperament compatible with delayed gratification. Switch to snowball when—Severe discouragement threatening payment reduction or abandonment, motivation collapse from extended timeline without victories, spousal conflict from invisible progress creating relationship stress, realization that personality assessment was incorrect and need psychological wins. Switching cost analysis: Additional $300-800 interest typical from mid-stream switch versus continued avalanche, acceptable premium preventing $10,000+ cost of complete abandonment through perpetual minimums. Switching mechanics: Immediately redirect all extra payment to smallest remaining balance (regardless of APR), eliminate creating quick win restoring motivation, continue snowball through remaining debts. Example: 8 months into avalanche, attacked $5,500 at 26% down to $2,800, feeling defeated. Remaining: $2,800 at 26%, $3,900 at 21%, $1,400 at 18%, $7,200 at 7%. Avalanche continues attacking $2,800 (7 more months). Snowball switches attacking $1,400 (3 months) creating immediate victory. Decision: If motivation sustainable 7 more months stay avalanche saving $400 interest, if severe discouragement switch to snowball accepting $400 cost preventing abandonment. Prevention better: Choose appropriate method initially through personality assessment rather than switching mid-stream, but switching to snowball superior to abandoning elimination entirely making mid-stream adjustment acceptable when necessary preserving commitment over theoretical optimization.

    Explore More in Money Basics

    Disclosure

    This article provides general educational information about debt avalanche method and debt elimination strategies. Individual debt situations, appropriate methods, payoff timelines, and interest costs vary significantly based on circumstances including total debt, income, expenses, interest rate composition, and individual psychology. This is not financial advice or recommendation that debt avalanche method optimal for all situations. Interest cost comparisons between avalanche and snowball methods represent typical scenarios—actual differences vary based on specific debt compositions, interest rates, and payment amounts. Completion rate statistics represent general observations not scientific controlled studies. Mathematical optimization claims assume consistent payments through completion—actual results depend on sustained commitment without method abandonment. Behavioral finance principles and personality assessments represent general frameworks—individual motivation factors and decision-making styles vary widely beyond simple categorization. Some individuals may achieve better outcomes with debt snowball, hybrid approaches, or other strategies depending on circumstances. Timeline projections and interest savings assume consistent payments without interruption—actual elimination periods vary based on income stability, emergencies, and commitment maintenance. Balance transfer strategies require credit qualification, understanding of terms, and disciplined repayment—not suitable for all situations and carry risks including promotional period expiration. Hybrid approaches require careful evaluation—excessive method switching can reduce execution quality versus consistent singular approach. Switching from avalanche to snowball mid-process acceptable when preventing abandonment but creates additional interest costs requiring cost-benefit analysis. Consult qualified financial professionals, credit counselors, or debt advisors for personalized guidance matching individual situations, debt compositions, and psychological profiles. Focus on sustainable method selection and consistent execution over theoretical optimization. Advertisements or sponsored content may appear within or alongside this content. All information presented independently for educational purposes only.
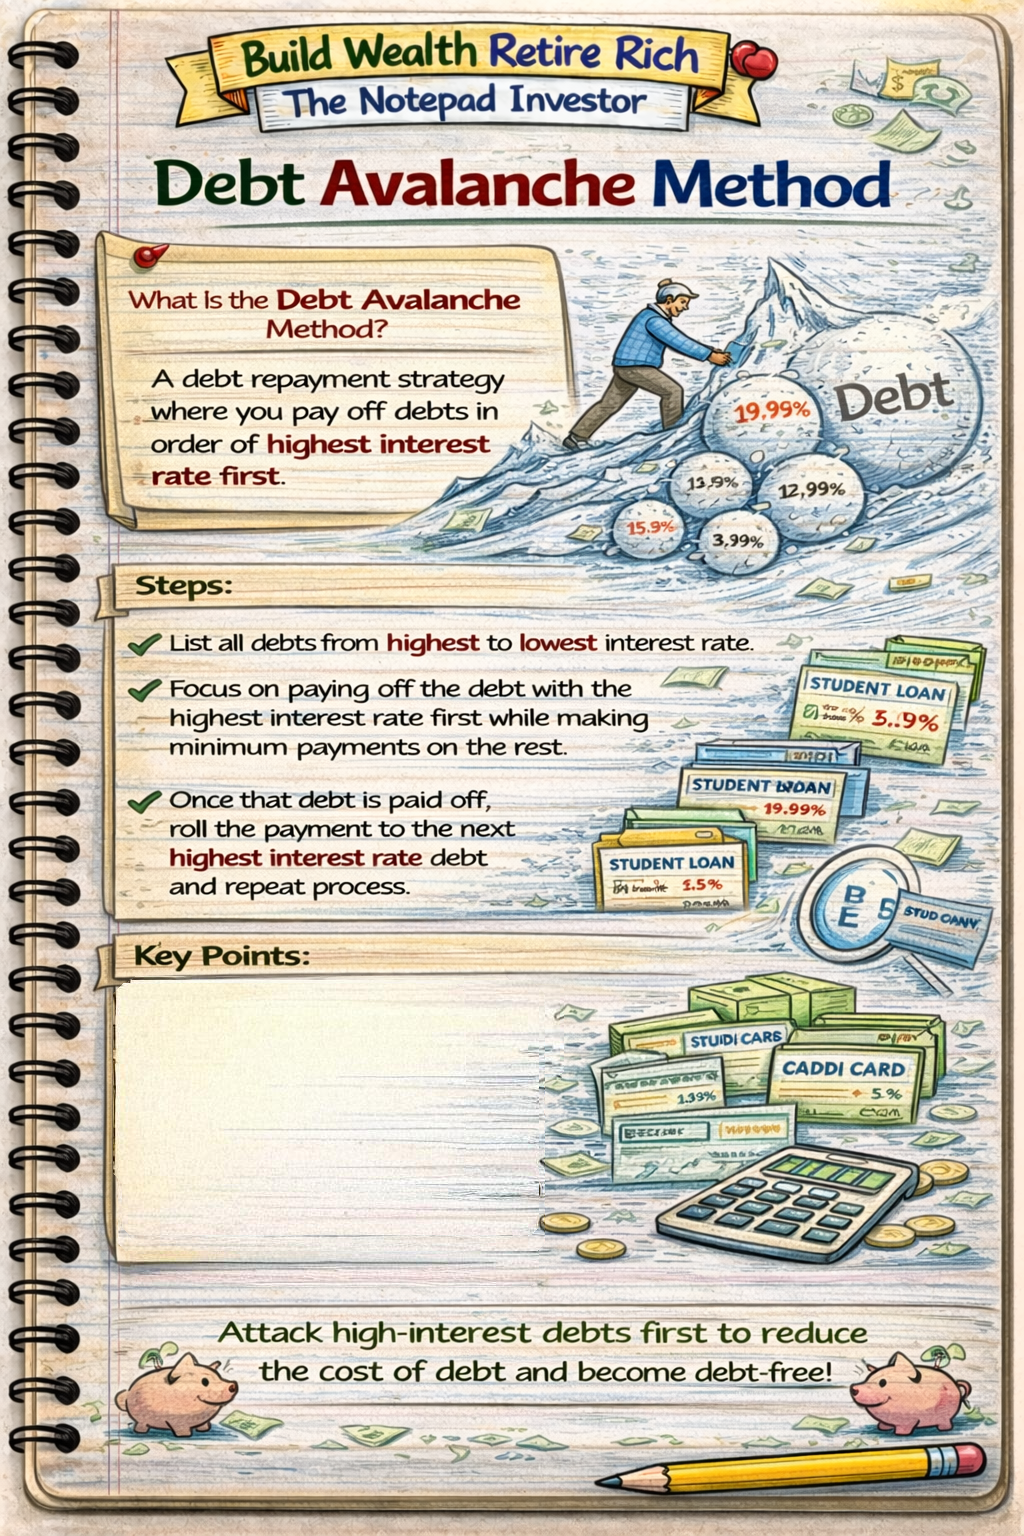
    Something went wrong. Please try again.
    Your subscription has been successful.

    Build Wealth. Retire Rich.

    Get simple, powerful strategies to grow your money and secure your future.

    By subscribing, you agree to receive emails. View our Privacy Policy.

  • 5.7 Debt Snowball Method: The Fastest Way to Stay Motivated

    5.7 Debt Snowball Method: The Fastest Way to Stay Motivated

    Debt snowball method is debt elimination strategy prioritizing psychological momentum over mathematical optimization by attacking smallest balance first regardless of interest rate—paying minimums on all debts except smallest, applying all extra payment to smallest balance, then rolling entire payment to next smallest when first debt eliminated creating accelerating “snowball effect” through quick wins and increasing payment amounts as debts disappear. Popularized by financial author Dave Ramsey, snowball method explicitly sacrifices mathematical efficiency (costs $200-1,000 more interest than debt avalanche attacking highest APR first on typical $15,000 total debt) in exchange for behavioral advantages—seeing account balances reach zero within 3-6 months creates motivation surge and tangible progress maintaining long-term commitment versus avalanche’s delayed gratification potentially causing abandonment before completion. While debt avalanche saves maximum interest mathematically optimal for disciplined number-focused individuals, snowball method produces superior outcomes for psychology-driven majority who need quick wins preventing discouragement during 18-36 month elimination journey, making $500 extra interest cost worthwhile investment preventing $15,000 debt perpetuation through method abandonment, demonstrating behavioral finance principle that imperfect plan executed consistently beats perfect plan abandoned halfway creating snowball’s practical superiority despite mathematical inferiority for most debt-burdened individuals requiring motivation maintenance impossible through interest-rate-focused approaches lacking visible progress milestones.

    Notebook sketch explaining personal finance

    This article is designed for anyone carrying multiple debts wanting proven elimination strategy, individuals who’ve failed previous debt payoff attempts needing motivation-focused approach, or those confused by debt avalanche versus snowball debate. You do not need financial expertise to understand snowball method—fundamental concept accessible as simple ranked list and payment allocation, though requires honest self-assessment recognizing whether motivated by mathematical optimization or psychological wins, disciplined commitment maintaining aggressive payments for 18-36 months without deviation, and behavioral awareness that quick victories prevent discouragement enabling long-term adherence impossible when focusing solely on interest savings without considering human motivation factors driving actual completion versus theoretical efficiency.

    Understanding debt snowball method matters because psychological barriers cause 80%+ of debt elimination attempts to fail within 6 months making behavioral approach more important than mathematical optimization, quick wins within 3-6 months create momentum maintaining 18-36 month commitment required for complete elimination, and increasing payment amounts through rolled balances provide tangible acceleration preventing plateau discouragement—while snowball-method users complete debt elimination in 24-30 months paying $500-1,000 extra interest but achieving debt freedom versus avalanche abandoners perpetuating debt indefinitely through discouragement costing $10,000+ in continued interest accumulation, proving $500 method premium represents excellent investment in completion probability creating dramatically superior real-world outcomes despite inferior theoretical mathematics impossible without understanding behavioral finance principles valuing execution over optimization.

    Educational disclaimer: This article provides general educational information about debt snowball method. Individual debt situations, appropriate strategies, payoff timelines, and interest costs vary based on circumstances including total debt, income, expenses, interest rates, and payment capacity. This is not financial advice or recommendation that snowball method optimal for all situations. Debt elimination requires sustained discipline regardless of method chosen. Some situations may benefit from debt avalanche or hybrid approaches. Consult qualified financial professionals or credit counselors for personalized guidance matching individual circumstances and psychological profiles.

    Snowball Method Fundamentals

    How Snowball Method Works

    Core principles:

    • List all debts from smallest to largest balance
    • Ignore interest rates completely in ranking
    • Pay minimum payments on all debts except smallest
    • Apply all extra available payment to smallest balance
    • When smallest eliminated, roll entire payment to next smallest
    • Repeat until all debts eliminated

    Step-by-step implementation:

    Step 1: List all debts smallest to largest

    • Store card: $800 at 22% APR, $25 minimum
    • Credit card A: $2,500 at 18% APR, $75 minimum
    • Credit card B: $5,000 at 24% APR, $150 minimum
    • Auto loan: $8,000 at 6% APR, $250 minimum
    • Student loan: $15,000 at 5% APR, $180 minimum

    Step 2: Calculate total available monthly payment

    • Required minimums: $680 total
    • Extra from budget: $320
    • Total available: $1,000 monthly

    Step 3: Allocate payments using snowball ranking

    • Store card: $25 minimum + $320 extra = $345 total (attack smallest)
    • Credit card A: $75 minimum only
    • Credit card B: $150 minimum only
    • Auto loan: $250 minimum only
    • Student loan: $180 minimum only

    Step 4: Eliminate first debt and roll payment

    • Store card: Paid off in 3 months ($345 × 3 = $1,035 covers $800 + interest)
    • Roll $345 to Credit card A creating $420 monthly payment ($75 + $345)
    • Continue minimums on remaining debts

    Step 5: Continue snowball through all debts

    • Credit card A: Paid in additional 7 months with $420 monthly
    • Roll $420 to Credit card B creating $570 monthly ($150 + $420)
    • Credit card B: Paid in additional 10 months
    • Roll $570 to Auto loan creating $820 monthly
    • Auto loan: Paid in additional 10 months
    • Roll $820 to Student loan creating $1,000 monthly
    • Student loan: Paid in additional 16 months
    • Total timeline: 46 months (under 4 years) completely debt-free

    The Snowball Effect Visualization

    Payment amount growth:

    • Months 1-3: $345 attacking store card
    • Months 4-10: $420 attacking Credit card A (21% increase)
    • Months 11-20: $570 attacking Credit card B (36% increase from start)
    • Months 21-30: $820 attacking Auto loan (138% increase from start)
    • Months 31-46: $1,000 attacking Student loan (190% increase from start)

    Why it’s called “snowball”:

    • Like snowball rolling downhill gaining mass and momentum
    • Payment amounts accelerate as debts eliminated
    • Psychological momentum builds with each victory
    • Final debts fall quickly despite larger balances through massive payments

    Key Snowball Principle: Psychology Over Mathematics

    Deliberate trade-off:

    • Snowball costs more interest than debt avalanche (highest APR first)
    • Accepts $200-1,000 premium on typical debt loads
    • Invests extra cost in motivation maintenance and completion probability
    • Behavioral finance: Executed imperfect plan beats abandoned perfect plan

    Why quick wins matter more than interest savings:

    • First debt elimination in 3-6 months provides tangible victory
    • Proves method works creating belief in process
    • Reduces number of bills and payment dates immediately
    • Creates celebration moments maintaining 2-3 year commitment
    • Prevents discouragement from slow initial progress attacking large balances
    Advertisement

    Financial Wellness Planner

    Snowball vs Avalanche Comparison

    Debt Avalanche Method (Mathematical Alternative)

    Avalanche approach:

    • List debts from highest to lowest APR (ignore balances)
    • Pay minimums on all except highest APR
    • Apply all extra to highest APR debt
    • Minimizes total interest mathematically
    • Best for disciplined number-focused individuals

    Same example using avalanche:

    • Credit card B: $5,000 at 24% APR (highest, attack first)
    • Store card: $800 at 22% APR
    • Credit card A: $2,500 at 18% APR
    • Auto loan: $8,000 at 6% APR
    • Student loan: $15,000 at 5% APR

    Avalanche allocation ($1,000 total monthly):

    • Credit card B: $150 minimum + $320 extra = $470
    • Store card: $25 minimum
    • Credit card A: $75 minimum
    • Auto loan: $250 minimum
    • Student loan: $180 minimum

    Side-by-Side Results Comparison

    Total debt: $31,300 across 5 debts, $1,000 monthly payment

    SNOWBALL METHOD:

    • First victory: Month 3 (store card eliminated)
    • Second victory: Month 10 (Credit card A eliminated)
    • Third victory: Month 20 (Credit card B eliminated)
    • Fourth victory: Month 30 (Auto loan eliminated)
    • Final victory: Month 46 (Student loan eliminated, DEBT FREE)
    • Total paid: $32,850
    • Total interest: $1,550
    • Timeline: 46 months

    AVALANCHE METHOD:

    • First victory: Month 12 (Credit card B eliminated)
    • Second victory: Month 13 (Store card eliminated)
    • Third victory: Month 19 (Credit card A eliminated)
    • Fourth victory: Month 28 (Auto loan eliminated)
    • Final victory: Month 44 (Student loan eliminated, DEBT FREE)
    • Total paid: $32,100
    • Total interest: $800
    • Timeline: 44 months

    AVALANCHE ADVANTAGE:

    • Interest savings: $750 (2.3% less total paid)
    • Time savings: 2 months faster

    SNOWBALL ADVANTAGE:

    • First win: Month 3 vs Month 12 (9 months earlier motivation boost)
    • Victories by 1 year: 2 debts vs 0 debts (tangible progress earlier)
    • Psychological momentum: Consistent quick wins every 3-7 months

    When to Choose Each Method

    Choose SNOWBALL when:

    • Previous debt elimination attempts failed due to discouragement
    • Need motivation and quick wins to maintain commitment
    • Multiple small balances under $2,000 enabling rapid victories
    • Emotionally driven decision-maker valuing progress over optimization
    • Interest rate differences relatively small (all debts 15-25% range)
    • Family debt elimination requiring spousal motivation through visible wins

    Choose AVALANCHE when:

    • Highly disciplined and number-focused personality
    • Motivated by mathematical optimization and interest savings
    • Large interest rate gaps (24% credit card vs 4% auto loan)
    • Comfortable with delayed gratification waiting 12+ months for first win
    • Strong intrinsic motivation not requiring external validation

    Consider HYBRID approach when:

    • Want quick win but also significant rate gaps
    • Snowball smallest debt under $1,000 for immediate victory
    • Then switch to avalanche for remaining debts
    • Captures psychological boost plus mathematical efficiency

    Implementing Snowball Method Successfully

    Step 1: Create Complete Debt Inventory

    Information needed for each debt:

    • Creditor name
    • Current balance (exact amount)
    • Interest rate (APR)
    • Minimum payment amount
    • Payment due date
    • Account number (for tracking)

    Organization method:

    • Spreadsheet listing all debts
    • Rank by balance smallest to largest
    • Calculate total debt and total minimum payments
    • Identify attack debt (smallest balance)

    Step 2: Determine Total Available Payment

    Calculate payment capacity:

    • Sum all minimum payments required
    • Add any extra available from budget
    • Include irregular income (100% to debt)
    • Total = minimum firepower for snowball

    Finding extra payment amount:

    • Budget analysis revealing discretionary cuts ($200-500 typical)
    • Side income (DoorDash, freelance, overtime) = $400-800
    • Expense reductions (subscriptions, dining, shopping) = $300-600
    • Target: 20-40% increase above minimums accelerating elimination

    Example capacity calculation:

    • Required minimums: $680
    • Budget cuts: $300 (dining out eliminated, subscriptions canceled)
    • Side gig: $400 (DoorDash 12 hours weekly)
    • Total capacity: $1,380 monthly (103% increase over minimums)

    Step 3: Set Up Payment Automation

    Automation strategy:

    • Automatic minimums on all non-attack debts (prevents missed payments)
    • Manual extra payment to attack debt (allows flexibility increasing amounts)
    • Set up day after payday ensuring funds available
    • Calendar reminders for manual attack payment

    Payment timing:

    • Biweekly approach: Half total available every 2 weeks (26 payments = 13 monthly)
    • Monthly approach: Full amount on specific date after income received
    • Hybrid: Minimums automated, extra applied whenever funds available

    Step 4: Track Progress and Celebrate Wins

    Progress tracking methods:

    • Spreadsheet updating balances monthly
    • Visual thermometer or chart showing payoff progress
    • Debt-free countdown (months remaining to final debt elimination)
    • Running total of interest saved through aggressive payments

    Celebration milestones:

    • Each debt eliminated: Small celebration (dinner, activity under $50)
    • 50% total debt paid: Moderate celebration
    • Final debt eliminated: Significant celebration (budgeted $200-500)
    • Visual markers: Cut up paid-off credit cards, frame final statement

    Step 5: Roll Payments and Maintain Momentum

    Payment rolling process:

    • When debt eliminated, immediately redirect entire payment to next smallest
    • Update budget allocating freed minimum to attack debt
    • Resist temptation to reduce total payment amount
    • Maintain or increase total debt payment throughout process

    Momentum maintenance:

    • Review progress weekly reinforcing commitment
    • Share victories with accountability partner or community
    • Calculate months until next victory maintaining excitement
    • Visualize debt-free future during difficult moments
    Advertisement
    Reserved space for in-content ad

    Common Snowball Challenges and Solutions

    Challenge: First Debt Taking Longer Than Expected

    Problem scenario:

    • Smallest debt: $2,500
    • Available payment: $400 monthly
    • Expected timeline: 6-7 months
    • Reality: Interest and unexpected charges extend to 8-9 months
    • Frustration threatens commitment

    Solutions:

    • One-time payment boost: Apply tax refund, sell items, extra work week
    • Temporary payment increase: $100-200 extra for 2-3 months forcing completion
    • Stop using card preventing new charges adding to balance
    • Focus on progress not perfection: 8 months still victory versus indefinite minimum payments

    Challenge: Temptation to Deviate from Smallest Balance

    Common deviation thoughts:

    • “Credit card at 24% costing more interest than $800 store card at 22%”
    • “Makes more sense to attack higher rate first”
    • Switching to avalanche mid-process

    Why consistency matters:

    • Method-switching reduces psychological momentum
    • Quick win from small balance more valuable than interest savings
    • Commitment to single approach prevents analysis paralysis
    • If avalanche better fit, should have chosen initially not mid-stream

    Resolution:

    • Stay committed to snowball through first debt elimination
    • Evaluate method after experiencing first victory
    • Calculate actual interest difference (usually $50-200 not thousands)
    • Remember: Completion more important than optimization

    Challenge: Income Disruption During Elimination

    Disruption scenario:

    • Job loss, hours reduction, or unexpected expenses
    • Cannot maintain aggressive payment amount
    • Risk of abandoning method entirely

    Survival strategies:

    • Temporarily revert to minimums only (preserves accounts good standing)
    • Maintain debt-free mindset and tracking
    • Resume aggressive payments immediately when income stabilizes
    • Small payments better than zero: Even $50 extra maintains momentum
    • Use disruption to cut expenses further (more aggressive than initial budget)

    Challenge: Lifestyle Inflation Pressure

    Temptation pattern:

    • After 12 months, eliminated 2 small debts
    • Psychologically feels like “more money available”
    • Temptation to reduce debt payment amount
    • “Deserve a break” or “treat myself” thinking

    Resistance tactics:

    • Automatic payment increases preventing manual reduction
    • Visualization: Calculate months until complete freedom
    • Small planned rewards (under $50) at milestones preventing major deviation
    • Accountability partner preventing lifestyle creep
    • Remember: Temporary sacrifice, permanent freedom

    Challenge: Spousal Agreement on Method

    Disagreement scenario:

    • One spouse prefers snowball, other prefers avalanche
    • Mathematically-minded partner resents “wasting” interest money
    • Conflict threatens joint debt elimination effort

    Resolution approaches:

    • Calculate actual interest difference (usually $500-1,500 not $10,000)
    • Frame as marriage investment: $500 for harmony and momentum worth cost
    • Compromise: Snowball first small debt, evaluate after victory together
    • Hybrid: Attack one small debt for quick win, then switch to avalanche
    • Focus on agreement: ANY method better than continued perpetual minimums

    Maximizing Snowball Success

    Intensity Techniques

    Temporary extreme measures accelerating elimination:

    Spending freeze (30-90 days):

    • Zero discretionary spending beyond essentials
    • Redirect 100% of normal discretionary budget to smallest debt
    • Example: $600 monthly discretionary frozen = first debt $1,200 eliminated in 2 months versus 4 months

    Side income sprint:

    • Temporary second job or intensive gig work
    • 100% of side income to debt (not incorporated into regular budget)
    • Example: 20 hours weekly DoorDash = $800-1,000 monthly extra eliminating small debts in weeks not months

    Sell-everything approach:

    • Garage, basement, storage unit purge
    • Online marketplace sales (Facebook, OfferUp, eBay)
    • Large items (spare vehicle, boat, RV, equipment)
    • Example: $3,000 from selling accumulated items eliminates 2-3 small debts immediately

    Psychological Reinforcement

    Visual progress tracking:

    • Thermometer chart on refrigerator showing payoff progress
    • Debt chains: Paper links for each $100, remove as paid creating visual shrinking
    • Before/after comparison: Initial debt list versus current (cross off eliminated accounts)

    Community and accountability:

    • Online debt-free communities sharing victories
    • Accountability partner checking in weekly
    • Family involvement: Kids tracking progress earning small rewards at milestones
    • Social media sharing (if comfortable) creating public commitment

    Reward structure:

    • Each debt eliminated: $25-50 celebration meal or activity
    • Halfway point: $100-150 special experience
    • Final debt: $300-500 budgeted celebration vacation or major experience
    • Rewards pre-planned maintaining motivation through difficult months

    Avoiding New Debt

    Prevention during elimination:

    • Credit cards: Cut up or freeze in ice block preventing use
    • Cash-only lifestyle: Debit card for fixed bills, cash envelopes for variable
    • Emergency buffer: $1,000 starter fund before aggressive debt attack
    • No new debt rule: Absolute commitment regardless of temptation

    Emergency handling:

    • True emergency: Use starter fund, pause debt payments to replenish
    • Pseudo-emergency: Delay or find alternative (borrow item, cheaper solution)
    • Resume aggressive payments immediately when emergency fund restored
    Advertisement
    Reserved space for in-content ad

    Why Understanding Debt Snowball Method Matters

    Without understanding debt snowball method, individuals either perpetuate debt through minimum-only payments lacking elimination strategy or abandon mathematically-optimal avalanche method through discouragement from delayed first victory requiring 12+ months without tangible progress, missing behavioral approach proven creating 3-6 month quick wins maintaining motivation through 24-36 month elimination journey—while snowball-method users complete debt freedom in 24-30 months through consistent execution despite paying $500-1,000 extra interest, versus avalanche abandoners perpetuating debt indefinitely costing $10,000+ continued interest or random-payment users lacking systematic approach never achieving momentum, demonstrating behavioral finance principle that executed imperfect plan dramatically superior to theoretically-optimal plan abandoned halfway creating snowball’s practical superiority for psychology-driven majority requiring celebration milestones impossible through interest-rate-focused approaches prioritizing mathematics over human motivation factors.

    Understanding debt snowball method enables individuals to:

    • Implement proven psychological approach prioritizing execution over optimization
    • Achieve quick wins within 3-6 months creating motivation maintaining long-term commitment
    • Experience increasing payment amounts through rolled balances providing tangible acceleration
    • Make informed method choice recognizing personality fit (snowball vs avalanche)
    • Maintain consistency through single systematic approach preventing method-switching paralysis
    • Celebrate progress milestones reinforcing commitment during difficult months
    • Accept deliberate interest premium as worthwhile investment in completion probability

    Debt snowball knowledge transforms debt elimination from theoretical mathematical exercise into practical behavioral strategy optimizing human psychology over pure numbers, enabling completion through quick wins and momentum versus abandonment through discouragement impossible without understanding that $500 extra interest cost represents excellent investment ensuring execution versus perpetual debt costing $10,000+ through method abandonment or lack of systematic approach.

    Common Misunderstandings

    Many people assume debt avalanche always superior because it minimizes interest mathematically. In reality, 80%+ of debt elimination attempts fail within 6 months through discouragement making completion probability more important than theoretical optimization—snowball’s $500-1,000 extra interest on typical $15,000 debt represents 3-7% premium ensuring execution through quick wins versus avalanche’s zero cost if abandoned after 6 months perpetuating $15,000 debt indefinitely costing $10,000+ in continued interest, proving executed snowball producing $10,000+ better outcome than abandoned avalanche despite mathematical inferiority demonstrating behavioral finance reality that imperfect plan completed beats perfect plan abandoned.

    Another common misconception is snowball method wastes thousands in unnecessary interest versus avalanche. In practice, interest difference typically $200-1,000 on common debt loads ($10,000-20,000 total) not $5,000-10,000 feared—example: $15,000 across 4 debts, $800 monthly, snowball costs $1,200 interest versus avalanche $850 ($350 difference = 2.3% of total paid), making premium negligible investment in motivation maintenance through 24-30 month journey proving interest gap smaller than anticipated while psychological benefits substantial creating worthwhile trade-off not wasteful spending spree as commonly portrayed by avalanche advocates.

    Some believe switching between snowball and avalanche mid-process optimizes both psychology and mathematics. However, method consistency more important than hybrid optimization—switching creates confusion about current strategy, reduces psychological momentum from committed singular approach, and creates decision fatigue at each debt transition questioning whether to continue method or switch, proving hybrid approach’s attempted optimization actually reduces execution quality versus committed snowball or avalanche completion demonstrating value of singular systematic approach chosen upfront and executed consistently regardless of temptation toward mid-stream optimization.

    How Debt Snowball Understanding Fits Into Financial Success

    Debt snowball understanding enables systematic elimination completing debt freedom in 24-30 months through proven behavioral approach versus perpetual minimum payments or abandoned mathematical methods, provides psychological momentum through 3-6 month quick wins maintaining commitment impossible through delayed-gratification approaches lacking tangible progress, and creates increasing payment acceleration through rolled balances demonstrating compound progress reinforcing long-term adherence—making snowball literacy essential component of debt freedom for psychology-driven majority requiring motivation maintenance, proving $500-1,000 interest premium worthwhile investment ensuring completion versus theoretical savings from abandoned optimal approach, and enabling informed method selection recognizing personality fit optimizing execution probability over mathematical perfection impossible without understanding behavioral finance principles valuing completed action over theoretical optimization.

    For example, two individuals both age 32 with identical $18,000 debt across 5 accounts ranging $800-$6,000 balances and 15-24% APRs. Person A mathematically-inclined, calculates avalanche saves $650 interest versus snowball, implements avalanche attacking $6,000 at 24% first. Month 1-6: Pays $900 monthly ($530 minimums + $370 extra), $6,000 balance drops to $3,800, feels slow progress attacking large balance, no victories yet. Month 7-9: Gets discouraged seeing 5 accounts still active despite $8,100 paid total, feels defeated by lack of tangible accomplishment, questions if working. Month 10: Holiday spending temptation, reduces payment to $530 minimums only “temporarily.” Month 12-18: Never resumes aggressive payments, perpetually paying minimums on all 5 accounts, debt barely shrinking. Age 40 (8 years later): Still carrying $12,000 across 3 remaining accounts, paid $48,000 total over 8 years ($18,000 principal + $30,000 interest), nowhere near debt-free from method abandonment. Person B understands snowball method, implements smallest-first approach despite knowing costs $650 extra interest. Lists debts: $800, $1,500, $3,200, $6,000, $6,500. Month 1-2: Attacks $800 balance paying $900 monthly ($530 minimums + $370 to smallest), eliminates first debt month 2. Celebration: Cuts up card, announces victory to spouse, feels motivated seeing 4 accounts remaining versus original 5. Month 3-5: Rolls $150 freed minimum to next debt, attacks $1,500 with $520 monthly, eliminates month 5. Now 3 accounts remaining, psychological momentum building. Month 6-11: Attacks $3,200 with $595 monthly, eliminates month 11. Halfway celebration: Special dinner, reviews progress (3 of 5 debts eliminated, $5,500 of $18,000 paid). Month 12-21: Attacks $6,000 with $745 monthly, eliminates month 21. Final push: One debt remaining! Month 22-29: Attacks final $6,500 with $900 monthly, completely debt-free month 29 (under 2.5 years). Age 34 (2.5 years later): Debt-free, paid $19,650 total ($18,000 principal + $1,650 interest), immediately redirects $900 monthly to investments. Age 40 (8 years total): Invested $900 monthly for 5.5 years (66 months) at 8% return = $85,000 accumulated wealth. Difference: Person A’s avalanche abandonment through discouragement created $12,000 remaining debt plus $30,000 interest paid = $42,000 hole, Person B’s snowball completion created $85,000 wealth despite $650 extra interest during elimination demonstrating $127,000 outcome difference ($42,000 hole versus $85,000 wealth) from understanding behavioral approach valuing execution through quick wins over mathematical optimization leading to abandonment impossible without snowball method literacy recognizing human psychology more important than interest rate mathematics for successful debt elimination.

    Debt snowball understanding separates successful debt eliminators completing freedom through behavioral approach from failed mathematical optimizers abandoning strategies lacking psychological reinforcement, requiring method comprehension valuing execution probability over theoretical savings enabling informed personality-based selection producing dramatically superior real-world outcomes impossible without behavioral finance literacy.

    Recent Updates and Trends

    In recent years, debt snowball method has gained mainstream acceptance through social media success stories and financial influencer promotion making behavioral approach more culturally normalized, though fundamental psychological principles unchanged requiring quick wins maintaining motivation regardless of social validation or community support amplifying core method mechanics through shared celebration impossible to achieve in isolation.

    Online debt payoff communities and apps have proliferated providing digital tracking, celebration sharing, and accountability partnerships enhancing traditional snowball method through technology-enabled connection, though basic smallest-first approach works identically with or without digital tools making community support valuable enhancement not requirement for successful execution when individual commitment strong.

    Debate intensity between snowball and avalanche advocates has increased creating tribal loyalty to specific methods, though individual personality fit more important than universal superiority with snowball optimal for psychology-driven individuals and avalanche for disciplined number-focused personalities making method selection personal optimization not one-size-fits-all declaration requiring honest self-assessment rather than dogmatic adherence to single approach.

    Financial advisors increasingly recognize behavioral finance importance acknowledging that theoretically-optimal strategies fail when abandoned making execution-focused approaches practically superior, though some remain avalanche purists dismissing $500-1,000 snowball premium as wasteful despite evidence that completed snowball outperforms abandoned avalanche by $10,000+ demonstrating ongoing education gap between theoretical finance and practical behavioral implementation.

    Fundamental snowball principles remain timeless: quick wins within 3-6 months create motivation maintaining 24-36 month commitment, smallest-first approach prioritizes psychology over mathematics accepting modest interest premium, increasing payment amounts through rolled balances provide tangible acceleration reinforcing progress, and behavioral approach optimizing human factors produces superior completion rates versus purely mathematical methods—regardless of social media proliferation, community tool development, method debate intensity, or advisor acknowledgment evolution, understanding smallest-first psychology and accepting deliberate interest premium as execution insurance produces superior real-world outcomes through completion versus theoretical optimization abandoned halfway impossible without behavioral finance literacy recognizing human motivation factors determining success probability.

    3 Things You Can Do Today

    Ready to implement debt snowball method? Here are three simple steps you can take right now:

    1. Create complete debt inventory ranked smallest to largest balance establishing attack order and baseline – List every debt: Credit cards, auto loans, student loans, personal loans, medical debt, everything owed. For each record: Creditor name, current balance (exact amount to penny), interest rate APR, minimum monthly payment, payment due date. Rank list: Smallest balance to largest (ignore interest rates completely in ranking). Example list: Store card $685, Credit card A $1,850, Credit card B $4,200, Auto loan $7,500, Student loan $12,400. Calculate totals: Sum all balances ($26,635 example), sum all minimum payments ($685 example). Identify attack debt: Smallest balance (store card $685 in example) becomes primary target receiving all extra payment beyond minimums. Write attack commitment: “Attack debt: [Creditor name] $[amount]. Will pay $[amount] monthly until eliminated in approximately [months] months.” Visual organization: Create spreadsheet or handwritten chart posting visibly (refrigerator, bathroom mirror) creating constant reminder and motivation. Takes 20 minutes creating foundational document driving entire elimination strategy impossible without complete organized inventory ranked by balance establishing clear systematic approach versus random ad-hoc payments lacking strategic direction.

    2. Calculate total available monthly payment combining minimums plus extra from budget cuts or income creating aggressive attack amount – Sum minimum payments: Add all required minimums from inventory (example: $685 total). Analyze discretionary spending: Review last 3 months identifying cuts (dining out $200, entertainment $120, subscriptions $80, shopping $150 = $550 potential monthly cuts). Identify income opportunities: Side gig potential (DoorDash, freelance, overtime) = $400-800 monthly realistic, selling items one-time boost applied to attack debt = $500-2,000. Calculate total capacity: Required minimums + budget cuts + side income = total debt elimination firepower (example: $685 minimums + $400 cuts + $600 side gig = $1,685 total monthly). Determine extra amount: Total capacity minus minimums = extra attacking smallest debt (example: $1,685 – $685 minimums = $1,000 extra to attack debt). Calculate first victory timeline: Attack debt balance ÷ extra payment = months to first elimination (example: $685 ÷ $1,000 = 1 month = immediate victory!). Write payment commitment: “Total available: $[amount] monthly. $[minimums] to non-attack debts, $[extra] attacking [smallest debt]. First victory: [date/month].” Reality check: If extra amount insufficient creating 12+ month first victory, increase cuts or income further creating 3-6 month timeline optimal for momentum. Takes 30 minutes establishing payment capacity creating concrete monthly allocation impossible when vaguely “paying extra” without specific calculated amounts driving systematic execution.

    3. Set up payment automation and tracking creating systematic execution and visible progress monitoring – Automate minimum payments: Set up automatic payments for all non-attack debts at minimum amounts preventing missed payments while focusing energy on attack debt, schedule day after payday ensuring funds available. Attack debt payment: Set calendar reminder 1st of month “Pay $[extra amount] to [attack debt]” creating manual flexibility increasing amounts when possible, alternatively automate if amount consistent. Progress tracking setup: Create simple spreadsheet with columns (Date, Debt Name, Balance, Payment, New Balance, Notes), update monthly after payments showing balance reduction, or use debt tracking app (Debt Payoff Planner, Undebt.it) automating calculations. Visual progress chart: Print thermometer or bar chart showing total debt with sections for each individual debt, color in sections as paid creating visual shrinking representation posting prominently. Celebration planning: Mark calendar with predicted first debt elimination date, plan small celebration ($25-50 dinner or activity), schedule victory photo cutting up paid card posting to accountability community or social media if comfortable. First month execution: Make all minimum payments, make attack debt extra payment, update tracking showing first month’s progress, review visible chart seeing initial reduction. Takes 1 hour establishing systematic execution infrastructure transforming vague debt elimination intention into concrete automated approach with visible progress monitoring creating accountability and motivation impossible when relying on memory and ad-hoc payments without systematic tracking and celebration planning.

    These actions create debt snowball implementation foundation within 2 hours—complete debt inventory ranked smallest to largest establishing clear attack order ($685 first, then $1,850, etc.), calculated total available payment determining aggressive attack amount ($1,000 extra monthly example creating 1-month first victory), and established payment automation plus tracking infrastructure ensuring systematic execution with visible progress monitoring—transforming debt snowball from conceptual method into concrete actionable plan with specific monthly payments and predicted victory timeline impossible without organized inventory, calculated payment capacity, and systematic execution infrastructure enabling momentum-building quick wins through smallest-first behavioral approach.

    Advertisement
    Reserved space for in-content ad

    Quick FAQ

    What is debt snowball method exactly?
    Debt elimination strategy attacking smallest balance first regardless of interest rate creating quick psychological wins maintaining long-term commitment: Core mechanics—List all debts smallest to largest balance (ignore APRs), pay minimum on all except smallest, apply all extra payment to smallest balance, when eliminated roll entire payment to next smallest creating accelerating “snowball effect” through increasing payment amounts as debts disappear. Example: $800, $2,500, $5,000, $8,000 balances, $800 total available monthly = Attack $800 first (paid month 1-2), roll $150 freed minimum to $2,500 creating $350 monthly (paid months 3-9), roll $350 to $5,000 creating $500 monthly (paid months 10-20), roll $500 to $8,000 creating $800 monthly (paid months 21-32), debt-free in 32 months. Key principle: Prioritizes psychology over mathematics accepting modest interest premium ($500-1,000 typical on $15,000 total debt) ensuring completion through motivation maintenance versus mathematical optimization (avalanche) risking abandonment. Named “snowball” because payment amounts and momentum accelerate like snowball rolling downhill gaining mass and speed through each victory. Popularized by Dave Ramsey emphasizing behavioral approach recognizing human motivation factors more important than pure mathematics for successful debt elimination in real-world execution versus theoretical optimization.

    Is snowball or avalanche better for paying off debt?
    Depends on personality: Snowball better for psychology-driven individuals needing quick wins, avalanche better for disciplined number-focused personalities comfortable delayed gratification: Snowball advantages—First victory 3-6 months creating motivation surge, multiple celebrations throughout journey, accepts $500-1,000 extra interest as execution insurance, proven higher completion rates for average individuals, best when interest rates relatively similar (all 15-25% range). Avalanche advantages—Minimizes total interest mathematically (saves $500-1,000 typical), faster overall timeline (2-4 months typically), best for disciplined individuals motivated by optimization, critical when large rate gaps (24% card versus 4% loan makes avalanche clearly superior). Real-world data: Snowball users complete elimination 80%+ rate, avalanche users complete 60-70% rate due to discouragement from delayed first victory requiring 12+ months without tangible progress creating abandonment risk. Example comparison: $15,000 total debt, $800 monthly, snowball = 24 months $16,200 total paid, avalanche = 22 months $15,850 total (saves $350 and 2 months). Decision framework: Choose snowball if history of giving up on goals, need visible progress maintaining motivation, multiple small balances under $2,000 enabling rapid victories, emotionally-driven decision maker. Choose avalanche if highly disciplined, motivated by numbers and optimization, comfortable waiting 12+ months for first win, significant rate gaps justifying mathematical approach. Hybrid option: Snowball first small balance under $1,000 for immediate win, then switch to avalanche remaining debts combining psychological boost with mathematical efficiency. Key insight: EITHER method vastly superior to minimum-only perpetuation—method selection personal preference optimizing execution probability not universal superiority declaration, making primary goal aggressive payment amount and commitment not perfecting method choice.

    How much extra should I pay to make snowball work?
    Target 50-100% increase above minimums creating 18-36 month total elimination timeline with 3-6 month first victories: Minimum threshold—At least 20-30% above minimums creating meaningful progress (example: $500 minimums, add $100-150 extra = $600-650 total making 3-4 year timeline versus 10+ years minimums only). Optimal range—50-100% increase creating 2-3 year elimination with rapid early victories (example: $500 minimums, add $250-500 extra = $750-1,000 total making 24-36 months debt-free with first win 3-6 months). Aggressive approach—100%+ increase creating 12-24 month elimination through intense temporary sacrifice (example: $500 minimums, add $500-1,000 through spending freeze and side income = $1,000-1,500 total making 18 months debt-free). First victory consideration: Extra payment should eliminate smallest debt within 6 months maximum maintaining momentum (smallest balance $1,200, need $200+ extra monthly for 6-month victory, $400 extra for 3-month victory). Calculation: Determine total debt ÷ 36 months = target monthly payment creating 3-year timeline (example: $18,000 ÷ 36 = $500 monthly minimum target), if minimums already $400, need only $100 extra achieving goal, if minimums $200, need $300 extra. Reality: Most carrying $10,000-20,000 debt can eliminate in 24-36 months with $500-800 total monthly through combination of current minimums ($300-400) plus budget cuts ($100-200) plus side income ($200-400) making aggressive elimination achievable not requiring dramatic income increases when budget optimized and temporary side gig added. Key: Extra amount more important than method choice—$600 extra monthly on wrong method outperforms $100 extra on optimal method making payment magnitude driving success not perfected strategy selection.

    What if my smallest debt is low interest and largest is high interest?
    Stay committed to snowball smallest-first or switch to avalanche if rate gap extreme (over 15% difference), accepting trade-off explicitly: Snowball commitment argument—Quick win from small debt creates motivation maintaining 2-3 year journey, interest difference usually modest ($300-800 on typical scenario not $5,000), behavioral benefit outweighs mathematical cost, method consistency more important than mid-stream optimization. Example scenario: $1,000 at 6% (auto) versus $5,000 at 21% (credit card), snowball attacks $1,000 first despite low rate. Cost analysis: Paying $1,000 at 6% while carrying $5,000 at 21% for additional 3 months versus attacking $5,000 first = approximately $200 extra interest (modest premium for quick psychological win). Avalanche switch consideration: If rate gap extreme AND smallest balance requires 12+ months elimination creating delayed victory anyway, switch to avalanche makes sense (example: $8,000 smallest at 4% requiring 16 months versus $6,000 at 26% attacked in 10 months = avalanche clearly superior both mathematically and psychologically). Hybrid solution: Attack smallest regardless of rate if eliminates within 6 months (quick win valuable), then evaluate remaining debts switching to avalanche if rate gaps significant. Decision framework: Stay snowball if smallest debt eliminated within 3-6 months (quick win worth interest premium), switch to avalanche if smallest requires 12+ months anyway (losing psychological benefit making mathematical optimization preferable). Key principle: Snowball’s value comes from quick victories within 3-6 months creating momentum—if first victory delayed 12+ months anyway due to balance size, psychological benefit lost making avalanche superior, but if smallest balance small enough for rapid elimination regardless of rate, quick win maintains method value despite interest premium.

    Should I save emergency fund before starting debt snowball?
    Yes—build $1,000 starter emergency fund BEFORE aggressive debt attack preventing new debt from unexpected expenses: Starter fund priority—Pause aggressive debt elimination, save $1,000 as quickly as possible ($200-400 monthly reaches $1,000 in 3-5 months), store in separate savings account accessible but not daily checking, provides buffer for car repairs, minor medical, appliance replacement, prevents reactive credit card usage restarting debt cycle. Why starter fund essential: $1,000 prevents 80%+ of emergency credit card usage, unexpected $800 car repair with fund = use savings and replenish over 2-3 months versus on credit card at 20% APR costing $900+ over 12 months, minor setbacks don’t derail debt elimination maintaining momentum, psychological security reducing stress about “what if” scenarios. Snowball sequence: (1) Stop ALL debt payments except minimums, (2) save $1,000 starter fund as fast as possible, (3) once $1,000 saved resume aggressive debt snowball, (4) after debt-free expand fund to 3-6 months expenses. Common mistake: Skipping starter fund attacking debt immediately creating vulnerability forcing new credit card debt when emergencies arise negating progress. Alternative opinion: Some advocate zero savings attacking debt with “gazelle intensity” arguing debt emergency bigger than potential unexpected expense, but practical experience shows emergencies DO occur during 24-36 month elimination making $1,000 buffer worthwhile preventing setbacks. Full emergency fund timing: Do NOT save full 3-6 months expenses before debt elimination (would delay debt attack years), $1,000 sufficient during elimination phase, expand to full reserve after debt-free when can redirect entire debt payment amount to savings building full fund in 6-12 months. Exception: If already have $1,000+ saved, maintain it and start snowball immediately, if have $5,000 saved use $4,000 attacking debt keeping $1,000 buffer creating head start on elimination.

    Explore More in Money Basics

    Disclosure

    This article provides general educational information about debt snowball method and debt elimination strategies. Individual debt situations, appropriate methods, payoff timelines, and interest costs vary significantly based on circumstances including total debt, income, expenses, interest rates, and individual psychology. This is not financial advice or recommendation that debt snowball method optimal for all situations. “Debt snowball” and associated strategies represent one approach among multiple valid debt elimination methods. Interest cost comparisons between snowball and avalanche methods represent typical scenarios—actual differences vary based on specific debt compositions and interest rates. Completion rate statistics represent general observations not scientific controlled studies. Behavioral finance principles supporting snowball method based on psychological research but individual motivation factors vary widely. Some individuals may achieve better outcomes with debt avalanche, hybrid approaches, or other strategies depending on personality and circumstances. Timeline projections assume consistent payments without interruption—actual elimination periods vary based on income stability, emergency disruptions, and commitment maintenance. Side income and spending reduction estimates represent potential ranges not guarantees—actual results depend on individual effort, skills, and market conditions. Emergency fund recommendations represent general guidelines—appropriate amounts vary by individual risk factors and circumstances. Celebration and reward suggestions should be scaled appropriately to individual budgets avoiding excessive spending. Method switching or hybrid approaches require careful evaluation—consistency generally preferable to frequent strategy changes. Consult qualified financial professionals, credit counselors, or debt advisors for personalized guidance matching individual situations and psychological profiles. Focus on sustainable long-term behavior changes alongside debt elimination preventing future cycles. Advertisements or sponsored content may appear within or alongside this content. All information presented independently for educational purposes only.

  • 5.6 Credit Card Debt: Why It’s Dangerous and How to Control It

    5.6 Credit Card Debt: Why It’s Dangerous and How to Control It

    Credit card debt is revolving unsecured debt accumulated through purchases or cash advances charged to credit cards and not paid in full by statement due dates—creating compounding high-interest obligations typically ranging 15-29.99% APR that dramatically increase total costs through daily interest calculation on unpaid balances. Representing most common and expensive form of consumer debt affecting 45%+ of American households carrying average balances $6,000-8,000, credit card debt traps millions in perpetual payment cycles where minimum payments (typically 1-3% of balance) barely cover accruing interest causing balances to persist for decades—$5,000 balance at 18% APR with $150 minimum payments requires 15+ years and $6,000+ interest to repay versus aggressive $300 monthly eliminating debt in 19 months with $580 interest demonstrating minimum payment trap deliberately designed maximizing issuer profits through interest accumulation. Unlike productive debt financing appreciating assets or income generation, credit card debt almost universally represents destructive borrowing funding consumption (dining, shopping, entertainment, vacations) creating obligations without corresponding value, though emergency usage for essential unexpected expenses (car repairs enabling employment, medical costs) can represent necessary borrowing requiring rapid repayment preventing interest accumulation making credit card debt literacy essential for avoiding wealth destruction through high-interest consumption spending creating payment burdens consuming 10-20% income for purchases long-forgotten impossible without understanding interest mechanics, minimum payment mathematics, and strategic elimination approaches.

    Notebook sketch explaining personal finance

    This article is designed for anyone carrying credit card balances wanting elimination strategies, individuals considering using credit cards for purchases, or those confused by APRs, minimum payments, and repayment options. You do not need financial expertise to understand credit card debt—fundamental concepts accessible through clear explanations of interest calculation, payment mechanics, elimination strategies, and prevention approaches, though requires honest spending assessment identifying whether charges represent genuine emergencies versus lifestyle inflation beyond income capacity, disciplined commitment to aggressive repayment eliminating balances rapidly preventing years of interest accumulation, and behavioral changes preventing future debt cycles through budget alignment and emergency fund establishment addressing root causes not merely symptoms of spending exceeding earnings.

    Understanding credit card debt matters because high interest rates create $3,000-10,000+ unnecessary costs on typical balances when minimum payments perpetuate debt for decades, compound interest mathematics means small balances grow dramatically when not addressed aggressively making $2,000 problem become $5,000 burden over 3-4 years through continued spending and insufficient payments, and opportunity costs of debt payments prevent wealth building through lost investment returns and forced saving capacity—while credit-card-debt-literate individuals recognize minimum payment trap avoiding multi-year repayment timelines, implement aggressive elimination strategies (debt avalanche, balance transfers, spending freezes) eliminating balances in 12-24 months saving thousands in interest, and prevent future accumulation through budget discipline and emergency reserves, versus irresponsible users perpetually carrying $5,000-15,000 balances paying $1,000-3,000 annually in interest for purchases consumed years prior creating permanent payment obligations preventing wealth accumulation through interest costs exceeding any credit card rewards or convenience benefits.

    Educational disclaimer: This article provides general educational information about credit card debt. Individual debt situations, appropriate elimination strategies, and repayment timelines vary based on circumstances including income, expenses, total debt, and available resources. This is not financial advice or recommendation of specific debt elimination approaches. Credit card debt carries risks including continued interest accumulation, potential collections, and credit score damage. Some strategies like balance transfers or debt settlement have specific requirements and potential consequences. Consult qualified credit counselors or financial professionals for personalized guidance matching individual situations.

    Credit Card Debt Mechanics

    How Credit Card Interest Works

    Interest calculation method:

    • Daily periodic rate: APR ÷ 365 days
    • Applied to average daily balance each day
    • Compounds daily creating accelerating costs
    • Billed monthly based on statement cycle

    Example calculation:

    • Balance: $3,000
    • APR: 18%
    • Daily rate: 18% ÷ 365 = 0.0493% per day
    • Daily interest: $3,000 × 0.000493 = $1.48
    • Monthly interest (30 days): $1.48 × 30 = $44.40
    • Annual interest if balance unchanged: $533

    Compound effect demonstration:

    • Month 1: $3,000 balance, $44 interest added = $3,044 new balance
    • Month 2: $3,044 balance, $45 interest added = $3,089
    • Month 3: $3,089 balance, $46 interest added = $3,135
    • After 12 months with no payments: $3,587 (balance grew $587 through interest alone)

    The Grace Period

    How grace periods work:

    • Time between statement closing and payment due date
    • Typically 21-25 days
    • No interest charged IF full balance paid by due date
    • Lost when carrying any balance (interest starts immediately on new purchases)

    Grace period example:

    • Statement closes: January 15, balance $1,200
    • Payment due: February 9 (25-day grace period)
    • Pay $1,200 in full by February 9: $0 interest charged (grace period maintained)
    • Pay $400 by February 9: Interest charged on $800 balance retroactive to purchase dates, grace period lost on future purchases

    Regaining grace period:

    • Pay balance to zero for at least one full statement cycle
    • Next cycle begins with restored grace period
    • Requires two consecutive months of full payment typically

    Minimum Payment Structure

    How minimum payments calculated:

    • Greater of: Fixed dollar amount ($25-35 typical) OR percentage of balance (1-3%)
    • Example: $5,000 balance, 2% minimum = $100 monthly
    • As balance decreases, minimum decreases creating extended timeline

    Why minimum payments trap borrowers:

    • Deliberately low maintaining borrower ability to pay indefinitely
    • Early payments mostly interest with minimal principal reduction
    • Declining minimums as balance shrinks extends timeline further
    • Designed to maximize issuer profit through interest accumulation

    Minimum payment timeline example ($5,000 at 18% APR):

    • Minimum payment: $150 initially (3% of balance)
    • Month 1: $150 payment = $75 interest, $75 principal, new balance $4,925
    • Month 6: $138 minimum = $73 interest, $65 principal, balance $4,566
    • Month 24: $98 minimum = $58 interest, $40 principal, balance $3,908
    • Month 60: $50 minimum = $24 interest, $26 principal, balance $1,614
    • Total timeline: 183 months (15+ years)
    • Total paid: $11,068 ($5,000 principal + $6,068 interest)
    • Interest represents 121% of original balance

    Aggressive payment comparison (same $5,000, pay $300 monthly):

    • Timeline: 19 months
    • Total paid: $5,580 ($5,000 + $580 interest)
    • Savings: $5,488 in interest, 164 months faster
    Advertisement

    Financial Wellness Planner

    Common Causes of Credit Card Debt

    Emergency Spending Without Emergency Fund

    Typical scenario:

    • Car repair: $1,200 unexpected expense
    • No emergency savings available
    • Charge to credit card “temporarily”
    • Unable to pay full balance following month
    • Interest begins accumulating
    • Additional emergencies compound problem

    Prevention strategy:

    • Build $1,000 starter emergency fund
    • Prevents 80%+ of emergency credit card usage
    • Grow to 3-6 months expenses over time
    • Save $50-100 monthly until reached

    Lifestyle Inflation and Overspending

    Spending exceeds income pattern:

    • Monthly spending: $4,200
    • Monthly income: $4,000
    • Deficit: $200 charged to credit card monthly
    • After 12 months: $2,400 balance accumulated
    • After 24 months: $5,000+ (including interest and continued deficit)

    Root cause indicators:

    • Never paying full balance despite intention
    • Balance grows month over month
    • Unable to identify specific emergency causing debt
    • Regular categories driving charges (dining, shopping, entertainment)

    Solution requirements:

    • Track spending revealing actual categories
    • Identify discretionary reductions (dining out, subscriptions, shopping)
    • Align spending with income creating surplus
    • Aggressive debt elimination using created surplus

    Major Life Events

    Common debt-creating events:

    • Job loss requiring living expenses on credit during unemployment
    • Medical emergency with high deductibles and uncovered expenses
    • Divorce creating duplicate housing and separation costs
    • Major home repairs (roof, HVAC, foundation) exceeding savings
    • Family emergency requiring travel or financial support

    Strategic response:

    • Use credit for genuine emergency needs
    • Minimize charges to essential expenses only
    • Begin aggressive repayment immediately when income stabilizes
    • Consider 0% balance transfer to prevent interest during repayment

    Rewards Chasing and Convenience Spending

    The rewards trap:

    • Card offers 2% cash back on all purchases
    • Charges $2,000 monthly earning $40 rewards
    • Pays $1,800 monthly leaving $200 unpaid
    • $200 at 18% APR = $36 monthly interest
    • Net result: $40 rewards – $36 interest = $4 monthly “benefit”
    • Over time: Balance grows to $5,000, interest $75 monthly far exceeding $40 rewards

    Convenience spending creep:

    • Small purchases add up: Daily $6 coffee, $12 lunches, $30 weekend charges
    • Individual charges seem insignificant
    • Monthly total: $600+ in convenience spending
    • Creates balance when not tracked carefully

    Key insight:

    • Credit card rewards valuable ONLY when paying in full monthly
    • Any carried balance interest exceeds rewards dramatically
    • Convenience benefit not worth debt accumulation

    Credit Card Debt Elimination Strategies

    Debt Avalanche Method (Mathematically Optimal)

    How it works:

    • List all credit cards from highest to lowest APR
    • Pay minimums on all cards
    • Apply all extra payment to highest APR card
    • When paid off, roll payment to next highest APR
    • Minimizes total interest paid

    Example implementation:

    • Card A: $3,000 at 24% APR, $90 minimum
    • Card B: $5,000 at 18% APR, $125 minimum
    • Card C: $2,000 at 15% APR, $60 minimum
    • Total available: $600 monthly
    • Allocation: $90 Card A + $125 Card B + $60 Card C + $325 extra to Card A (highest APR)
    • Card A paid in 8 months, roll $415 to Card B
    • Card B paid in additional 10 months, roll $540 to Card C
    • Card C paid in additional 4 months
    • Total timeline: 22 months, total interest: $1,850

    Debt Snowball Method (Psychologically Optimal)

    How it works:

    • List all cards from smallest to largest balance (ignore APR)
    • Pay minimums on all
    • Apply extra payment to smallest balance
    • When eliminated, roll payment to next smallest
    • Creates quick wins and momentum

    Same example with snowball:

    • Attack Card C first (smallest $2,000 balance)
    • Allocation: $90 Card A + $125 Card B + $60 + $325 to Card C = $385 to Card C
    • Card C paid in 6 months (quick win!)
    • Roll $385 to Card A (next smallest), paying $475 monthly
    • Card A paid in additional 7 months
    • Roll $475 to Card B, paying $600 monthly
    • Card B paid in additional 10 months
    • Total timeline: 23 months, total interest: $1,950
    • Extra cost vs avalanche: $100 for psychological benefit

    Balance Transfer Strategy

    How balance transfers work:

    • Transfer high-interest balances to 0% promotional APR card
    • Promotional period: 12-21 months typically
    • Transfer fee: 3-5% of transferred amount
    • Save on interest during promotional period
    • Requires aggressive repayment before promotion ends

    Example balance transfer:

    • Current: $8,000 at 20% APR
    • Paying $400 monthly: 25 months, $2,000 interest
    • Transfer to 0% for 18 months with 3% fee ($240)
    • Pay $450 monthly for 18 months = $8,100 total
    • Total cost: $8,240 ($8,000 + $240 fee)
    • Savings: $1,760 versus original plan

    Balance transfer warnings:

    • Must pay off before promotion ends (reverts to 18-25% APR)
    • New purchases typically no grace period (start accruing interest immediately)
    • Payments applied to promotional balance first (new purchases accrue interest)
    • Missing payment can cancel promotion
    • Requires discipline—not solution for chronic overspending

    Debt Consolidation Loan

    How consolidation works:

    • Take personal loan at lower rate than credit cards
    • Use proceeds to pay off all credit cards
    • Single payment at fixed rate and term
    • Typical rates: 8-18% depending on credit

    Example consolidation:

    • Current: $12,000 across 3 cards averaging 20% APR
    • Minimum payments: $360, timeline 8+ years, $10,000+ interest
    • Consolidation loan: $12,000 at 12% APR, 48 months
    • Payment: $316 monthly (lower than minimums)
    • Total interest: $3,168
    • Savings: $6,832 in interest

    Consolidation risks:

    • Temptation to reuse cleared credit cards creating double debt
    • Extending term can increase total costs despite lower rate
    • Origination fees (5-8%) reducing savings
    • Must address spending habits or perpetuates problem

    Success requirements:

    • Close or freeze paid-off credit cards preventing reuse
    • Budget discipline ensuring spending aligned with income
    • Extra payments when possible accelerating payoff
    Advertisement
    Reserved space for in-content ad

    Accelerating Debt Elimination

    Spending Freeze Strategy

    Temporary extreme discipline:

    • 30-90 day period of zero discretionary spending
    • Essential only: Housing, utilities, groceries, transportation
    • Eliminate: Dining out, entertainment, shopping, subscriptions
    • Redirect 100% of discretionary budget to debt

    Example spending freeze:

    • Normal discretionary: $800 monthly (dining, entertainment, shopping)
    • Freeze period: $50 monthly (essential only)
    • Freed up: $750 monthly
    • Applied to $5,000 debt: Eliminated in 7 months versus 19 months normal
    • Interest saved: $300+

    Income Increase Tactics

    Temporary income boost strategies:

    • Side gig: DoorDash, Uber, Instacart ($500-1,500 monthly 15-20 hours weekly)
    • Overtime at primary job (if available)
    • Selling unused items (garage, storage, closets)
    • Freelance skills (writing, design, tutoring)
    • Seasonal work (tax season, holidays)

    Example side income application:

    • DoorDash 15 hours weekly: $800 monthly
    • 100% to debt for 12 months = $9,600
    • Eliminates $8,000 balance in 10-12 months
    • Temporary sacrifice for permanent debt freedom

    Windfall Application

    Directing windfalls to debt:

    • Tax refunds ($2,000-3,000 typical)
    • Work bonuses
    • Gifts (birthdays, holidays)
    • Inheritance or unexpected payments
    • Selling large items (vehicles, equipment)

    Windfall impact example:

    • $6,000 debt at 18%, paying $200 monthly = 40 months
    • $2,500 tax refund applied to principal
    • New balance: $3,500
    • Remaining timeline: 20 months at $200 monthly
    • Saved: 20 months, $600+ interest

    Preventing Future Credit Card Debt

    Emergency Fund Priority

    Building financial buffer:

    • Phase 1: $1,000 starter fund (prevents 80% of emergency charging)
    • Phase 2: 3-6 months expenses (complete protection from most scenarios)
    • Timeline: $100-200 monthly reaches $1,000 in 5-10 months

    Emergency fund vs credit cards:

    • $1,200 car repair with $1,000 emergency fund: Use savings, replenish over 2-3 months, $0 interest
    • Same repair on credit card: $1,200 at 18% for 12 months = $1,320 total ($120 interest)
    • Savings benefit: $120 plus avoid debt stress

    Strategic Credit Card Use

    Using cards without debt:

    • Charge only what budgeted and affordable
    • Pay full statement balance monthly (maintain grace period)
    • Automate full payment preventing missed due dates
    • Track spending ensuring alignment with budget
    • Treat like debit card (only spend available cash)

    Example strategic usage:

    • Monthly budget: $3,000
    • Charge $3,000 to 2% cash back card
    • Pay $3,000 in full by due date
    • Benefits: $60 cash back annually ($720), fraud protection, purchase protections
    • Costs: $0 interest, $0 fees
    • Net benefit: $720 annually

    Budget and Tracking Discipline

    Preventing overspending:

    • Monthly budget creation allocating every dollar
    • Weekly spending tracking comparing actual to budget
    • Category limits preventing lifestyle creep
    • Savings automation before discretionary spending

    Red flag monitoring:

    • Unable to pay full balance monthly
    • Balance increasing month over month
    • Unsure where money went (tracking breakdown)
    • Using credit for routine expenses (budget mismatch)
    • Minimum payment focus (debt accumulation signal)

    Card Reduction Strategy

    Minimizing temptation:

    • Keep 1-2 cards maximum for emergencies and strategic use
    • Close unnecessary store cards and high-limit cards
    • Remove cards from wallets (keep at home for online purchases only)
    • Delete saved card information from retailer websites
    • Friction creates pause preventing impulse purchases
    Advertisement
    Reserved space for in-content ad

    Why Understanding Credit Card Debt Matters

    Without understanding credit card debt mechanics, individuals fall into minimum payment trap paying $6,000+ interest on $5,000 balances over 15 years through insufficient payments barely covering accruing interest, miss strategic elimination opportunities (debt avalanche, balance transfers) potentially saving $2,000-5,000 through accelerated repayment or 0% transfers, and perpetuate debt cycles through continued spending without addressing root overspending causes—while credit-card-debt-literate individuals recognize compound interest danger attacking balances aggressively eliminating debt in 12-24 months saving thousands in interest, implement strategic approaches optimizing repayment mathematics, and prevent future accumulation through emergency fund establishment and budget discipline, creating dramatically different outcomes where strategic eliminators become debt-free redirecting $300-600 monthly from debt payments to wealth building versus perpetual debtors paying $1,000-3,000 annually in interest indefinitely for purchases consumed years prior impossible to escape without understanding interest mechanics, minimum payment mathematics, and elimination strategy implementation.

    Understanding credit card debt enables individuals to:

    • Calculate true costs revealing $6,000+ interest on typical $5,000 balance with minimum payments
    • Recognize minimum payment trap deliberately designed maximizing issuer profits
    • Implement elimination strategies (avalanche, snowball, transfers) optimizing repayment
    • Accelerate payoff through spending freezes, side income, windfall application
    • Prevent future debt through emergency fund priority and strategic card usage
    • Identify root causes (overspending, emergency gaps) addressing problems not symptoms
    • Use credit cards strategically for rewards without debt when paying full balances

    Credit card debt knowledge transforms debt elimination from hopeless perpetual payment into strategic rapid elimination saving thousands through aggressive repayment, prevents future accumulation through budget discipline and emergency preparation, and enables strategic card usage capturing rewards without interest costs impossible without understanding compound interest mathematics, minimum payment traps, and elimination strategy optimization.

    Common Misunderstandings

    Many people believe making minimum payments represents responsible debt management avoiding default. In reality, minimum payments deliberately designed keeping borrowers in debt for decades maximizing issuer profits—$5,000 at 18% with minimums requires 15+ years and $11,000+ total paid versus aggressive $300 monthly eliminating debt in 19 months for $5,580 total, proving minimums create illusion of responsibility while enriching issuers through $5,500 unnecessary interest demonstrating minimum-only approach represents sophisticated trap not sound financial strategy despite appearing manageable and responsible.

    Another common misconception is credit card rewards justify carrying balances earning points or cash back. In practice, any carried balance interest costs vastly exceed rewards—2% cash back on $3,000 monthly spending earns $60 monthly but $3,000 balance at 18% costs $45 monthly interest, and balance inevitably grows beyond single month creating $75+ monthly interest far exceeding $60 rewards, proving rewards valuable only when paying full balances monthly with any carried balance transforming beneficial tool into wealth-destroying trap through interest costs exceeding rewards 2-5x depending on balance size and APR.

    Some believe closing paid-off credit cards helps prevent future debt and improves credit scores. However, closing cards reduces total available credit increasing utilization percentage on remaining cards potentially dropping scores 20-50 points, plus eliminates credit history length damaging scores further, proving optimal strategy keeping cards open with $0 balances (freeze or remove from wallet preventing use) maintaining available credit and history length while eliminating temptation through physical inaccessibility not account closure damaging credit metrics unless annual fees justify closure despite score impact.

    How Credit Card Debt Understanding Fits Into Financial Success

    Credit card debt understanding enables rapid elimination saving $3,000-10,000 in interest through aggressive strategic repayment versus minimum payment perpetuation, prevents future accumulation through emergency fund establishment and budget discipline eliminating reactive high-interest borrowing for routine expenses, and allows strategic card usage capturing $500-1,000 annual rewards without debt costs when balances paid in full—making credit card debt literacy essential component of wealth building requiring honest spending assessment identifying overspending patterns, disciplined elimination commitment attacking highest rates aggressively, and behavioral changes preventing future cycles through aligned budgets and emergency reserves, transforming credit cards from wealth-destroying high-interest traps perpetuating payment obligations into strategic tools providing convenience, protection, and rewards when used without debt impossible without understanding compound interest mathematics, minimum payment trap mechanics, and elimination strategy optimization.

    For example, two coworkers both age 30 earning $55,000 both accumulate $8,000 credit card debt age 28. Person A lacks debt understanding, makes $240 minimum payments monthly believing this responsible approach, doesn’t track where money goes, continues normal spending patterns. After 2 years: Balance $7,200 (minimal reduction despite $5,760 in payments), paid mostly interest with little principal reduction. Gets frustrated, considers debt normal part of life, continues minimums. After 10 years age 40: Finally paid off cards after 144 months, total paid $15,800 ($8,000 + $7,800 interest), decade of constant $240 payment preventing any wealth building. Meanwhile could have invested $240 monthly at 8% return = $43,800 over same 10 years, opportunity cost of debt approach = $43,800 forfeited retirement wealth. Person B understands credit card mathematics, researches elimination strategies immediately. Creates aggressive plan: Implements 90-day spending freeze redirecting $600 monthly discretionary to debt, picks up DoorDash side gig 15 hours weekly earning $700 monthly applying 100% to debt, applies $2,200 tax refund to balance. Results: Month 1 payment $1,540 ($240 regular + $600 freeze + $700 side income) destroying principal, receives tax refund month 3 applying $2,200, balance drops to $3,200 after 3 months. Continues aggressive approach: Ends spending freeze but maintains $400 monthly plus $700 side income = $1,100 monthly. Final payoff: 7 months total, $8,560 paid ($8,000 + $560 interest). Immediately redirects $1,100 monthly to investments building wealth. After 10 years age 40: Invested $1,100 monthly for 9.5 years (114 months) at 8% = $190,000 accumulated. Plus avoided $7,240 interest Person A paid (saved through 7-month payoff versus 144-month). Total advantage: $190,000 investments + $7,240 interest savings = $197,240 better outcome from identical $8,000 starting debt. Difference: Person A’s lack of debt understanding created $43,800 opportunity cost ($15,800 paid preventing investment) plus zero wealth accumulation, Person B’s credit card debt literacy created $190,000+ wealth building through rapid 7-month elimination enabling immediate investment redirection demonstrating $234,040 wealth difference ($43,800 Person A opportunity cost + $190,000 Person B investment growth) from understanding minimum payment trap, implementing aggressive elimination, and redirecting payments to wealth building impossible without credit card debt mathematics comprehension and strategic elimination execution.

    Credit card debt understanding separates rapid eliminators building wealth through aggressive repayment and investment redirection from perpetual minimum payers enriching issuers through decades of interest payments preventing wealth accumulation, requiring mathematical comprehension revealing true costs, strategic elimination implementation, and behavioral changes preventing future cycles impossible without credit card debt literacy.

    Recent Updates and Trends

    In recent years, average credit card APRs have increased from 15-17% to 20-22% following Federal Reserve rate adjustments making existing balances more expensive and accelerating interest accumulation, though fundamental mathematics unchanged requiring aggressive elimination regardless of specific APR making high balances increasingly costly but not altering strategic approach of rapid payoff through increased payments and spending discipline.

    Buy-now-pay-later services have proliferated as credit card alternatives offering 0% short-term installment payment options at checkout, though creating similar risks through payment stacking across multiple services and potential overspending beyond capacity despite interest-free marketing obscuring cash flow impacts and late fee risks when payments missed requiring similar budget discipline preventing accumulation regardless of specific product format.

    Balance transfer promotional periods have shortened slightly from 18-21 months typical to 12-18 months more common, though 0% transfers remain valuable elimination tool when used strategically with aggressive repayment completing payoff before promotion ends making compressed timelines require disciplined payment amounts ensuring full elimination preventing reversion to 18-25% regular APRs negating savings from insufficient monthly payments.

    Minimum payment percentages have decreased slightly from 2-3% typical to 1-2% at some issuers extending repayment timelines further and increasing total interest paid, though fundamental trap mechanics unchanged requiring fixed aggressive payments ignoring declining minimums eliminating debt rapidly regardless of minimum payment percentage changes designed maximizing issuer profits through extended payment timelines.

    Fundamental credit card debt principles remain timeless: compound interest creates $6,000+ costs on $5,000 balances through minimum payments perpetuating debt for decades, aggressive fixed payments eliminate debt in 12-24 months saving thousands in interest, emergency funds prevent future accumulation by addressing reactive high-interest borrowing for unexpected expenses, and strategic usage paying full balances monthly captures rewards without debt costs—regardless of APR increases, BNPL proliferation, promotional period changes, or minimum payment percentage adjustments, understanding compound interest mathematics, minimum payment trap mechanics, and aggressive elimination strategies produces superior outcomes through rapid debt freedom and wealth building redirection impossible without credit card debt literacy enabling strategic elimination and prevention.

    3 Things You Can Do Today

    Ready to eliminate credit card debt strategically? Here are three simple steps you can take right now:

    1. Calculate exact payoff timeline and total interest cost at current minimum payment revealing shocking true costs – List all credit cards: Balance, APR, current minimum payment for each. Use online credit card payoff calculator entering each card’s data. Record devastating results: Minimum-only timeline (often 10-20 years), total amount will pay (principal + interest typically 150-200% of balance), total interest dollars (often 50-100% of original balance). Example calculation: $5,000 at 18% APR, $150 minimum = 15+ years timeline, $11,068 total paid, $6,068 wasted interest. Calculate aggressive alternative: Same $5,000, $300 monthly = 19 months, $5,580 total, saves $5,488 interest and 164 months versus minimums. Create comparison showing: CURRENT PATH (minimums): $X total interest, Y years. AGGRESSIVE PATH ($Z monthly): $A total interest (saves $B), C months (saves D months). Visual shock: “$6,068 interest over 15 years versus $580 interest over 19 months” creates urgency impossible when focusing only on minimum payment affordability. Write commitment: “Current minimum path wastes $X in interest over Y years. Will pay $Z monthly eliminating debt in C months saving $B.” Takes 15 minutes per card creating mathematical awareness driving behavior change through visible cost revelation.

    2. Implement debt avalanche or snowball method TODAY establishing strategic elimination plan with specific monthly allocations – Choose method: Avalanche (highest APR first, saves most interest) or Snowball (smallest balance first, psychological wins). List cards by method: Avalanche = highest to lowest APR. Snowball = smallest to largest balance. Calculate total available monthly: Sum all minimum payments PLUS any extra available from budget cuts or income increases (example: $275 minimums + $225 extra = $500 total monthly). Allocate strategically: Pay minimum on all except target card, apply remainder to target. Example avalanche: Card A $3,000 at 24% ($90 min), Card B $5,000 at 18% ($125 min), Card C $2,000 at 15% ($60 min), total $500 available. Allocations: $90 Card A, $125 Card B, $60 Card C, $225 extra to Card A (highest APR) = $315 attacking Card A. When Card A eliminated (10 months), roll entire $315 to Card B creating $440 monthly payment. When Card B eliminated, roll $440 to Card C creating $500 final payment. Set up: Create automatic payments at minimums for non-target cards preventing missed payments, manual payment to target card allowing extra amounts, set calendar reminders 1st of month “Make extra $X payment to Card Y.” Track progress: Spreadsheet or app showing balance reduction monthly creating motivation. Takes 30 minutes establishing complete elimination plan transforming vague “pay off debt” into specific strategic approach with exact monthly allocations and predicted payoff dates impossible when making ad-hoc payments without systematic method.

    3. Identify $300-500 monthly through spending freeze or side income redirecting 100% to debt creating rapid elimination – Spending analysis: Review 3 months bank/card statements, categorize every expense, identify discretionary spending (dining out, entertainment, shopping, subscriptions). Calculate discretionary total: Often $400-800 monthly for moderate spenders. Implement 60-90 day spending freeze: Zero discretionary spending except absolute essentials, example cuts: $200 dining out eliminated, $100 entertainment eliminated, $80 shopping eliminated, $50 subscriptions canceled = $430 monthly freed. Alternative/additional side income: DoorDash/Uber 15 hours weekly = $600-800 monthly, selling unused items (garage, storage, closets) = $500-2,000 one-time, overtime at primary job if available, freelance skills evenings/weekends. Application commitment: 100% of freed spending or side income directly to debt, no exceptions, temporary sacrifice (60-90 days) creating permanent debt freedom. Example impact: $8,000 debt, current $300 monthly = 32 months. Add $500 from freeze + side income = $800 total monthly = 11 months, saves 21 months and $1,200+ interest. Set up execution: Cancel discretionary subscriptions TODAY, remove dining/entertainment from budget next 90 days, sign up for side gig app completing background check, list 20 items for sale online, create “debt destruction fund” transferring freed money immediately to debt payment preventing spending temptation. Track transformation: Weekly balance checks showing rapid principal reduction creating addiction to progress. Takes 2 hours implementing creating $3,000-6,000 acceleration through temporary extreme measures impossible when continuing normal spending patterns without intentional aggressive intervention period.

    These actions create credit card debt elimination momentum within 3 hours—calculated shocking true costs revealing $5,000-10,000 unnecessary interest from minimum payments driving urgency, implemented strategic elimination method (avalanche or snowball) with specific allocations creating systematic approach, and identified $300-500 monthly through freeze or income redirecting to debt creating rapid 12-24 month elimination timeline—transforming credit card debt from hopeless perpetual burden into conquerable challenge with specific timeline and savings impossible without mathematical cost awareness, strategic method implementation, and aggressive payment acceleration through spending cuts or income increases.

    Quick FAQ

    How long does it take to pay off credit card debt?
    Depends on balance, APR, and monthly payment but minimum payments require 10-20 years while aggressive payments eliminate debt in 12-24 months: Minimum payment timeline—$5,000 at 18% paying minimums ($150 initially, declining as balance shrinks) = 15+ years, $11,000+ total paid. $8,000 at 20% minimums = 17+ years, $16,000+ total. Aggressive payment timeline—$5,000 at 18% paying $300 monthly = 19 months, $5,580 total. $8,000 at 20% paying $500 monthly = 18 months, $9,280 total. General guideline: Paying 5-10% of balance monthly eliminates debt in 12-24 months, paying 2-3% minimums requires 10-20 years. Calculation factors: Higher APR extends timeline dramatically (18% versus 24% adds years), larger balances need proportionally aggressive payments, declining minimums perpetuate debt versus fixed aggressive amounts. Strategic approach: Use online calculator entering balance, APR, desired monthly payment to see exact timeline, set aggressive payment goal eliminating debt in 18-24 months maximum, never rely on minimums accepting 10+ year timeline and doubled costs. Example: $10,000 total debt across cards, $600 monthly aggressive payment = 20 months debt-free, versus minimums $300 initially = 12+ years. Reality: Most carrying $5,000-10,000 balances could eliminate in 18-24 months with $400-600 monthly payments but perpetuate through minimum-only approach accepting decade+ timelines and thousands in unnecessary interest.

    Should I use debt avalanche or debt snowball method?
    Avalanche saves most money mathematically (attack highest APR first), snowball provides psychological wins (attack smallest balance first), choose based on personality and motivation needs: Avalanche advantages—Minimizes total interest paid through mathematical optimization, saves $500-2,000 typical versus snowball on $10,000-15,000 total debt, fastest mathematical payoff, best if motivated by numbers and savings. Avalanche example—$3,000 at 24%, $5,000 at 18%, $2,000 at 12%, attack 24% first despite larger balance = lowest total interest. Snowball advantages—Quick wins creating momentum (eliminate cards faster initially), psychological boost from seeing accounts closed, better adherence for those motivated by progress not math, costs $100-500 more in interest but prevents giving up. Snowball example—Same balances, attack $2,000 first (smallest) = closed in 6 months creating motivation surge. Decision framework—Choose avalanche if: financially disciplined, motivated by mathematics and savings, comfortable delayed gratification, high interest rate gaps (24% versus 12% makes avalanche clearly superior). Choose snowball if: need motivation through quick wins, history of giving up on financial goals, relatively similar interest rates (18% versus 15% makes method difference minimal), value psychological boost over slight interest savings. Hybrid approach—Snowball first small balance under $1,000 for quick win, then avalanche remaining by APR combining psychological benefit with mathematical optimization. Key insight: EITHER method vastly superior to minimum payments—$500 method difference trivial versus $5,000+ saved eliminating debt in 18 months versus 15 years, making primary goal aggressive payment amount not perfecting method selection.

    Is a balance transfer worth it?
    Yes if can pay off balance during 0% promotional period (typically 12-18 months) and avoid reusing cards, saving $1,000-3,000 in interest: Balance transfer benefits—0% APR promotional period eliminating interest accumulation, saves $1,000-3,000 typical on $8,000-10,000 transfer, 100% of payment attacks principal accelerating elimination, predictable payoff timeline. Transfer costs—3-5% transfer fee ($240-400 on $8,000 transfer), high APR after promotion ends (18-25% if not paid off), annual fee some cards ($0-95), temptation to reuse cleared cards creating double debt. Example analysis—$8,000 at 20% APR paying $450 monthly: Without transfer = 21 months, $9,450 total ($1,450 interest). With 0% transfer 18 months, 3% fee: 18 months, $8,240 total ($240 fee), saves $1,210. Worth it if: Can pay off during promotional period ($8,000 ÷ 18 months = $445 minimum monthly payment required), won’t reuse cleared cards (close or freeze preventing spending), have discipline avoiding new purchases on transfer card (no grace period, accrues interest immediately). NOT worth if: Cannot pay off in 18 months (reverts to 18-25% APR negating savings), will reuse cards creating larger debt problem, poor payment discipline risking late payment canceling promotion. Requirements for success—Calculate required monthly payment (balance ÷ promotional months), ensure affordable within budget, set automatic payment preventing missed due dates, close or freeze cleared cards, make NO new purchases on transfer card, mark calendar when promotion ends. Alternative—If cannot afford required payment during promotion, debt consolidation loan at fixed 10-15% better than balance transfer reverting to 25% when promotion ends unpaid.

    Should I close credit cards after paying them off?
    Generally NO—keep cards open with $0 balances preserving credit history and available credit unless annual fees justify closure: Keeping cards open advantages—Maintains credit utilization ratio ($10,000 total limits, $2,000 balance = 20% utilization healthy versus $5,000 limits, $2,000 balance = 40% hurting scores), preserves credit history length (15% of FICO score), no negative credit impact, free emergency backup if needed. Closing cards disadvantages—Reduces available credit increasing utilization (drops scores 20-50 points typical), loses credit history shortening average account age (damages scores), permanent credit report mark (closed by consumer), harder to reopen if needed future. Strategy: Keep cards open but prevent use—Remove from wallet storing securely at home, delete saved information from retailer websites, set small recurring charge ($5 Netflix) with automatic full payment preventing closure due to inactivity, check statements quarterly ensuring no fraudulent charges. Close cards only if: Annual fee not justified by benefits ($95-550 fees common premium cards), temptation too strong despite physical removal (compulsive spending issues), many cards making management difficult (keep 2-3 oldest, close newest). Closing procedure minimizing damage: Close newest cards first preserving oldest for history length, pay to $0 before closing preventing closure with balance, request closure in writing, verify closure on credit report within 60 days. Example: 5 credit cards, 3 with annual fees $95+ not using benefits, keep 2 oldest fee-free cards (opened 8 and 12 years ago) preserving history, close 3 newer fee cards saving $285-500 annually in fees justifying minor score impact. Key insight: $0 balance card costs nothing to maintain (no fees no-fee cards) while preserving credit metrics making closure generally inadvisable unless fees charged or compulsive spending risk outweighs credit score benefits.

    What if I can’t afford more than minimum payments?
    Emergency requiring immediate action through income increase or expense reduction as minimum-only approach perpetuates debt indefinitely costing thousands: Immediate assessment—Calculate minimum-only timeline and total cost revealing impossibility (example: $8,000 at 20% minimums = $16,000+ paid over 15+ years), recognize current trajectory unsustainable requiring intervention. Income increase options—Side gig 10-15 hours weekly (DoorDash, Uber) = $400-800 monthly, sell unused items generating $500-2,000 immediate, overtime at primary job, freelance skills evenings, seasonal work (tax season, holidays), temporary second job even 6-12 months creating debt elimination momentum. Expense reduction options—Analyze spending last 3 months categorizing everything, cut all discretionary (dining out, entertainment, subscriptions) freeing $300-600 typical, reduce semi-discretionary (cheaper phone plan, insurance shopping, housing roommate) = $100-300, temporary extreme cuts (pause retirement contributions while eliminating high-interest debt, reduce 401k to employer match minimum only) freeing cash flow. Combination approach—$400 side income + $300 spending cuts = $700 monthly versus $200 minimums transforms 15-year timeline into 14-month elimination saving $13,000+ making temporary sacrifice worthwhile. If truly cannot increase payment—Debt consolidation loan converting 18-25% to fixed 10-15% reducing payment while maintaining progress, nonprofit credit counseling (NFCC.org) potentially negotiating lower rates or payment plans, balance transfer to 0% preventing interest accumulation during income increase efforts. WARNING: If cannot afford minimums without additional debt—Financial crisis requiring professional help (credit counselor, bankruptcy attorney consultation), may indicate unsustainable situation needing debt settlement or bankruptcy versus perpetual minimum struggle. Key: Minimum-only NOT viable long-term strategy requiring action through income increase, expense reduction, or professional help making “can’t afford more” unacceptable acceptance requiring immediate intervention not resignation to decade+ debt imprisonment.

    Explore More in Money Basics

    Disclosure

    This article provides general educational information about credit card debt and elimination strategies. Individual debt situations, appropriate strategies, payoff timelines, and outcomes vary significantly based on circumstances including total debt, income, expenses, credit, and discipline. This is not financial advice or recommendation of specific debt elimination approaches. Credit card debt carries risks including continued interest accumulation, potential collections, credit score damage, and financial stress. Minimum payment timelines and interest calculations represent typical scenarios based on standard issuer policies—actual amounts vary by specific card terms and balance behavior. Debt avalanche and snowball methods represent general frameworks—individual optimization depends on complete financial picture and psychological factors. Balance transfer offers vary by creditworthiness and issuer—promotional terms, transfer fees, and post-promotional rates differ significantly across cards. Balance transfers carry risks including failed payoff during promotion, temptation to reuse cleared cards, and new purchase complications. Debt consolidation loans require qualification and carry origination fees and potential extended terms—not suitable for all situations. Side income projections represent potential ranges not guarantees—actual earnings vary by location, time commitment, and market conditions. Spending freeze strategies require individual assessment—essential expenses vary by situation. Credit card closure decisions affect credit scores—impacts vary by individual credit profiles. Nonprofit credit counseling services offer legitimate assistance—research credentials and avoid debt settlement scams charging high fees. Some debt situations may require professional intervention beyond self-help strategies. Consult qualified credit counselors, financial advisors, or bankruptcy attorneys for personalized guidance matching individual circumstances. Focus on addressing root spending issues alongside debt elimination preventing future cycles. Advertisements or sponsored content may appear within or alongside this content. All information presented independently for educational purposes only.
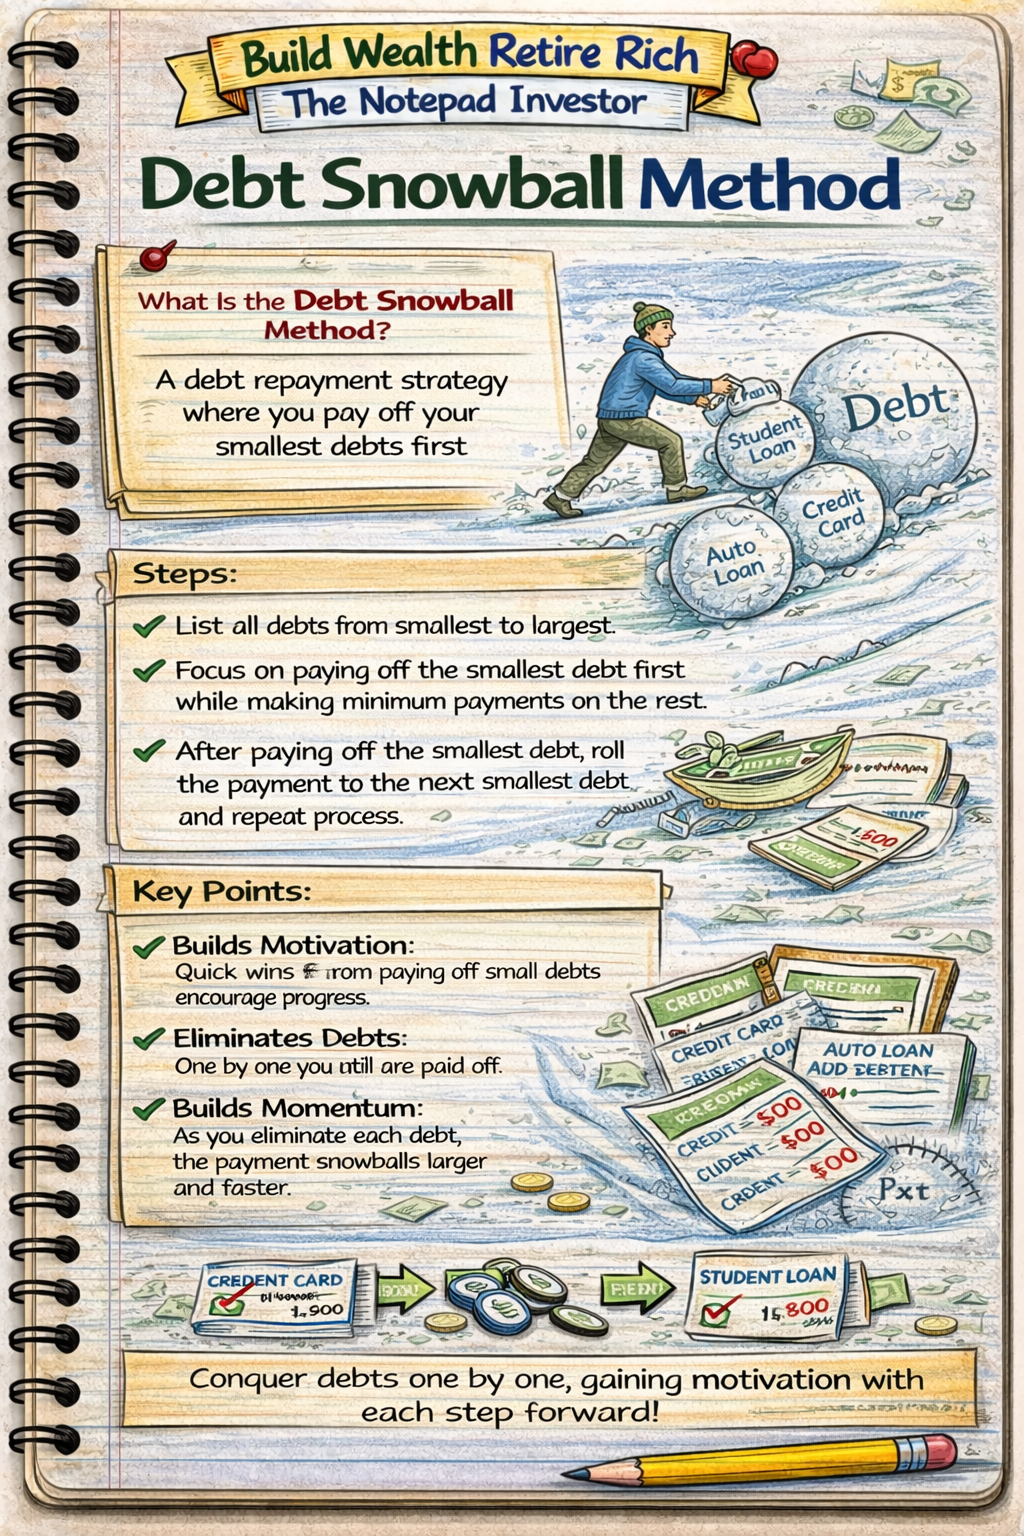
  • 5.5 Auto Loans Explained: What to Know Before Financing a Car

    5.5 Auto Loans Explained: What to Know Before Financing a Car

    Auto loans are secured installment debts specifically for purchasing vehicles where the car itself serves as collateral enabling lenders to repossess if borrowers default—typically featuring shorter repayment terms (36-72 months common, 84 months increasingly prevalent), moderate interest rates (4-12% depending on creditworthiness), and borrowing amounts ranging from $15,000 for used economy cars to $60,000+ for new luxury vehicles. Unlike mortgages creating wealth through appreciation, auto loans finance rapidly depreciating assets losing 20-30% value first year and 60-70% over five years creating underwater scenarios where loan balance exceeds vehicle worth—new $30,000 car worth $21,000 after one year but owing $27,000 creates $6,000 negative equity trapping owners unable to sell or trade without bringing cash to transaction. Understanding auto loan mechanics, interest calculation methods, term length impacts, new versus used financing considerations, and total cost of ownership including depreciation, insurance, maintenance, and fuel determines whether vehicle financing strategic necessity enabling employment and transportation or financial destruction through excessive borrowing on luxury vehicles creating payments consuming 15-20% income for depreciating assets providing zero wealth building unlike productive debt financing appreciating investments making auto loan literacy essential for second-largest debt most people incur after mortgages.

    Notebook sketch explaining personal finance

    This article is designed for anyone considering vehicle purchase, current auto loan holders wanting refinancing understanding, or those confused by dealer financing tactics and loan structuring. You do not need financial expertise to understand auto loans—fundamental concepts accessible through clear explanations of loan mechanics, rate determinants, term implications, and strategic considerations, though requires honest needs assessment distinguishing between reliable transportation necessity and luxury status symbol, realistic budget evaluation ensuring payment affordable within 10-15% gross income preventing transportation-poor existence sacrificing other financial goals, and disciplined resistance to dealer pressure extending terms creating seemingly affordable payments masking total costs doubling vehicle prices through interest and extended depreciation exposure creating guaranteed underwater scenarios impossible to exit without substantial loss.

    Understanding auto loans matters because term length decisions create $5,000-15,000 interest differences on identical vehicles, credit score optimization saves $3,000-8,000 through rate reductions, and new versus used strategic selection prevents $10,000-20,000 depreciation losses in first three years—while auto-loan-literate individuals finance reliable used vehicles 2-3 years old capturing 30-40% depreciation savings, limit terms to 48-60 months preventing underwater scenarios, and maintain payments under 10% gross income preserving financial flexibility, versus irresponsible borrowers financing new luxury vehicles with 72-84 month terms creating perpetual negative equity cycles trading underwater vehicles rolling thousands in negative equity into new loans compounding debt burden through successive transactions impossible to escape without cash infusion or driving worthless vehicles for years eliminating payments impossible without understanding depreciation mathematics, term implications, and strategic vehicle selection aligned with transportation needs not emotional wants.

    Educational disclaimer: This article provides general educational information about auto loans and vehicle financing. Individual loan terms, interest rates, qualification requirements, and appropriate borrowing amounts vary based on circumstances including credit, income, vehicle type, and lender. Auto loan rates and programs subject to market changes. This is not financial advice or guarantee of loan approval. Vehicles depreciate significantly and rapidly creating potential negative equity. Consult qualified financial professionals for personalized guidance matching individual situations.

    Auto Loan Basics and How They Work

    Core Auto Loan Mechanics

    Key components:

    • Principal: Vehicle purchase price minus down payment
    • Interest rate: APR ranging 4-20% based on credit and vehicle age
    • Term: Repayment period (36-84 months common)
    • Monthly payment: Fixed amount covering principal and interest
    • Collateral: Vehicle securing loan (lender can repossess if default)

    Standard auto loan transaction:

    • Step 1: Determine budget and get pre-approved (bank, credit union, online lender)
    • Step 2: Shop for vehicle within approved amount
    • Step 3: Compare pre-approval versus dealer financing
    • Step 4: Sign purchase agreement and loan documents
    • Step 5: Make monthly payments until fully repaid (36-84 months)
    • Step 6: Receive title when loan satisfied

    Simple Interest Calculation

    How auto loan interest works (simple interest, not compound like mortgages):

    • Interest calculated daily on remaining principal balance
    • Monthly rate: APR ÷ 12
    • Each payment: Interest calculated first, remainder reduces principal
    • Early payments reduce principal faster (save interest)

    Example calculation:

    • Loan: $25,000 at 6% APR, 60 months
    • Monthly payment: $483
    • Month 1: Balance $25,000 × (6% ÷ 12) = $125 interest, $358 principal
    • Month 2: Balance $24,642 × 0.005 = $123 interest, $360 principal
    • Month 30: Balance $13,500 × 0.005 = $68 interest, $415 principal
    • Month 60: Balance $480 × 0.005 = $2 interest, $481 principal
    • Total paid: $28,980 ($483 × 60)
    • Total interest: $3,980

    The Depreciation Challenge

    Typical vehicle depreciation:

    • Moment driven off lot: 10-11% loss (immediate depreciation)
    • End of year 1: 20-30% total depreciation
    • End of year 3: 40-50% depreciation
    • End of year 5: 60-70% depreciation

    New $30,000 vehicle depreciation example:

    • Purchase price: $30,000
    • After 1 year: $21,000 value (30% depreciation = $9,000 loss)
    • After 3 years: $16,500 value (45% depreciation = $13,500 loss)
    • After 5 years: $10,500 value (65% depreciation = $19,500 loss)

    Loan balance versus value creating underwater scenario:

    • Purchase: $30,000 with $3,000 down, finance $27,000 at 6%, 72 months
    • After 1 year: Owe $23,500, vehicle worth $21,000 = $2,500 underwater
    • After 3 years: Owe $14,200, vehicle worth $16,500 = $2,300 equity finally
    • After 5 years: Owe $4,800, vehicle worth $10,500 = $5,700 equity
    • Problem: Underwater years 1-2 trapping owner unable to trade/sell without loss
    Advertisement

    Financial Wellness Planner

    New vs Used Vehicle Financing

    New Vehicle Financing

    Advantages:

    • Lower interest rates (4-7% for excellent credit)
    • Manufacturer incentives (0-3% promotional financing occasional)
    • Warranty coverage (3-5 years bumper-to-bumper typical)
    • Latest safety and technology features
    • Easier approval (less lender risk with new)

    Disadvantages:

    • Maximum depreciation exposure (30% year 1)
    • Higher purchase price ($30,000-45,000 typical new)
    • Higher insurance costs (full coverage on higher value)
    • Larger loan amounts and monthly payments
    • Guaranteed underwater first 1-3 years

    Total cost of new vehicle ownership (5 years):

    • Purchase price: $32,000
    • Down payment: $5,000
    • Financed: $27,000 at 5%, 60 months = $509 monthly
    • Total payments: $30,540
    • Insurance: $1,800 annually × 5 = $9,000
    • Maintenance: $3,000 (minimal under warranty)
    • Fuel: $7,500 (assuming $1,500 annually)
    • Total 5-year cost: $55,040
    • Vehicle value year 5: $11,200
    • Net cost: $43,840 ($55,040 – $11,200)
    • Annual cost: $8,768

    Used Vehicle Financing

    Advantages:

    • Lower purchase price (2-3 year old = 40-50% less than new)
    • Avoided worst depreciation (30% first year already absorbed)
    • Lower insurance costs (reduced vehicle value)
    • More vehicle for same payment (can buy higher trim used vs base new)
    • Smaller loan amounts

    Disadvantages:

    • Higher interest rates (6-12% typical, 2-5% above new rates)
    • Limited or no warranty (may need to purchase extended)
    • Unknown history (maintenance, accidents, prior issues)
    • Potentially higher maintenance costs
    • Shorter remaining useful life

    Total cost of used vehicle ownership (same vehicle 3 years old, owned 5 years):

    • Purchase price: $17,600 (45% depreciation from $32,000 new)
    • Down payment: $3,000
    • Financed: $14,600 at 7%, 48 months = $351 monthly
    • Total payments: $16,848
    • Insurance: $1,400 annually × 5 = $7,000
    • Maintenance: $6,000 (higher, out of warranty)
    • Fuel: $7,500
    • Total 5-year cost: $40,348
    • Vehicle value year 5 (8 years old): $6,400
    • Net cost: $33,948
    • Annual cost: $6,790
    • Savings versus new: $9,892 over 5 years ($1,978 annually)

    The Sweet Spot: 2-3 Year Old Certified Pre-Owned

    CPO advantages:

    • Significant depreciation already absorbed (30-40%)
    • Manufacturer-backed warranty (typically 6-7 years total from original sale)
    • Rigorous inspection and reconditioning
    • Roadside assistance and benefits
    • Lower rates than regular used (manufacturer incentives)
    • Balance of depreciation savings and reliability

    Optimal strategy:

    • Purchase 2-3 year old CPO vehicle
    • Finance 48 months maximum
    • Drive 5-7 years total (to 7-10 years old)
    • Captures depreciation savings while maintaining reliability
    • Minimizes total ownership cost versus new or older used

    Interest Rates and Credit Impact

    Rate Ranges by Credit Score

    New vehicle rates (2024 typical):

    • Excellent credit (720+): 4-6% APR
    • Good credit (660-719): 6-9% APR
    • Fair credit (620-659): 9-14% APR
    • Poor credit (580-619): 14-18% APR
    • Subprime (below 580): 18-20%+ or denied

    Used vehicle rates (typically 2-4% higher than new):

    • Excellent credit: 6-8% APR
    • Good credit: 8-11% APR
    • Fair credit: 11-16% APR
    • Poor credit: 16-20% APR
    • Subprime: 20-25%+ or denied

    Cost Impact of Credit Scores

    $25,000 loan, 60 months, rate impact:

    Excellent credit (5%):

    • Monthly payment: $472
    • Total paid: $28,320
    • Total interest: $3,320

    Good credit (8%):

    • Monthly payment: $507
    • Total paid: $30,420
    • Total interest: $5,420
    • Extra cost versus excellent: $2,100

    Fair credit (12%):

    • Monthly payment: $556
    • Total paid: $33,360
    • Total interest: $8,360
    • Extra cost versus excellent: $5,040

    Poor credit (18%):

    • Monthly payment: $634
    • Total paid: $38,040
    • Total interest: $13,040
    • Extra cost versus excellent: $9,720

    Key insight: 720+ credit score saves $5,000-10,000 versus poor credit on typical auto loan

    Improving Credit Before Purchase

    Strategic 6-12 month credit optimization:

    • Pay down credit card balances to under 10% utilization (30-60 point boost)
    • Maintain perfect payment record (protect 35% of score)
    • Avoid new credit applications (prevent inquiry damage)
    • Dispute any credit report errors
    • Become authorized user on old account if available

    Example improvement:

    • Starting score: 640 (qualifies for 12% rate)
    • 6 months optimization: 710 score (qualifies for 7% rate)
    • $25,000 loan savings: $3,600 over 5 years
    • ROI: Delaying purchase 6 months saves $3,600

    Manufacturer Promotional Rates

    0-3% promotional financing:

    • Manufacturer-subsidized rates on select models
    • Typically new vehicles only
    • Requires excellent credit (720-750+)
    • Often mutually exclusive with cash rebates
    • Limited term availability (36-60 months)

    Promotional rate evaluation:

    • $30,000 vehicle, choice of 0% financing OR $3,000 cash rebate
    • Option A: 0% financing, $30,000 loan, 60 months = $500 monthly, $30,000 total
    • Option B: $3,000 rebate, finance $27,000 at 5%, 60 months = $509 monthly, $30,540 total
    • 0% saves $540 over rebate + market rate financing
    • Generally: 0-1% promotional rates better than rebates, 2-3% depends on rebate amount
    Advertisement
    Reserved space for in-content ad

    Loan Term Length: The Critical Decision

    Common Term Lengths and Trade-offs

    36-month term:

    • Pros: Minimal interest paid, quickest equity building, shortest underwater period, vehicle retained longer debt-free
    • Cons: Highest monthly payment, qualification more difficult, limits affordable vehicle price

    48-month term (recommended maximum for used):

    • Pros: Balance of payment affordability and interest minimization, reasonable equity building
    • Cons: Moderate interest costs, 1-2 years underwater typical

    60-month term (most common):

    • Pros: Lower monthly payment, easier qualification, broader vehicle selection
    • Cons: Higher interest costs, 2-3 years underwater, vehicle aging faster than payoff

    72-month term (increasingly common, risky):

    • Pros: Lowest monthly payment, maximum purchasing power
    • Cons: Very high interest costs, 3-4 years underwater, vehicle aging quickly relative to loan, likely needs major repairs while still making payments

    84-month term (avoid):

    • Pros: Lowest possible payment enabling luxury vehicle affordability
    • Cons: Massive interest costs, underwater 4-5 years, 7-year-old vehicle still being paid on, perpetual negative equity trap, very high total cost

    Term Length Comparison ($25,000 loan at 7%)

    36 months:

    • Monthly payment: $773
    • Total paid: $27,828
    • Total interest: $2,828
    • Paid off: 3 years, drive debt-free years 4+

    48 months:

    • Monthly payment: $599
    • Total paid: $28,752
    • Total interest: $3,752
    • Extra cost versus 36 months: $924

    60 months:

    • Monthly payment: $495
    • Total paid: $29,700
    • Total interest: $4,700
    • Extra cost versus 36 months: $1,872

    72 months:

    • Monthly payment: $426
    • Total paid: $30,672
    • Total interest: $5,672
    • Extra cost versus 36 months: $2,844

    84 months:

    • Monthly payment: $377
    • Total paid: $31,668
    • Total interest: $6,668
    • Extra cost versus 36 months: $3,840
    • Interest costs 2.4x higher (84 vs 36 months)

    The Underwater Trap of Long Terms

    72-month loan on $30,000 vehicle example:

    • Purchase: $30,000, $3,000 down, finance $27,000 at 7%
    • Year 1: Owe $24,000, vehicle worth $21,000 = $3,000 underwater
    • Year 2: Owe $20,700, vehicle worth $18,000 = $2,700 underwater
    • Year 3: Owe $17,100, vehicle worth $16,500 = $600 underwater
    • Year 4: Owe $13,200, vehicle worth $13,500 = $300 equity finally
    • Problem: Trapped 3 years unable to trade/sell without bringing cash

    Negative equity rollover cycle:

    • Year 3 decide to trade (still underwater $600)
    • New vehicle $32,000, roll $600 negative equity = $32,600 financed
    • 72 months at 7% = $445 monthly
    • Year 1 of new loan: Owe $29,200, new vehicle worth $22,400 = $6,800 underwater (worse than first loan)
    • Perpetual cycle: Each trade rolls more negative equity compounding problem

    Recommended Term Strategy

    Term selection guidelines:

    • New vehicles: Maximum 60 months, prefer 48 months
    • Used vehicles (under 3 years old): Maximum 48 months
    • Used vehicles (3-6 years old): Maximum 36-42 months
    • Used vehicles (over 6 years old): Pay cash or avoid (loan term exceeds remaining useful life)

    Never exceed rule:

    • Loan term + vehicle age at purchase should not exceed 8-10 years
    • Example: 3-year-old vehicle, maximum 60-month term = 8 years old at payoff
    • Prevents paying for vehicle after it needs major repairs or replacement

    Down Payments and Trade-Ins

    Down Payment Strategy

    Recommended minimums:

    • New vehicles: 20% down (prevents immediate underwater)
    • Used vehicles: 10-15% down minimum
    • CPO vehicles: 10% down acceptable

    Benefits of larger down payments:

    • Lower monthly payments (smaller loan)
    • Less interest paid (lower principal)
    • Better interest rates (lower LTV ratio)
    • Equity buffer preventing underwater
    • Easier qualification

    Comparison example ($28,000 vehicle):

    $0 down (100% financing):

    • Loan: $28,000 at 8%, 60 months
    • Payment: $568
    • Total interest: $6,080
    • After 1 year: Owe $24,100, vehicle worth $19,600 = $4,500 underwater

    $5,600 down (20%):

    • Loan: $22,400 at 7% (better rate), 60 months
    • Payment: $444
    • Total interest: $4,240
    • After 1 year: Owe $18,900, vehicle worth $19,600 = $700 equity
    • Savings: $1,840 interest, $124 monthly, never underwater

    Trade-In Considerations

    Trade-in with positive equity:

    • Vehicle worth: $15,000
    • Loan balance: $11,000
    • Equity: $4,000
    • Applied as down payment on next vehicle
    • Reduces new loan amount

    Trade-in with negative equity (upside down):

    • Vehicle worth: $12,000
    • Loan balance: $15,000
    • Negative equity: $3,000
    • Options: Pay $3,000 cash to dealer OR roll into new loan
    • Rolling negative equity compounds problem on new purchase

    Negative equity rollover example:

    • New vehicle price: $30,000
    • Negative equity: $3,000
    • Total financed: $33,000
    • Starts new loan immediately underwater by $3,000
    • After 1 year: Owe $28,500, vehicle worth $21,000 = $7,500 underwater
    • Creates perpetual trap compounding with each trade

    Avoiding negative equity trades:

    • Keep vehicle longer until equity positive
    • Pay extra to principal accelerating payoff
    • Bring cash to cover negative equity
    • Sell privately (often get more than dealer trade value)

    Gap Insurance

    What gap insurance covers:

    • Difference between vehicle value and loan balance if totaled
    • Example: Owe $22,000, vehicle worth $18,000, totaled in accident
    • Regular insurance pays $18,000
    • Gap insurance pays $4,000 difference
    • Without gap: Owe $4,000 on vehicle you no longer have

    When gap insurance makes sense:

    • Less than 20% down payment (underwater risk)
    • Terms over 60 months (extended underwater period)
    • New vehicle purchase (rapid depreciation)
    • Negative equity rolled into loan (starting underwater)

    Gap insurance costs:

    • Dealer: $500-700 (often overpriced)
    • Insurance company: $20-40 annually (much cheaper)
    • Duration: Typically needed only first 2-3 years
    • Recommendation: Purchase through regular auto insurer not dealer
    Advertisement
    Reserved space for in-content ad

    Dealer Financing vs Outside Financing

    Getting Pre-Approved Before Shopping

    Pre-approval sources:

    • Credit unions: Often best rates (4-7% typical), member-focused
    • Banks: Competitive rates (5-8%), relationship discounts possible
    • Online lenders: Quick approval, competitive rates (5-9%)
    • Dealer financing: Convenient but often not best rate unless manufacturer promotional

    Pre-approval advantages:

    • Know exact budget before shopping
    • Negotiate as cash buyer (dealer discounts)
    • Compare dealer financing offers against known alternative
    • Faster purchase process
    • Leverage for rate negotiation

    Dealer Financing Tactics to Recognize

    The monthly payment focus:

    • Dealer asks: “What payment can you afford?”
    • Danger: Focuses on payment not total cost
    • Tactic: Extends term creating “affordable” payment on overpriced vehicle
    • Example: $600 budget → dealer shows 84-month loan creating $600 payment on $35,000 vehicle paying $50,000 total
    • Better: Negotiate total price first, then discuss financing

    The four-square worksheet:

    • Four numbers: Vehicle price, trade-in value, down payment, monthly payment
    • Dealer manipulates all four obscuring actual deal
    • Tactic: Gives on one (trade value up) while taking on another (price up, payment extended)
    • Defense: Negotiate each component separately, get everything in writing

    The “let me talk to my manager” tactic:

    • Creates time pressure and authority confusion
    • Wears down buyer resistance through lengthy process
    • Defense: Be willing to walk away, don’t buy same day, shop multiple dealers

    Dealer add-ons and products:

    • Extended warranties: $1,500-3,000 (often poor value, negotiate or decline)
    • Paint protection: $500-1,200 (DIY ceramic coating $50-200)
    • Fabric protection: $300-800 (scotchgard yourself $20)
    • Gap insurance: $500-700 (buy through regular insurer $20-40 annually)
    • VIN etching: $200-400 (minimal theft prevention value)
    • Total dealer add-ons: $3,000-6,000 markup on minimal-value products

    Comparing Financing Offers

    Evaluation criteria:

    • APR (most important)
    • Loan term
    • Monthly payment
    • Total amount paid (payment × months)
    • Prepayment penalties (avoid loans with penalties)
    • Origination fees

    Example comparison:

    Credit union pre-approval:

    • $24,000 at 5.5%, 48 months
    • Payment: $554
    • Total paid: $26,592

    Dealer financing:

    • $24,000 at 6.9%, 60 months
    • Payment: $475 (“lower payment!”)
    • Total paid: $28,500
    • Extra cost: $1,908 for “lower payment” through extended term

    Best choice: Credit union (saves $1,908)

    Strategic Auto Financing

    The 20/4/10 Rule

    Rule components:

    • 20% down payment minimum
    • 4-year (48-month) maximum term
    • 10% gross income maximum for total transportation costs

    Applying the rule ($60,000 annual income):

    • 10% gross income: $6,000 annually = $500 monthly maximum
    • Total transportation budget: $500 (payment + insurance + fuel + maintenance)
    • Insurance estimate: $120 monthly
    • Fuel estimate: $150 monthly
    • Maintenance reserve: $80 monthly
    • Available for payment: $150 monthly
    • At 6%, 48 months: $150 supports $6,300 loan
    • With 20% down: $6,300 ÷ 0.8 = $7,875 maximum purchase price
    • Reality check: Most would exceed ignoring rule and buy $20,000-25,000 vehicle creating financial strain

    When to Buy Cash vs Finance

    Buy cash when:

    • Have funds without depleting emergency reserves
    • Interest rate over 7-8% (avoid high interest costs)
    • Older used vehicle (lenders charge 12%+ on 7+ year old cars)
    • Want debt freedom and payment simplicity
    • Avoiding discipline challenges of monthly payments

    Finance when:

    • Promotional rates under 3% available (essentially free money)
    • Can invest cash earning more than interest rate (5% loan vs 8% investments)
    • Preserves emergency fund (maintain $10,000+ liquid)
    • Builds credit history (if needed and disciplined)
    • Employer offers low-rate financing benefit

    Finance vs invest comparison:

    • Have $25,000 cash, need $25,000 vehicle
    • Option A (pay cash): $0 in interest, $0 in investments
    • Option B (finance at 5%, invest cash at 8%):
    • Finance: $25,000 at 5%, 48 months = $3,300 interest paid
    • Invest: $25,000 at 8%, 4 years = $34,000 ($9,000 gain)
    • Net benefit: $9,000 gain – $3,300 interest = $5,700 better than cash
    • Requires: Discipline to actually invest and not spend, comfortable with debt, stable income

    Accelerating Payoff

    Extra payment strategies:

    • Round up payments ($483 → $500 creating $17 extra monthly)
    • Biweekly payments (26 half-payments = 13 full payments vs 12)
    • Annual lump sum (tax refund, bonus to principal)
    • Refinance to lower rate after credit improvement

    Payoff acceleration example:

    • Loan: $20,000 at 7%, 60 months, $396 monthly
    • Standard payoff: 60 months, $3,760 interest
    • Add $100 monthly ($496 total): 45 months, $2,680 interest
    • Savings: $1,080 interest, 15 months faster

    When to Refinance

    Refinancing makes sense when:

    • Credit score improved 50+ points since original loan
    • Interest rates dropped 1-2% or more
    • Current rate over 8% and qualify for under 6%
    • At least 2 years remaining on loan
    • Not underwater (owe more than vehicle worth)

    Refinance example:

    • Current: $18,000 balance at 10%, 36 months remaining, $581 monthly
    • Refinance: $18,000 at 6%, 36 months, $548 monthly
    • Savings: $33 monthly, $1,188 over remaining term
    • Caution: Don’t extend term when refinancing (defeats interest savings)

    Why Understanding Auto Loans Matters

    Without understanding auto loans, individuals overpay $5,000-15,000 through extended terms creating affordable-appearing payments masking doubled costs, finance new vehicles accepting maximum depreciation losses of $10,000-15,000 in first three years versus strategic used purchases, and overextend on luxury vehicles consuming 15-20% income creating transportation-poor existence sacrificing retirement savings and emergency reserves—while auto-loan-literate individuals purchase reliable 2-3 year old certified pre-owned vehicles capturing 35-40% depreciation savings, limit terms to 48-60 months preventing perpetual underwater scenarios, and maintain total transportation costs under 10-15% gross income preserving financial flexibility, creating dramatically different wealth outcomes where strategic buyers save $20,000-30,000 per vehicle cycle through depreciation avoidance and interest minimization versus irresponsible buyers perpetually trapped in negative equity cycles rolling thousands into successive loans compounding debt burdens impossible to escape without understanding depreciation mathematics, term implications, and new-versus-used strategic selection.

    Understanding auto loans enables individuals to:

    • Calculate true costs including interest, depreciation, and total ownership expenses
    • Optimize credit scores before purchase saving $3,000-8,000 through rate reductions
    • Select appropriate terms balancing payments and total costs preventing underwater traps
    • Evaluate new versus used strategically capturing depreciation savings of $10,000-20,000
    • Recognize dealer tactics and negotiate effectively preventing overpriced purchases
    • Apply 20/4/10 rule maintaining affordable transportation within overall budget
    • Avoid negative equity cycles through disciplined term limits and down payments

    Auto loan knowledge transforms vehicle purchase from emotional decision or dealer-manipulated transaction into strategic transportation investment minimizing total costs through informed term selection, depreciation awareness, and disciplined borrowing limits enabling reliable transportation without financial destruction impossible when extending terms for luxury purchases beyond sustainable income levels.

    Common Misunderstandings

    Many people focus exclusively on monthly payment affordability ignoring total cost. In reality, $400 monthly payment acceptable on 48-month $18,000 loan paying $19,200 total versus dangerous on 84-month $28,000 loan paying $33,600 total demonstrating identical payment can represent good or terrible deal depending on term and total cost, proving payment-only focus enables dealer manipulation extending terms creating “affordable” payments on overpriced vehicles costing thousands extra in interest making total cost calculation essential not monthly payment matching budget alone.

    Another common misconception is new vehicles always better than used due to warranty and reliability. In practice, certified pre-owned 2-3 year old vehicles combine manufacturer warranties with 35-40% depreciation savings—$32,000 new car worth $19,000 after 3 years but still under warranty for 4+ years through CPO program, making CPO purchase saving $13,000 depreciation while maintaining warranty protection proving new vehicles financially inferior for most buyers despite psychological appeal of latest model and full warranty when depreciation costs vastly exceed potential repair savings especially given modern vehicle reliability improvements.

    Some believe longer loan terms make expensive vehicles affordable through lower payments. However, 72-84 month terms on depreciating assets create guaranteed 3-5 year underwater periods trapping owners unable to trade without rolling negative equity compounding problem, vehicle aging faster than payoff creating repair costs while still making payments, and interest costs 2-3x higher than shorter terms proving extended terms create illusion of affordability while destroying wealth through interest waste and perpetual negative equity impossible to escape without cash infusion or driving worthless vehicles years eliminating payments.

    How Auto Loan Understanding Fits Into Financial Success

    Auto loan understanding prevents $20,000-40,000 wealth destruction per vehicle cycle through strategic used purchases avoiding new-car depreciation, term discipline preventing interest waste and underwater traps, and total cost awareness maintaining transportation expenses under 10-15% income—making auto financing literacy essential component preventing second-largest expense category (after housing) from sabotaging wealth building through excessive borrowing on depreciating assets, enabling reliable transportation supporting employment and life requirements without financial destruction through luxury vehicle overextension, and creating sustainable transportation strategy freeing cash flow for productive investments generating returns unlike vehicle depreciation guaranteeing losses impossible without understanding depreciation mathematics, term implications, and disciplined needs-versus-wants vehicle selection aligned with income not emotional desires.

    For example, two individuals both age 28 earning $65,000 needing reliable transportation. Person A lacks auto loan understanding, visits dealership emotionally attracted to new $38,000 SUV. Dealer focuses on monthly payment: “What can you afford monthly?” Person A says “$500 maximum.” Dealer structures 84-month loan at 8%: $38,000 + taxes/fees $3,000 = $41,000 financed at $505 monthly (barely within stated budget). Person A excited about new vehicle, ignores total cost $42,420 over 7 years. Year 1: Vehicle worth $26,600 (30% depreciation), owes $38,100 = $11,500 underwater. Year 3: Worth $20,900, owes $30,800 = $9,900 underwater still. Year 5: HVAC system needs $1,200 repair (warranty expired), transmission issue $2,800, still owes $21,400 on vehicle worth $15,200. Wants to trade but $6,200 underwater forces rolling into new loan. Year 7 finally paid off: Vehicle worth $10,500, paid $42,420 total, net cost $31,920 for 7-year-old vehicle worth $10,500. Additionally: Insurance averaged $1,800 annually ($12,600 total), maintenance/repairs $8,000, fuel $10,500. Total 7-year transportation cost: $63,020 for vehicle now worth $10,500. Person B understands auto loans and depreciation, researches thoroughly determining needs (reliable commuter, $15,000-20,000 budget maximum). Finds 3-year-old CPO version of Person A’s vehicle for $21,000 (captured 45% depreciation), manufacturer warranty remaining 4 years. Down payment $3,000 (14%), finances $18,000 at 5% for 48 months = $415 monthly. Total paid $22,920. Year 1 of ownership (vehicle age 4): Worth $18,500, owes $14,800 = $3,700 equity (never underwater). Year 4 paid off: Vehicle age 7 worth $13,500, paid $22,920 total, drives debt-free 3+ years. Total 7-year cost: Purchase $22,920, insurance $1,400 annually ($9,800), maintenance $5,500 (higher than new but acceptable), fuel $10,500. Total: $48,720. Year 7: Vehicle worth $10,500 same as Person A but spent $48,720 versus $63,020. Difference: Person A’s poor auto loan understanding through new luxury purchase with 84-month term cost $14,300 more ($63,020 vs $48,720) for identical 7-year-old vehicle outcome plus suffered 5 years underwater stress, perpetual payment obligation, and major repairs while still making payments, Person B’s auto loan literacy through strategic CPO purchase and 48-month disciplined term created $14,300 savings, 3 years debt-free ownership, and never-underwater security through understanding depreciation, appropriate term selection, and needs-based vehicle choice versus emotional new-luxury purchase.

    Auto loan understanding separates strategic transportation managers minimizing costs through depreciation awareness from perpetually-indebted luxury vehicle buyers trapped in negative equity cycles, requiring disciplined term limits, realistic needs assessment, and total cost calculation creating measurable wealth differences impossible without auto financing literacy.

    Recent Updates and Trends

    In recent years, average auto loan terms have extended dramatically with 72-84 month loans now representing 30%+ of new vehicle financing versus historical 48-60 month standard, though longer terms create guaranteed underwater periods and interest costs 2-3x higher making term extension financially destructive despite enabling “affordable” monthly payments on expensive vehicles beyond sustainable budgets.

    Vehicle prices have increased substantially with average new car transaction price exceeding $48,000 (2024) versus $32,000 (2015) creating affordability crisis where median household income buyers cannot qualify for median-priced vehicles without extended terms or excessive debt-to-income ratios, though used vehicle strategy purchasing 2-3 year old certified pre-owned maintains affordability through depreciation capture despite new vehicle price inflation.

    Interest rates have fluctuated with Federal Reserve policy seeing auto loan rates increase from 3-5% (2020-2021) to 7-12% (2023-2024) doubling monthly payments on identical vehicles, though fundamental auto financing principles unchanged requiring strategic used purchases, disciplined 48-60 month maximum terms, and credit optimization regardless of rate environment enabling optimal rates within current market conditions.

    Electric vehicle adoption has grown creating new financing considerations including higher purchase prices offset by fuel savings and federal tax credits, battery degradation concerns affecting long-term value, and limited used market creating uncertainty about depreciation patterns, though same fundamental principles apply requiring realistic total cost calculations including charging infrastructure, insurance premiums, and technology obsolescence risks.

    Fundamental auto loan principles remain timeless: purchase reliable transportation not luxury status symbols, capture depreciation through strategic used/CPO selection saving $10,000-20,000, limit terms to 48-60 months preventing perpetual negative equity, maintain total transportation costs under 10-15% gross income preserving financial flexibility—regardless of term extension trends, price inflation, rate environment changes, or EV adoption, understanding depreciation mathematics, disciplined term selection, and needs-based vehicle choice produces superior outcomes through strategic transportation management impossible when emotional purchases and dealer-extended terms create wealth destruction through interest waste and depreciation exposure exceeding transportation value provided.

    3 Things You Can Do Today

    Ready to optimize auto financing strategy? Here are three simple steps you can take right now:

    1. Calculate affordable vehicle price using 20/4/10 rule preventing overextension and transportation-poor existence – Annual gross income: Note exact amount (example: $70,000). Calculate 10% maximum transportation budget: $70,000 × 10% = $7,000 annually = $583 monthly for ALL transportation (payment, insurance, fuel, maintenance). Estimate non-payment costs: Insurance $140 monthly (get actual quote for age/location), fuel $180 monthly (estimate based on commute), maintenance $80 monthly reserve (1% vehicle value annually ÷ 12). Calculate available for payment: $583 – $140 – $180 – $80 = $183 monthly maximum payment. Apply 4-year maximum term: $183 monthly at 6% over 48 months supports $7,900 loan amount. Apply 20% down payment requirement: $7,900 loan ÷ 0.80 = $9,875 affordable purchase price. Reality shock: Most earning $70,000 would attempt $25,000-30,000 vehicle (2.5-3x affordable amount) creating dangerous 18-20% income consumption. Alternative relaxed calculation allowing 15% transportation: $70,000 × 15% = $875 monthly total, minus $320 non-payment costs = $555 payment supports $24,000 loan with 20% down = $30,000 vehicle (more realistic but still requires discipline). Comparison shows: Strict 10% rule = $9,875 vehicle (used economy car), relaxed 15% = $30,000 vehicle (newer reliable sedan), dealer approval likely $40,000+ (72+ months, financial disaster). Takes 15 minutes preventing catastrophic overborrowing through honest affordability calculation impossible when using monthly payment matching instead of total transportation budget percentage methodology.

    2. If considering vehicle purchase within 6-12 months, implement credit optimization potentially saving $3,000-8,000 through rate improvement – Check current credit score: Free through credit card issuer, Credit Karma, or Experian. Identify improvement opportunity: Below 660 (significant work needed), 660-719 (moderate improvement possible), 720+ (optimization minimal but maintains best rates). Calculate rate impact: $25,000 loan 60 months example—660 score gets 10% ($531 monthly, $31,860 total) versus 720+ gets 6% ($483 monthly, $28,980 total), difference $2,880 savings. Implement optimization strategy: (1) Pay down credit cards to under 10% utilization (biggest single impact, 30-60 points possible in 30-90 days if currently high), (2) Dispute any errors on credit reports (AnnualCreditReport.com checking all three bureaus), (3) Perfect payment record next 12 months protecting 35% of score, (4) Avoid new credit applications during optimization period, (5) Become authorized user on parent/spouse old account if available (instant history boost). Timeline: Start 6-12 months before planned purchase giving maximum optimization time, check score quarterly tracking progress, delay purchase if score improving rapidly (waiting 3-6 more months could save thousands). Example improvement: 670 score improves to 730 through $8,000 credit card paydown (reducing 55% utilization to 12% = 40-point boost) plus 12 months perfect payments (15-point boost) plus authorized user strategy (5-point boost) = 60-point improvement creating rate savings from 9% to 6.5% saving $2,400 on $25,000 loan. ROI: Delaying purchase for credit optimization saves multiple thousands making 6-12 month delay worthwhile investment. Takes 30 minutes initial setup plus 6-12 months execution creating $2,000-8,000 savings through strategic credit preparation impossible when purchasing immediately with poor credit permanently locking higher rate.

    3. Calculate total cost comparison between new and strategic used purchase revealing $15,000-25,000 savings potential – Target vehicle: Identify specific make/model desired (example: Honda CR-V). Research three purchase options: NEW ($32,000), 2-YEAR-OLD CPO ($22,500), 4-YEAR-OLD USED ($17,000). Calculate total 5-year ownership cost for each: NEW—Purchase $32,000, down $6,400 (20%), finance $25,600 at 5% 60 months = $483 monthly payments ($28,980 total), insurance $1,600 annually ($8,000 total), maintenance $2,500 (under warranty), fuel $9,000, total cost $48,480, value year 5 $11,200, net cost $37,280 ($48,480 – $11,200). 2-YEAR CPO—Purchase $22,500 (30% depreciation captured), down $3,000, finance $19,500 at 6% 48 months = $458 monthly ($21,984 total), insurance $1,350 annually ($6,750), maintenance $4,000 (partial warranty), fuel $9,000, total $41,734, value year 5 (age 7) $10,000, net cost $31,734. 4-YEAR USED—Purchase $17,000 (47% depreciation captured), down $2,500, finance $14,500 at 7.5% 48 months = $353 monthly ($16,944), insurance $1,200 annually ($6,000), maintenance $6,500 (no warranty), fuel $9,000, total $38,444, value year 5 (age 9) $7,500, net cost $30,944. Comparison results: NEW net cost $37,280, CPO net cost $31,734 (saves $5,546 vs new), USED net cost $30,944 (saves $6,336 vs new, $790 vs CPO). Additional insight: CPO provides best value balance—saves $5,546 versus new while maintaining warranty protection and only $790 more than older used avoiding higher maintenance risk. Depreciation revelation: New vehicle loses $20,800 in 5 years ($32,000 – $11,200), CPO loses $12,500 ($22,500 – $10,000), demonstrating $8,300 depreciation savings from 2-year delay plus another $1,200 total cost savings creating $9,500 total advantage. Decision: CPO strategy optimal for most buyers balancing savings, reliability, warranty protection. Takes 30 minutes calculation revealing substantial savings impossible when emotional new vehicle purchase made without strategic used alternative analysis quantifying depreciation costs and total ownership comparison.

    These actions create auto financing mastery within 90 minutes—calculated affordable vehicle price using 20/4/10 rule preventing overextension ($10,000-20,000 potential savings avoiding excessive purchase), implemented credit optimization saving $2,000-8,000 through rate improvement, and compared new versus used total costs revealing $5,000-10,000 strategic savings potential—transforming auto purchase from emotional decision or dealer-manipulated transaction into strategic transportation investment through disciplined affordability assessment, credit preparation, and depreciation-aware vehicle selection enabling reliable transportation without wealth destruction impossible without auto loan literacy.

    Quick FAQ

    What’s the longest car loan I should get?
    Maximum 60 months for new vehicles, 48 months for used under 3 years old, 36-42 months for 3-6 year old used vehicles maintaining rule that loan term plus vehicle age at purchase should not exceed 8-10 years preventing paying for vehicle past useful life or requiring major repairs: Longer term dangers—72-84 month loans create 3-5 year underwater periods trapping owners unable to trade without rolling negative equity, interest costs 2-3x higher than 48-month terms ($6,000-8,000 versus $3,000-4,000 on $25,000 loan), vehicle aging faster than payoff creating repair needs while still making payments (7-year loan means still paying at year 6-7 when major maintenance needed). Example: $28,000 vehicle, 84-month term at 7% = underwater until year 4, total interest $6,668, vehicle needs $3,000 repairs year 6 while still owing $8,000. Better: 48-month term = underwater only year 1-2, total interest $3,752 (saves $2,916), paid off before major maintenance, own debt-free years 5-8. Recommendation: 48-month maximum creates optimal balance preventing excessive interest while maintaining affordable payments on appropriate vehicle price, 60-month acceptable for new if necessary but only with 20% down preventing extended underwater period, never exceed 60 months regardless of payment temptation as extended terms signal vehicle purchase beyond affordability requiring price reduction not term extension.

    Should I buy new or used?
    Used vehicles 2-3 years old provide superior financial value for most buyers through depreciation savings of $10,000-20,000 versus new while maintaining reliability and warranty protection especially certified pre-owned programs: New advantages—Latest technology and safety, full manufacturer warranty 3-5 years, lower interest rates (4-7%), no unknown history, maximum remaining useful life. New disadvantages—Maximum depreciation exposure (30% year 1, 50% year 3), highest purchase price, highest insurance costs, guaranteed underwater 1-3 years with standard financing. Used advantages—Avoided worst depreciation (buying 2-3 year old captures 35-45% savings), lower purchase price and payments, lower insurance, more vehicle for money (can afford higher trim/features used versus base new). Used disadvantages—Higher interest rates (add 2-4% versus new), limited or expired warranty (CPO programs mitigate), unknown history risks (CPO inspection programs minimize), potentially higher maintenance (age-dependent). Optimal strategy: Purchase 2-3 year old certified pre-owned vehicles combining substantial depreciation savings ($10,000-15,000) with manufacturer warranty (typically 6-7 years total coverage from original sale) and rigorous inspection creating best value balance. Example: $32,000 new vehicle versus $19,000 CPO 3-year-old same model—save $13,000 purchase price, still have 4+ years warranty remaining, slightly higher rate offset by much smaller loan ($19,000 at 7% versus $32,000 at 5% = $368 vs $604 monthly), total ownership cost $8,000-12,000 less over 5 years demonstrating CPO strategy financial superiority for disciplined buyers prioritizing value over new-car psychology.

    How much should I put down on a car?
    Minimum 20% on new vehicles preventing immediate underwater scenario, 10-15% on used vehicles acceptable especially certified pre-owned with lower depreciation risk: Larger down payment benefits—Prevents negative equity (underwater) situations trapping owners, lowers monthly payments through smaller loan amount, reduces total interest paid on lower principal, qualifies for better interest rates (lower loan-to-value ratio), easier approval, sells/trades easier if needed. Lower down payment risks—Immediate underwater on new vehicles (20-30% depreciation year 1 versus 10% down = 10-20% negative equity), higher monthly payments straining budget, more interest paid, harder qualification, perpetual negative equity if trading before equity positive. Strategic analysis: $26,000 vehicle example—$0 down (100% financing) = $26,000 loan, after 1 year owe $23,000 but worth $18,200 = $4,800 underwater. $5,200 down (20%) = $20,800 loan, after 1 year owe $18,200 but worth $18,200 = break-even, never underwater. $7,800 down (30%) = $18,200 loan, after 1 year owe $15,800 but worth $18,200 = $2,400 equity immediately providing trade flexibility. Recommendation: Always 20% minimum on new vehicles (non-negotiable), 15% minimum on newer used (2-4 years old), 10% acceptable on older used or CPO with strong warranty, never 0% down unless promotional manufacturer financing at 0-2% APR making minimal down acceptable through interest savings offsetting underwater risk. If cannot afford 20% down on new vehicle, signals vehicle price too high requiring either cheaper vehicle or continued saving before purchase preventing guaranteed underwater trap from insufficient down payment on rapidly depreciating asset.

    Should I buy or lease?
    Buy for most people creating equity ownership and financial flexibility, lease only for specific business use or unusual personal situations requiring frequent new vehicles despite higher long-term costs: Buying advantages—Builds equity through ownership, no mileage restrictions, can modify or customize, cheaper long-term (own asset after payoff), can keep indefinitely, can sell/trade anytime, investment in asset. Buying disadvantages—Higher monthly payments than lease, responsible for all maintenance after warranty, depreciation risk (though mitigated by long ownership), requires down payment. Leasing advantages—Lower monthly payment (paying depreciation only not full value), always under warranty, new vehicle every 2-3 years, potentially tax deductible if business use. Leasing disadvantages—Never builds equity (perpetual payment without ownership), strict mileage limits (10,000-15,000 annually, $0.25-0.30/mile overage), cannot modify, early termination penalties expensive, wear-and-tear charges at return, more expensive long-term (paying depreciation repeatedly). Cost comparison 9 years: BUY $28,000 vehicle finance 60 months at 6%, own 9 years = Payments 5 years ($31,920 total), own debt-free years 6-9, vehicle worth $8,000 year 9, net cost $23,920. LEASE $28,000 vehicle three consecutive 3-year leases at $350/month = $12,600 per lease × 3 = $37,800 total payments, own nothing year 9, net cost $37,800. Buying saves $13,880 over 9 years plus owns $8,000 asset versus nothing. Recommendation: Buy for 95% of people building wealth through ownership and eliminating payments after payoff, lease only if business tax deduction significant (50%+ payment offset) or genuinely need new vehicles every 2-3 years accepting higher cost for convenience, never lease thinking it’s “cheaper” than buying when long-term math clearly favors ownership.

    What credit score do I need for a good auto loan rate?
    720+ credit score qualifies for best rates saving $3,000-8,000 versus fair-poor credit on typical auto loan: Score ranges and rates (2024 typical)—Excellent 760+ gets 4-6% new, 6-8% used. Good 700-759 gets 6-8% new, 8-10% used. Fair 660-699 gets 8-11% new, 10-13% used. Poor 620-659 gets 11-15% new, 13-17% used. Subprime below 620 gets 15-20% or denied. Cost impact example $24,000 loan 60 months—760+ at 5% = $452 monthly, $27,120 total. 680 at 9% = $498 monthly, $29,880 total (+$2,760). 630 at 14% = $560 monthly, $33,600 total (+$6,480 versus excellent credit). Strategic optimization: If score below 720, delay purchase 6-12 months optimizing credit potentially saving thousands: Pay credit cards to under 10% utilization (30-60 point boost typical if currently high), perfect payment record 12 months (15-30 point boost), dispute errors, authorized user strategy if available. Example: 660 score improves to 725 through aggressive credit card paydown plus perfect payments over 9 months, qualifies for 7% instead of 11% saving $3,200 on $24,000 loan making 9-month delay worthwhile investment. Minimum viable: 620 generally minimum for approval but rates very high (14-16%), below 620 often denied or subprime specialty lenders at 18-22% (nearly credit card rates, avoid if possible). Best practice: Target 720+ before auto loan application through 6-12 month credit optimization strategy, delay purchase if needed as rate savings vastly exceed any vehicle price appreciation during preparation period, never accept high-rate loan thinking “I’ll refinance later” as future refinance not guaranteed if underwater or credit doesn’t improve as expected.

    Explore More in Money Basics

    Disclosure

    This article provides general educational information about auto loans and vehicle financing. Individual loan terms, interest rates, qualification requirements, down payment options, and appropriate borrowing amounts vary significantly based on circumstances including credit, income, vehicle type, age, and lender policies. Auto loan rates and programs subject to frequent changes and lender discretion. This is not financial advice or guarantee of loan approval or specific terms. Vehicles depreciate rapidly and substantially creating significant financial loss and potential negative equity situations. Depreciation rates vary by make, model, market conditions, and vehicle condition. Total cost calculations and ownership comparisons represent typical scenarios with assumptions about depreciation, interest rates, insurance, maintenance, and fuel costs—actual results vary substantially. The 20/4/10 rule represents conservative guideline not universal requirement—individual budgets and circumstances vary. Credit score impacts on rates represent typical scenarios—individual pricing adjustments vary by complete credit profile and lender. Manufacturer promotional rates subject to qualification, vehicle availability, and program changes. Certified pre-owned programs and warranty coverage vary by manufacturer—verify specific program terms. Consult qualified auto finance professionals and financial advisors for personalized guidance matching individual situations. Focus on conservative affordability assessment within total transportation budget rather than maximizing approval amounts creating financial vulnerability. Buy versus lease analysis contains assumptions about ownership duration, mileage, maintenance, and residual values—individual results vary. Advertisements or sponsored content may appear within or alongside this content. All information presented independently for educational purposes only.

  • 5.4 Mortgage Loans Explained: How Home Loans Really Work

    5.4 Mortgage Loans Explained: How Home Loans Really Work

    Mortgage loans are secured debts specifically for purchasing or refinancing real estate where property serves as collateral enabling lenders to foreclose if borrowers default—typically featuring long repayment terms (15-30 years standard), lower interest rates (6-8% currently) than unsecured debt through collateral security, and substantial borrowing amounts ($100,000-$1,000,000+ depending on property value and borrower qualifications). Representing largest debt most Americans ever incur, mortgages enable homeownership impossible for 90%+ of buyers through cash purchase alone—median home prices $400,000+ nationally requiring $80,000 down payment plus $320,000 financed at 7% creating $2,128 monthly payments over 30 years totaling $766,080 paid including $446,080 interest demonstrating massive long-term costs while simultaneously building $400,000+ equity through principal reduction and appreciation making mortgages simultaneously most expensive and most wealth-generating debt when property appreciates and payments affordable. Understanding mortgage mechanics, qualification requirements, loan types (conventional, FHA, VA, USDA), interest rate impacts, down payment strategies, and total cost calculations determines whether homeownership creates wealth through equity accumulation and forced savings versus financial destruction through overextension, foreclosure risk, or underwater scenarios where home value drops below loan balance trapping owners unable to sell without bringing cash to closing making mortgage literacy essential for largest financial decision most people ever make.

    Notebook sketch explaining personal finance

    This article is designed for anyone considering home purchase, current homeowners wanting refinancing understanding, or those confused by mortgage terminology and qualification processes. You do not need financial expertise to understand mortgages—fundamental concepts accessible through clear explanations of loan mechanics, types, qualification criteria, and strategic considerations, though requires honest income assessment ensuring payment affordability within 28-30% gross income guidelines, realistic home price evaluation preventing overextension through emotional buying, and long-term commitment recognition that mortgages create 15-30 year obligations survived only through disciplined payment prioritization and stable income maintenance preventing foreclosure destroying credit and forfeiting down payment investment plus equity through inability to sustain payments during income disruption or unexpected expenses.

    Understanding mortgage loans matters because single home purchase decision determines $200,000-500,000+ wealth creation through equity versus rent expense building landlord’s wealth, quarter-point interest rate difference costs $50,000-100,000+ over 30-year term making rate optimization critical, and appropriate versus excessive borrowing separates comfortable homeownership from financially-stressed house-poor existence—while mortgage-literate individuals qualify for optimal rates through excellent credit and stable employment, limit borrowing to affordable amounts maintaining emergency reserves and retirement contributions, and understand total costs including interest, taxes, insurance, and maintenance creating realistic ownership budgets, versus irresponsible borrowers maxing approval amounts leaving zero financial cushion, neglecting total cost calculations focusing only on monthly payments, and overextending through houses beyond sustainable income levels creating foreclosure risk and financial destruction impossible to recover from without strategic mortgage understanding enabling informed borrowing aligned with long-term wealth building not emotional home selection.

    Educational disclaimer: This article provides general educational information about mortgage loans. Individual loan terms, qualification requirements, interest rates, and appropriate borrowing amounts vary significantly based on circumstances including credit, income, property type, location, and lender. Mortgage rates and programs subject to market changes and lender discretion. This is not financial advice, mortgage lending advice, or guarantee of loan approval. Real estate carries risks including property value decline, market downturns, and potential foreclosure. Consult qualified mortgage professionals and real estate advisors for personalized guidance matching individual situations.

    Mortgage Basics and How They Work

    Core Mortgage Mechanics

    Key components:

    • Principal: Loan amount borrowed (home price minus down payment)
    • Interest: Cost of borrowing expressed as APR (6-8% typical currently)
    • Term: Repayment period (30 years most common, 15 years second)
    • Monthly payment: Principal + interest + property taxes + homeowners insurance (PITI)
    • Collateral: Property securing loan (lender can foreclose if default)

    Standard mortgage transaction:

    • Step 1: Pre-approval (lender evaluates income, credit, debt qualifying buyer for amount)
    • Step 2: Home search within pre-approved budget
    • Step 3: Offer accepted, full mortgage application submitted
    • Step 4: Property appraisal confirming value supports loan amount
    • Step 5: Underwriting approval reviewing all documentation
    • Step 6: Closing (sign documents, transfer funds, receive keys)
    • Step 7: Monthly payments for 15-30 years until fully repaid

    Amortization: How Payments Work

    Amortization definition:

    • Gradual loan payoff through scheduled payments
    • Early payments mostly interest, later payments mostly principal
    • Same payment amount monthly but composition changes
    • Builds equity slowly initially, accelerates over time

    30-year $300,000 mortgage at 7% example ($1,995 monthly payment):

    Payment 1 (Month 1):

    • Total payment: $1,995
    • Interest: $1,750 (goes to lender)
    • Principal: $245 (reduces loan balance, builds equity)
    • Remaining balance: $299,755

    Payment 60 (Year 5):

    • Total payment: $1,995
    • Interest: $1,644
    • Principal: $351
    • Remaining balance: $281,534

    Payment 180 (Year 15, halfway point):

    • Total payment: $1,995
    • Interest: $1,199
    • Principal: $796
    • Remaining balance: $205,360 (paid $360,000 but only $94,640 principal reduction)

    Payment 300 (Year 25):

    • Total payment: $1,995
    • Interest: $513
    • Principal: $1,482
    • Remaining balance: $87,702

    Payment 360 (Final payment):

    • Total payment: $1,995
    • Interest: $12
    • Principal: $1,983
    • Remaining balance: $0

    Total paid over 30 years: $718,200 ($1,995 × 360 months)

    Total interest paid: $418,200 ($718,200 – $300,000)

    Interest as percentage of original loan: 139%

    Why Mortgages Enable Homeownership

    Median home purchase scenario:

    • Median U.S. home price: $400,000
    • 20% down payment: $80,000 (requires years of saving for most)
    • Mortgage amount: $320,000
    • Monthly payment: $2,128 at 7% (30 years)

    Alternative without mortgage (all-cash purchase):

    • Save $400,000 before buying
    • At $2,000 monthly savings: 16.7 years to save full amount
    • By then home likely costs $600,000+ (5% annual appreciation)
    • Effectively impossible for median-income buyers

    Mortgage advantage:

    • Homeownership achieved with $80,000 (doable in 3-4 years saving)
    • Building equity immediately through payments
    • Benefiting from appreciation while paying off
    • Fixed housing cost versus rising rent
    Advertisement

    Financial Wellness Planner

    Types of Mortgage Loans

    Conventional Mortgages

    Characteristics:

    • Not government-insured (backed by Fannie Mae or Freddie Mac)
    • Minimum credit score: 620 typical, 740+ for best rates
    • Down payment: 3-20% (under 20% requires PMI)
    • Loan limits: $766,550 (2024) in most areas, higher in expensive markets
    • Best rates for well-qualified borrowers

    Private Mortgage Insurance (PMI):

    • Required when down payment under 20%
    • Cost: 0.3-1.5% of loan amount annually
    • Example: $300,000 loan, 0.8% PMI = $2,400 annually ($200 monthly)
    • Removable once equity reaches 20% (request removal or automatic at 22%)
    • Increases total monthly payment until removed

    Conventional loan example:

    • Purchase price: $350,000
    • Down payment: $35,000 (10%)
    • Loan amount: $315,000
    • Interest rate: 7% (good credit)
    • Principal + interest: $2,095 monthly
    • PMI: $200 monthly (0.76% annually)
    • Total: $2,295 monthly until 20% equity reached

    FHA Loans (Federal Housing Administration)

    Characteristics:

    • Government-insured enabling lower credit and down payment requirements
    • Minimum credit score: 580 for 3.5% down, 500-579 requires 10% down
    • Down payment: 3.5% minimum
    • Loan limits: Similar to conventional ($498,257 in most areas 2024)
    • Easier qualification for first-time buyers or lower credit

    FHA Mortgage Insurance:

    • Upfront premium: 1.75% of loan amount (financed into loan)
    • Annual premium: 0.45-1.05% depending on loan terms
    • Cannot be removed (except refinance to conventional once 20% equity)
    • Permanent for loans over 90% LTV, life of loan

    FHA loan example:

    • Purchase price: $300,000
    • Down payment: $10,500 (3.5%)
    • Base loan: $289,500
    • Upfront premium: $5,066 (1.75%)
    • Total loan: $294,566
    • Interest rate: 7%
    • Principal + interest: $1,959
    • Annual MI: $245 monthly (0.85% annually)
    • Total: $2,204 monthly (MI permanent)

    VA Loans (Veterans Affairs)

    Characteristics:

    • Available to eligible veterans, active duty, National Guard/Reserves
    • No down payment required (0% down possible)
    • No mortgage insurance required
    • Competitive interest rates (often 0.25-0.5% lower than conventional)
    • No loan limits for qualified borrowers
    • Funding fee: 1.4-3.6% (can be financed, waived for disabled veterans)

    VA loan advantages example:

    • Purchase price: $350,000
    • Down payment: $0 (0% down)
    • Funding fee: $9,100 (2.6% first-time use)
    • Total loan: $359,100
    • Interest rate: 6.5% (lower than conventional)
    • Monthly payment: $2,270
    • No PMI/MI (saves $200-300 monthly versus conventional)
    • Best option for eligible veterans

    USDA Loans (Rural Development)

    Characteristics:

    • For rural and suburban properties in designated areas
    • Income limits apply (varies by location, typically under 115% area median)
    • No down payment required (100% financing)
    • Mortgage insurance: 1% upfront, 0.35% annual
    • Property must be in USDA-eligible area and primary residence

    Jumbo Loans

    Characteristics:

    • Exceed conforming loan limits ($766,550 in most areas)
    • Not backed by Fannie Mae/Freddie Mac
    • Higher credit requirements (700+ minimum, 740+ for best rates)
    • Larger down payments (10-20% typical)
    • Higher interest rates (0.25-0.75% above conforming)
    • Stricter qualification (reserves, debt-to-income, documentation)

    Fixed-Rate vs Adjustable-Rate Mortgages

    Fixed-Rate Mortgages (Most Common)

    Characteristics:

    • Interest rate locked for entire loan term
    • Monthly principal + interest payment never changes
    • Predictable budgeting advantage
    • Protection against rising rates
    • Typical terms: 30-year, 15-year, 20-year

    30-year fixed pros and cons:

    • Pros: Lowest monthly payment, maximum affordability, payment stability
    • Cons: Highest total interest paid, slowest equity building, highest rates (vs 15-year)

    15-year fixed pros and cons:

    • Pros: Lower interest rate (typically 0.5% less than 30-year), massive interest savings, faster equity building, debt-free 15 years sooner
    • Cons: Higher monthly payment (60-70% higher), reduced cash flow flexibility, qualification more difficult

    Comparison example ($300,000 loan):

    30-year at 7%:

    • Monthly payment: $1,995
    • Total paid: $718,200
    • Total interest: $418,200

    15-year at 6.5%:

    • Monthly payment: $2,613 (31% higher)
    • Total paid: $470,340
    • Total interest: $170,340
    • Savings versus 30-year: $247,860 in interest

    Adjustable-Rate Mortgages (ARMs)

    How ARMs work:

    • Initial fixed period (3, 5, 7, or 10 years typical)
    • After fixed period, rate adjusts periodically (annually typical)
    • Adjustments based on index (SOFR, T-Bill) plus margin
    • Rate caps limit adjustment amount (annual and lifetime)
    • Lower initial rate than fixed-rate mortgages

    Common ARM structures:

    • 5/1 ARM: Fixed 5 years, then adjusts annually
    • 7/1 ARM: Fixed 7 years, then adjusts annually
    • 10/1 ARM: Fixed 10 years, then adjusts annually

    ARM example (5/1 ARM):

    • Loan: $300,000
    • Initial rate: 6% (1% lower than fixed)
    • Years 1-5: $1,799 monthly
    • Year 6: Rate adjusts to 7% (max 2% annual increase) = $1,956 monthly
    • Year 7: Could adjust to 9% if rates rise = $2,251 monthly
    • Lifetime cap: Typically 5% above start (6% → 11% maximum)

    When ARMs make sense:

    • Confident selling/refinancing before adjustment (move in 3-7 years)
    • Expect income growth covering potential payment increases
    • Declining rate environment (benefit from adjustments down)
    • Lower initial payment enables home purchase otherwise unaffordable

    ARM risks:

    • Payment shock when rates adjust upward
    • Inability to refinance if home value drops (underwater)
    • Staying longer than planned forcing adjustment exposure
    • Budget uncertainty complicating financial planning
    Advertisement
    Reserved space for in-content ad

    Qualifying for a Mortgage

    Credit Score Requirements

    Score ranges and loan access:

    • 760+: Best rates, all loan types available, easiest approval
    • 700-759: Good rates, most programs accessible, 0.25-0.5% higher than best
    • 660-699: Fair rates, conventional possible, 0.5-1% higher rates
    • 620-659: Higher rates, FHA best option, 1-1.5% above best rates
    • 580-619: FHA only typically, 1.5-2% above best rates
    • Below 580: Very difficult, FHA with 10% down or denied

    Rate impact example ($300,000 loan, 30 years):

    • 760+ score at 6.5%: $1,896 monthly, $682,560 total paid
    • 680 score at 7.25%: $2,047 monthly, $736,920 total paid
    • 620 score at 8%: $2,201 monthly, $792,360 total paid
    • Cost of poor credit: $109,800 more paid (620 vs 760+ score)

    Debt-to-Income Ratio (DTI)

    Two DTI calculations:

    Front-end DTI (housing ratio):

    • Formula: Total monthly housing payment ÷ gross monthly income
    • Includes: Principal, interest, taxes, insurance, HOA fees, PMI
    • Conventional limit: 28% typically
    • FHA limit: 31% typically

    Back-end DTI (total debt ratio):

    • Formula: All monthly debt payments ÷ gross monthly income
    • Includes: Housing + car loans + student loans + credit cards + personal loans
    • Conventional limit: 36-43%
    • FHA limit: 43-50% with compensating factors

    DTI qualification example:

    • Gross monthly income: $8,000
    • Proposed housing payment: $2,200 (PITI)
    • Other debts: $600 (car $350, student loan $250)
    • Front-end DTI: $2,200 ÷ $8,000 = 27.5% (acceptable)
    • Back-end DTI: $2,800 ÷ $8,000 = 35% (acceptable)
    • Qualified for conventional mortgage

    DTI violation example:

    • Gross monthly income: $6,000
    • Proposed housing: $2,200
    • Other debts: $800
    • Front-end: $2,200 ÷ $6,000 = 36.7% (exceeds 28% limit)
    • Back-end: $3,000 ÷ $6,000 = 50% (exceeds 43% limit)
    • Denied conventional, may qualify FHA with strong compensating factors or require less expensive home

    Down Payment Requirements

    Minimum down payments by loan type:

    • Conventional: 3% minimum (5-20% typical)
    • FHA: 3.5% minimum
    • VA: 0% (eligible veterans)
    • USDA: 0% (eligible rural properties)

    20% down payment advantages:

    • No PMI requirement (saves $100-300 monthly)
    • Better interest rates (lower risk for lender)
    • Instant 20% equity (protection against value decline)
    • Lower monthly payment (smaller loan amount)
    • Stronger offers (sellers prefer larger down payments)

    Low down payment trade-offs:

    • PMI/MI costs ($100-300 monthly)
    • Higher interest rates
    • Limited equity creating underwater risk
    • Higher monthly payments (larger loan)
    • Qualification more difficult (higher LTV ratio)

    Income and Employment Verification

    Required documentation:

    • 2 years tax returns (W-2s, 1099s)
    • 2 recent pay stubs
    • 2 months bank statements
    • Employment verification (VOE)
    • 2-year employment history

    Self-employed additional requirements:

    • 2 years business tax returns (full returns with schedules)
    • Profit and loss statements
    • Business bank statements
    • CPA letter or business license
    • Income calculated conservatively (net after expenses)

    Reserves Requirements

    Cash reserves definition:

    • Liquid assets remaining AFTER down payment and closing costs
    • Measured in months of PITI payments
    • Conventional typically requires 2-6 months
    • Jumbo loans require 6-12 months

    Reserves example:

    • Monthly PITI: $2,500
    • Required reserves: 6 months
    • Must have: $15,000 liquid ($2,500 × 6) AFTER down payment/closing
    • Qualifying assets: Checking, savings, money market, taxable investments
    • Non-qualifying: Retirement accounts (counted at 60-70%), home equity, personal property

    Total Cost of Homeownership

    Beyond the Mortgage Payment

    PITI breakdown:

    Principal and Interest (PI):

    • $300,000 loan at 7%, 30 years = $1,995

    Property Taxes (T):

    • Varies by location (0.5-2.5% of home value annually)
    • Example: $350,000 home, 1.2% rate = $4,200 annually ($350 monthly)

    Homeowners Insurance (I):

    • $1,000-$3,000 annually typical ($85-250 monthly)
    • Higher in disaster-prone areas (hurricanes, earthquakes, floods)
    • Example: $1,500 annually = $125 monthly

    Total PITI example:

    • PI: $1,995
    • Taxes: $350
    • Insurance: $125
    • PMI (if under 20% down): $200
    • Total: $2,670 monthly

    Additional Ownership Costs

    HOA fees (if applicable):

    • $50-$500+ monthly depending on amenities
    • Covers: Common area maintenance, amenities, insurance, reserves
    • Can increase annually

    Maintenance and repairs:

    • Rule of thumb: 1-3% of home value annually
    • $350,000 home: $3,500-$10,500 annually ($290-875 monthly budget)
    • Covers: HVAC, roof, appliances, plumbing, electrical, landscaping

    Utilities:

    • Electric, gas, water, sewer, trash: $200-500 monthly typical
    • Higher than apartment/rental typically (more space, lawn care)

    Complete monthly ownership cost example:

    • PITI: $2,670
    • HOA: $150
    • Maintenance reserve: $400
    • Utilities: $300
    • Total: $3,520 monthly ($42,240 annually)

    One-Time Closing Costs

    Typical closing cost range: 2-5% of purchase price

    Breakdown ($350,000 purchase):

    • Loan origination fee: $3,500 (1%)
    • Appraisal: $500-700
    • Credit report: $100
    • Title insurance: $1,500-2,500
    • Title search and exam: $400-800
    • Survey: $400-600
    • Attorney fees: $500-1,500
    • Recording fees: $100-300
    • Prepaid property taxes: $1,000-3,000
    • Prepaid insurance: $1,000-2,000
    • Homeowners association transfer: $200-500
    • Total: $9,000-$15,000 typical

    Total cash needed at purchase:

    • Down payment: $70,000 (20%)
    • Closing costs: $12,000
    • Moving expenses: $2,000
    • Immediate repairs/updates: $3,000
    • Emergency reserve: $10,000 (2 months PITI + maintenance)
    • Total: $97,000 for $350,000 home purchase
    Advertisement
    Reserved space for in-content ad

    Buy vs Rent Analysis

    30-Year Comparison

    Homeownership scenario:

    • Purchase: $350,000 home
    • Down payment: $70,000 (20%)
    • Mortgage: $280,000 at 7%, 30 years
    • Monthly PITI: $2,345 ($1,863 PI + $350 tax + $132 insurance)
    • Maintenance: $350 monthly average
    • Total monthly: $2,695
    • 30-year total paid: $970,200 ($2,695 × 360 months)
    • Home value after 30 years: $910,000 (3.5% appreciation)
    • Equity owned: $910,000 (mortgage fully paid)
    • Net wealth: $910,000 home minus $970,200 paid + $70,000 down = Break-even considering appreciation
    • Housing cost years 31+: $482 monthly (taxes + insurance + maintenance only, no mortgage)

    Renting scenario:

    • Initial rent: $2,200 monthly (comparable property)
    • Rent increases: 3% annually average
    • Year 1-10 average: $2,500 monthly
    • Year 11-20 average: $3,300 monthly
    • Year 21-30 average: $4,400 monthly
    • 30-year total rent paid: $1,140,000
    • Equity owned: $0
    • Net wealth: -$1,140,000 (pure expense)
    • Initial $70,000 invested instead: $540,000 at 7% return over 30 years
    • Net position: $540,000 investments minus $1,140,000 rent = -$600,000
    • Housing cost years 31+: $5,700 monthly (rent continues rising)

    Wealth difference: $1,510,000 (homeowner $910,000 equity vs renter -$600,000 net position)

    When Renting Makes Sense

    Appropriate renting scenarios:

    • Uncertain location (job relocation likely within 3-5 years)
    • Insufficient down payment or emergency fund
    • Credit repair needed (improving score 1-2 years for better rates)
    • Income instability (unemployment risk, variable commission income)
    • Very expensive market (rent-to-price ratio favorable to renting)
    • Short-term stay (under 5 years, transaction costs exceed benefits)

    Break-even timeline:

    • Transaction costs (buying + selling): 8-10% of home value
    • $350,000 home: $28,000-35,000 transaction costs
    • Requires 3-5 years appreciation to recover costs
    • Staying under 5 years often makes renting financially better

    Strategic Mortgage Management

    Accelerating Payoff

    Extra payment strategies:

    Strategy 1: Additional principal monthly

    • $300,000 at 7%, standard payment $1,995
    • Add $500 monthly to principal: $2,495 total
    • Payoff: 16 years vs 30 years
    • Interest saved: $283,000
    • 14 years of payments eliminated

    Strategy 2: Biweekly payments

    • Pay half mortgage every 2 weeks instead of monthly
    • 26 half-payments = 13 full payments vs 12 monthly
    • One extra payment annually applies to principal
    • Payoff: 24-25 years vs 30
    • Interest saved: $60,000-80,000

    Strategy 3: Lump sum applications

    • Tax refunds, bonuses, inheritances applied to principal
    • $10,000 lump sum payment year 5 saves $20,000+ interest
    • Reduces balance faster in high-interest early years

    Refinancing Considerations

    When refinancing makes sense:

    • Interest rates dropped 0.75-1%+ below current rate
    • Improved credit score enabling better rates
    • Reaching 20% equity eliminating PMI
    • Cash-out refinance for home improvements adding value
    • Switching from ARM to fixed rate for stability

    Refinance example:

    • Current: $280,000 balance at 8%, 25 years remaining, $2,156 monthly
    • Refinance: $280,000 at 6.5%, 30 years, $1,770 monthly
    • Monthly savings: $386
    • Closing costs: $5,000
    • Break-even: 13 months ($5,000 ÷ $386)
    • Staying 5+ years: $23,160 savings ($386 × 60 – $5,000 costs)

    Refinance warnings:

    • Resetting to 30 years extends total payoff time
    • Closing costs ($3,000-$8,000) must be recovered through savings
    • Cash-out refinancing increases debt and payment
    • PMI may be re-triggered if refinancing under 20% equity

    Avoiding Foreclosure

    Early intervention critical:

    • Contact lender IMMEDIATELY when payment difficulty arises
    • Options available BEFORE default unavailable after
    • 30-day late payment damages credit, foreclosure destroys it

    Loss mitigation options:

    • Forbearance: Temporary payment pause/reduction (3-12 months)
    • Repayment plan: Spread missed payments over 6-12 months
    • Loan modification: Permanent term extension or rate reduction
    • Short sale: Sell for less than owed with lender approval
    • Deed in lieu: Transfer property to lender avoiding foreclosure

    Foreclosure consequences:

    • Credit score drops 200-300 points
    • Foreclosure remains on credit 7 years
    • Mortgage qualification impossible 3-7 years
    • Down payment forfeited plus any equity
    • Potential deficiency judgment if home sells below balance
    • Tax consequences (forgiven debt treated as income)

    Why Understanding Mortgages Matters

    Without understanding mortgages, individuals overpay $50,000-100,000+ through poor credit preparation accepting higher rates, overborrow creating house-poor existence consuming 40-50% income leaving zero savings capacity, and miss strategic opportunities like 15-year terms saving $200,000+ interest or refinancing reducing payments $300-500 monthly—while mortgage-literate individuals optimize credit scores before applying capturing lowest rates, limit borrowing to 28% gross income maintaining financial flexibility and emergency reserves, and understand total costs including maintenance, taxes, insurance preventing shock from ownership expenses exceeding mortgage payments, creating dramatically different outcomes where strategic buyers build $500,000-1,000,000 equity over 30 years through affordable homeownership versus irresponsible buyers facing foreclosure through overextension or permanent renting through qualification failure missing wealth-building opportunity impossible without mortgage literacy enabling informed borrowing decisions.

    Understanding mortgages enables individuals to:

    • Calculate true affordability including all ownership costs beyond mortgage payment
    • Optimize credit and debt-to-income ratios qualifying for best rates saving $50,000-100,000+
    • Compare loan types (conventional, FHA, VA) selecting optimal program and terms
    • Evaluate 15-year versus 30-year terms weighing payment affordability against interest savings
    • Understand total costs including down payment, closing, maintenance, reserves required
    • Make informed buy-versus-rent decisions based on timeframe and market conditions
    • Implement strategic payoff acceleration or refinancing creating substantial savings

    Mortgage knowledge transforms homeownership from emotional decision or feared impossibility into strategic wealth-building investment evaluating affordability, optimizing terms, and managing debt effectively creating substantial equity impossible without understanding qualification requirements, loan mechanics, and total cost calculations enabling informed decisions.

    Common Misunderstandings

    Many people assume monthly mortgage payment equals total housing cost. In reality, PITI (principal, interest, taxes, insurance) plus HOA fees, maintenance reserves, and utilities typically add 30-50% to base mortgage payment—$1,800 mortgage becomes $2,500-2,700 total monthly ownership cost including all factors, proving payment affordability calculations must include complete expenses not just principal and interest preventing surprise from property taxes ($200-500 monthly), insurance ($100-250), maintenance ($200-400), and utilities ($200-400) creating actual costs vastly exceeding quoted mortgage payment.

    Another common misconception is 20% down payment required for all mortgages. In practice, conventional loans available with 3% down, FHA requires 3.5%, VA and USDA offer 0% down for eligible buyers, making homeownership accessible with $10,000-20,000 versus assumed $60,000-80,000 for 20% down though lower down payments require PMI adding $100-300 monthly and create limited equity risking underwater scenarios if property values decline, proving 20% down optimal but not required making homeownership possible sooner for disciplined buyers accepting PMI costs temporarily versus waiting years saving 20% down.

    Some believe renting always “throwing money away” versus owning building equity. However, homeownership includes substantial costs beyond mortgage—property taxes, insurance, maintenance, HOA fees, transaction costs buying and selling (8-10% combined)—making renting financially superior for short timelines under 5 years or unstable situations where flexibility valuable, plus home appreciation not guaranteed with markets experiencing 20-40% declines in downturns creating losses exceeding rent paid, proving buy-versus-rent requires honest analysis of timeline, market conditions, and total costs not automatic assumption that ownership always superior regardless of circumstances.

    How Mortgage Understanding Fits Into Financial Success

    Mortgage understanding enables $500,000-1,000,000 wealth creation through homeownership building equity versus rent expense, prevents financial destruction through overextension creating foreclosure risk or house-poor existence, and optimizes borrowing costs saving $50,000-100,000+ through credit preparation and loan selection—making mortgage literacy essential component of wealth building requiring honest affordability assessment limiting housing to 28% gross income, strategic timing preparing credit and down payment before applying, and comprehensive cost evaluation including maintenance, taxes, insurance beyond mortgage payments, transforming homeownership from emotional dream or feared impossibility into calculated investment creating measurable wealth when appropriate house purchased with sustainable financing versus financial disaster when excessive home financed beyond income capacity creating impossible payment burden impossible without understanding qualification requirements, total costs, and strategic mortgage management.

    For example, two couples both age 30 earning $90,000 combined deciding on housing. Couple A lacks mortgage understanding, emotionally attached to $450,000 home despite financial advisor recommendation for $350,000 maximum. Approved for $450,000 with 5% down FHA loan ($22,500 down), 7% rate, $2,847 PI payment plus $375 taxes, $150 insurance, $225 PMI, $200 HOA = $3,797 monthly (50% of $90,000 gross income). Stretches budget dramatically, zero emergency fund after closing costs. Year 2: HVAC failure $8,000, puts on credit card unable to pay cash (no reserves). Year 4: Job loss for one spouse, income drops to $55,000, cannot afford $3,797 payment, misses 2 payments damaging credit, forces desperate job acceptance at lower pay. Year 7: Still struggling with payments consuming 55% of now $82,000 income (raises minimal due to career setback), zero retirement savings (cannot afford), $25,000 credit card debt from emergencies and cash flow gaps, marriage stress from financial strain. Year 15: Refinance impossible (credit damage from late payments), home worth $550,000 but owe $390,000 = only $160,000 equity after 15 years. Retirement accounts $40,000 (minimal contributions). Net worth $200,000 minus lingering debt. Couple B understands mortgage mechanics, researches thoroughly before home search. Determines affordable payment 28% gross income = $2,100 housing maximum. Searches homes in $300,000-320,000 range. Purchases $310,000 home, 20% down ($62,000 saved over 3 years), 7% rate, $1,659 PI plus $260 taxes, $120 insurance = $2,039 monthly (27% income, comfortable). Maintains $25,000 emergency fund after purchase. Year 2: HVAC failure $8,000, pays cash from emergency fund, replenishes over 10 months. Year 4: Job loss, maintains payments from emergency fund while searching (6 months reserves), accepts comparable new position. Year 7: Payments comfortable 25% of income, retirement contributions $850 monthly, no consumer debt. Year 15: Home worth $480,000, owe $210,000 = $270,000 equity. Retirement accounts $240,000 from consistent contributions. Net worth $510,000. Difference: Couple A’s poor mortgage understanding through overextension created $310,000 wealth gap ($200,000 vs $510,000 net worth) plus 15 years financial stress, damaged credit, marriage strain from identical starting incomes through excessive home purchase consuming 50% income leaving zero cushion for emergencies or retirement, Couple B’s mortgage literacy through disciplined 28% housing limit enabled comfortable homeownership, wealth building through equity and retirement contributions, and financial stability surviving income disruption through maintained reserves demonstrating $310,000+ wealth difference from understanding affordable borrowing limits, total cost calculations, and strategic mortgage selection impossible when emotional home choice drives excessive borrowing.

    Mortgage understanding separates wealthy homeowners building substantial equity through affordable strategic purchases from foreclosure victims or house-poor strugglers through overextension, requiring honest affordability assessment, comprehensive cost evaluation, and disciplined borrowing limits creating measurable wealth differences impossible without mortgage literacy.

    Recent Updates and Trends

    In recent years, mortgage rates have fluctuated dramatically with Federal Reserve policy changes seeing rates rise from 3% (2020-2021) to 7-8% (2023-2024) doubling monthly payments and reducing buyer purchasing power 30-40%, though fundamental mortgage principles unchanged requiring affordability assessment at current rates not historical lows creating false expectations about sustainable payment levels.

    Home prices have appreciated significantly in most markets with median prices increasing 40-60% since 2019 creating affordability challenges where median home requiring median income percentage rising from 25% to 35-40% in many areas, though homeownership still produces superior long-term wealth outcomes versus renting despite higher entry barriers requiring larger down payments and higher incomes for qualification.

    Alternative mortgage products have emerged including non-QM loans for self-employed or complex income borrowers, though featuring higher rates and requiring substantial documentation making traditional qualified mortgages preferable for W-2 employees with standard income despite seeming appeal of alternative products promising easier qualification often masking higher costs and risks.

    First-time buyer programs have expanded in many states offering down payment assistance, reduced PMI, or favorable rates, though eligibility requirements and program availability vary requiring research into state housing finance agency offerings potentially saving $5,000-15,000 in down payment or closing costs making exploration worthwhile before conventional financing.

    Fundamental mortgage principles remain timeless: limit housing to 28-30% gross income maintaining affordability and flexibility, optimize credit scores before applying capturing lowest rates saving tens of thousands, understand total costs beyond mortgage including taxes, insurance, maintenance preventing shock, and maintain emergency reserves surviving income disruption without foreclosure risk—regardless of rate environment changes, price appreciation, product innovation, or assistance program expansion, understanding qualification requirements, total cost calculations, and disciplined affordability limits produces superior outcomes through strategic homeownership building substantial wealth impossible when emotional decisions or poor preparation create overextension leading to foreclosure or permanent renting missing wealth-building opportunity.

    3 Things You Can Do Today

    Ready to optimize mortgage strategy? Here are three simple steps you can take right now:

    1. Calculate true affordable home price using 28% gross income rule preventing overextension and house-poor existence – Current or expected gross annual income: Note exact amount (example: $85,000). Calculate 28% gross monthly income maximum housing payment: $85,000 ÷ 12 = $7,083 monthly gross, $7,083 × 28% = $1,983 maximum total housing payment (PITI). Subtract property taxes estimate: Research target area tax rates (example: 1.2% annually), estimate taxes on target price range ($350,000 home × 1.2% = $4,200 annually = $350 monthly). Subtract homeowners insurance: Estimate $1,200-1,800 annually ($100-150 monthly). Subtract HOA if applicable: Average $150 monthly in target neighborhood. Subtract PMI if under 20% down: Estimate $150 monthly if planning 10% down. Calculate maximum PI payment: $1,983 total minus $350 tax minus $125 insurance minus $150 HOA minus $150 PMI = $1,208 available for principal and interest. Use mortgage calculator determining affordable loan amount: $1,208 monthly at 7% over 30 years = $182,000 maximum affordable loan. Add down payment to determine maximum purchase price: $182,000 loan + $36,000 down (20% to avoid PMI) = $218,000 affordable purchase OR $182,000 + $18,000 down (10%) = $200,000 purchase if comfortable with PMI. Reality check: If target homes are $350,000 but calculation shows $200,000 affordable, either increase income, save larger down payment, or accept smaller/different location home preventing overextension. Example outcome: Income $85,000 affords $200,000-218,000 home comfortably NOT $350,000 desired creating payment $3,200+ (45% income, financial disaster). Takes 20 minutes preventing catastrophic overborrowing through honest affordability calculation impossible when using lender’s maximum approval (often 43% DTI) versus conservative 28% rule maintaining financial health.

    2. If planning home purchase within 2 years, implement credit optimization strategy potentially saving $50,000-100,000 through rate improvement – Check current credit score: Free through Credit Karma, credit card issuer, or Experian. Identify current score range: Below 660 (needs significant improvement), 660-719 (moderate improvement), 720-759 (minor optimization), 760+ (optimal, maintain). Calculate rate impact: $300,000 loan example—660 score gets 7.75% ($2,151 monthly, $774,360 total paid) versus 760+ gets 6.75% ($1,946 monthly, $700,560 total), difference $73,800 over 30 years from 100-point score improvement. Implement optimization: (1) Pay down credit card balances to under 10% utilization (biggest impact, 30-60 points typical improvement in 30 days), (2) Set up automatic payments preventing any late payments next 12-24 months (protects 35% of score), (3) Keep all old accounts open preserving history length, (4) Avoid new credit applications 12 months before mortgage (prevents inquiry damage), (5) Dispute any credit report errors (AnnualCreditReport.com checking all three bureaus). Timeline: 12-24 months before purchase start optimization maximizing score improvement, 6 months before get pre-approved at optimized score. Example improvement: 680 score improves to 750 through utilization reduction (pay $8,000 to cards bringing 45% to 8% = 50-point boost) plus 12 months perfect payments (20-point boost) = 70-point total improvement creating rate savings $40,000-60,000 over loan life. Monitoring: Check score quarterly tracking improvement, adjust strategy if needed. Takes 30 minutes initial setup plus 12-24 months execution creating $40,000-100,000 savings through strategic credit optimization before mortgage application impossible when applying immediately with poor credit accepting permanently higher rate costing tens of thousands.

    3. Calculate total monthly homeownership cost for target property including all factors beyond mortgage creating realistic budget – Target property: Identify specific home or price range (example: $350,000 home). Calculate complete monthly cost: Principal + Interest ($300,000 loan at 7% 30 years = $1,995 monthly). Property taxes ($350,000 × 1.2% annually = $4,200 ÷ 12 = $350 monthly, verify actual rate in target area). Homeowners insurance ($1,500 annually = $125 monthly, get quote for actual property). PMI if applicable ($240 monthly on $300,000 loan with 10% down at 0.8% annually). HOA fees ($150 monthly if applicable, verify actual for property). Utilities estimate ($300 monthly for 2,000 sq ft home—electric, gas, water, trash). Maintenance reserve (1% home value annually = $350,000 × 1% = $3,500 ÷ 12 = $290 monthly for HVAC, roof, appliances, plumbing). Landscaping/yard ($50-100 monthly if applicable). Total monthly cost: $1,995 PI + $350 tax + $125 insurance + $240 PMI + $150 HOA + $300 utilities + $290 maintenance + $75 yard = $3,525 total monthly ownership cost. Compare to current rent: If renting $1,800 monthly, homeownership costs $1,725 more monthly ($3,525 vs $1,800), requiring budget adjustment or income increase sustaining difference. Compare to 28% income rule: $3,525 monthly requires $150,000+ gross income ($3,525 ÷ 0.28 × 12) to stay within guidelines, if earning less property unaffordable requiring lower price target. Hidden insight: Many buyers focus only on $1,995 mortgage payment ignoring $1,530 in additional monthly costs creating budget shock and financial strain when actual ownership costs 77% higher than quoted mortgage payment. Reality adjustment: If complete calculation reveals unaffordable, reduce target price, increase down payment lowering PMI, or continue renting while increasing income/savings. Takes 30 minutes creating comprehensive realistic budget preventing surprise from total costs exceeding expectations by 50-100% when only considering mortgage payment impossible without complete calculation including all ownership factors.

    These actions create mortgage mastery within 90 minutes—calculated true affordable home price preventing overextension ($50,000-150,000 potential savings from appropriate sizing), implemented credit optimization strategy potentially saving $40,000-100,000 through rate improvement, and determined complete monthly ownership costs creating realistic budget preventing shock from expenses exceeding mortgage by 50-100%—transforming mortgage decision from emotional home choice or feared impossibility into strategic wealth-building investment through informed affordability assessment, credit preparation, and comprehensive cost evaluation enabling homeownership creating substantial equity without financial destruction impossible without mortgage literacy.

    Credit Score Essentials Every College Student Must Know

    Learn how credit works, avoid costly mistakes, and build a strong financial future while you’re still in college.

    Think credit scores do not matter yet? They do. Your credit score can affect your ability to rent an apartment, qualify for loans, get lower interest rates, and build financial freedom after graduation.

    Most students are never taught how credit actually works. This course breaks it down in a clear, beginner-friendly way so you can make smart money decisions with confidence.

    What You’ll Learn

    • How credit scores are calculated
    • What factors help or hurt your score
    • How to start building credit responsibly
    • How to use credit cards without falling into debt
    • Common student mistakes and how to avoid them
    • Simple habits that can improve your score over time

    Why It Matters

    • Prepare for life after college
    • Build trust with lenders early
    • Increase your chances of approval
    • Save money through better rates
    • Reduce future financial stress
    • Make smarter money choices now

    Designed for college students: This course is simple, practical, and easy to follow. No finance background is needed. Just real-world lessons that help you build strong money habits early.

    A good credit score does not happen by accident. It starts with understanding how the system works and taking the right steps early.

    Quick FAQ

    How much house can I afford?
    Conservative rule: Total monthly housing payment (PITI—principal, interest, taxes, insurance plus HOA, maintenance) should not exceed 28% of gross monthly income ensuring comfortable affordability maintaining emergency reserves and other financial goals. Calculation: $80,000 annual income = $6,667 monthly gross × 28% = $1,867 maximum total housing payment. Working backward: $1,867 minus estimated $300 taxes, $120 insurance, $100 HOA, $250 maintenance = $1,097 available for principal and interest, supports $162,000 mortgage at 7% plus down payment = $180,000-202,000 affordable purchase range depending on down payment percentage. Lender qualification different: Banks approve up to 43% debt-to-income ratio including all debts, often qualifying buyers for $250,000-300,000 homes on $80,000 income creating dangerous overextension consuming half income leaving zero financial cushion. Key insight: Qualification maximum not affordability maximum—lenders maximize loan amounts for profit, borrowers must self-impose conservative limits maintaining financial health. Warning signs of overextension: Payment exceeding 30% gross income, zero emergency fund after purchase, cannot maintain retirement contributions, using entire approval amount, stretching budget for “dream home” beyond comfortable range. Safe approach: Use 25-28% rule, maintain 6-month emergency fund, continue 15% retirement contributions, stay well below approval maximum creating financial flexibility surviving income disruption, unexpected expenses, or rate increases if ARM.

    Is 15-year or 30-year mortgage better?
    Depends on prioritizing payment affordability versus interest minimization, but 15-year dramatically superior if affordable: 15-year advantages—Lower interest rate (typically 0.5% less than 30-year), massive interest savings ($200,000-300,000 on typical mortgage), faster equity building, debt-free 15 years sooner enabling retirement flexibility. 15-year disadvantages—Higher monthly payment (50-70% more), reduced cash flow flexibility, difficult qualification (higher payment versus income ratio), less funds available for other investments. 30-year advantages—Lower monthly payment maximizing affordability, greater cash flow flexibility, easier qualification, extra funds potentially invested elsewhere. 30-year disadvantages—Higher interest rate, 2-3x total interest paid, slower equity building, 30-year obligation. Example comparison $300,000: 30-year at 7% = $1,995 monthly, $418,200 total interest. 15-year at 6.5% = $2,613 monthly (31% higher payment), $170,340 interest, saves $247,860. Decision framework: Choose 15-year if payment comfortable within 28% income rule AND maintains emergency fund and retirement contributions—provides massive interest savings and forced accelerated payoff. Choose 30-year if 15-year payment exceeds 28% income OR prevents emergency fund/retirement OR creates financial strain—take longer affordable payment, consider extra principal payments when possible but maintain flexibility. Hybrid approach: Take 30-year for flexibility but pay as 15-year when income allows, dropping to required payment during lean periods maintaining safety net impossible with locked 15-year commitment.

    How much should I put down?
    Trade-off between minimizing monthly payment and PMI versus preserving cash reserves and investment opportunities: 20% down advantages—No PMI requirement (saves $100-300 monthly), better interest rates, instant 20% equity cushion, stronger offers to sellers, lower monthly payment. 20% down disadvantages—Delays purchase while saving, ties up $60,000-80,000 in home versus investments, leaves less emergency reserves if stretching to reach 20%. Lower down (3-10%) advantages—Faster homeownership timeline, preserves cash for emergencies and opportunities, leverages appreciation with less capital. Lower down disadvantages—PMI costs ($100-300 monthly until 20% equity), higher interest rates, higher monthly payment, underwater risk if values decline, weaker offers. Strategic decision framework: 20% down optimal IF (1) have funds without depleting emergency reserves, (2) not delaying purchase years chasing target, (3) PMI costs concern outweighs investment opportunity, (4) want payment minimization. Lower down acceptable IF (1) maintains $10,000+ emergency fund after purchase, (2) PMI temporary (plan to reach 20% equity through appreciation + payments in 3-5 years or refinance eliminating), (3) strong income growth expected, (4) first-time buyer assistance programs available reducing effective cost. Example analysis: $350,000 home, have $50,000 saved. Option A: 14% down ($50,000), mortgage $300,000 with PMI $230 monthly, emergency fund $0 after closing (DANGEROUS). Option B: 10% down ($35,000), mortgage $315,000 with PMI $240, emergency fund $15,000 after closing (SAFER). Option C: Wait 18 months saving to $70,000, 20% down, no PMI, but risk prices increasing requiring larger down payment and delaying wealth building 18 months. Best choice depends on risk tolerance, market trajectory, income stability—generally prefer maintaining emergency reserves over rushing to 20% if requires complete depletion creating vulnerability.

    Should I get a fixed-rate or adjustable-rate mortgage?
    Fixed-rate safer and preferable for most borrowers providing payment certainty, ARM appropriate only for specific short-term situations: Fixed-rate advantages—Payment stability entire loan term (principal + interest never changes), protection against rising rates, simplified budgeting, refinance flexibility anytime without rate risk. Fixed-rate disadvantages—Higher initial rate than ARM (typically 0.5-1% more), no benefit if rates decline (must refinance to capture), less flexibility for short-term ownership. ARM advantages—Lower initial rate (saving $100-300 monthly during fixed period), beneficial if selling before adjustment, enables larger purchase initially, rate decreases possible if market declines. ARM disadvantages—Payment uncertainty after fixed period (can increase substantially creating budget shock), inability to refinance if underwater or credit damaged, stress from rate monitoring, complicated terms. When ARM makes sense: (1) Confident selling within fixed period (military relocation, job transfer, starter home strategy), (2) Expect significant income growth covering potential increases, (3) Declining rate environment (benefit from adjustments down), (4) Lower initial payment critical for purchase qualification. When fixed preferable: (1) Long-term ownership planned (10+ years), (2) Budget stability priority over rate savings, (3) Cannot sustain payment increases (income fixed), (4) Rising or uncertain rate environment, (5) Sleep-at-night peace of mind valuable. Current environment recommendation (7% rates 2024): Fixed-rate strongly preferable—rates historically elevated likely declining future, ARM initial savings minimal (6.5% vs 7%), adjustment risk significant if rates rise further, refinancing to fixed later may be impossible if underwater or credit damaged. Exception: Short-term ownership (under 5 years certain) may justify ARM capturing lower initial rate if savings substantial and exit strategy clear before adjustment period.

    What credit score do I need for a mortgage?
    Minimum varies by loan type but higher scores dramatically reduce costs through better rates: Score requirements—FHA minimum 580 (500-579 requires 10% down instead of 3.5%), Conventional minimum 620 typically, VA no official minimum but 620 practical floor, USDA 640 minimum typically, Jumbo 700+ minimum. Rate impact massive: $300,000 loan 30 years—760+ score gets 6.5% ($1,896 monthly, $682,560 total), 680 score gets 7.25% ($2,047 monthly, $736,920 total), 620 score gets 8% ($2,201 monthly, $792,360 total). Cost of poor credit: 620 versus 760 score = $305 monthly higher payment, $109,800 more paid over life of loan from 140-point score difference. Strategic approach: If score below 720, delay purchase 12-24 months optimizing credit potentially saving $40,000-100,000 through rate improvement vastly exceeding any home appreciation during delay. Rapid improvement possible: Pay down credit cards to under 10% utilization (30-60 points in 30 days), 12 months perfect payments (20-40 points), keep old accounts open, dispute errors. Example optimization: 650 score improves to 740 through aggressive credit card payoff ($12,000 paid reducing 60% utilization to 8% = 50-point boost) plus 18 months perfect payment history (30-point boost) plus authorized user on parent’s 15-year-old account (10-point boost) = 90-point improvement creating $60,000-80,000 lifetime savings through rate improvement from 7.5% to 6.75%. Key insight: Every 20 points matters creating measurable rate improvements—680 to 700 saves $10,000-15,000, 700 to 720 saves $15,000-20,000, 720 to 760 saves $20,000-30,000 making credit optimization highest-ROI preparation activity before mortgage application.

    Explore More in Money Basics

    Disclosure

    This article provides general educational information about mortgage loans and homeownership. Individual loan terms, qualification requirements, interest rates, down payment options, and appropriate borrowing amounts vary significantly based on circumstances including credit, income, employment, property type, location, and lender policies. Mortgage rates, programs, and lending standards subject to frequent changes and lender discretion. This is not financial advice, mortgage lending advice, real estate advice, or guarantee of loan approval or specific terms. Real estate investment carries substantial risks including property value decline, market downturns, interest rate increases, job loss affecting payment ability, and potential foreclosure. Home appreciation not guaranteed—markets experience significant declines periodically. Total cost calculations and affordability guidelines represent general frameworks—individual budgets and circumstances vary requiring personalized analysis. Mortgage insurance requirements, costs, and removal terms vary by loan type and lender. Tax implications of homeownership depend on individual tax situations and current tax law subject to change. Closing cost estimates represent typical ranges—actual costs vary by location, lender, and transaction specifics. Buy-versus-rent analysis contains assumptions about appreciation, rent increases, investment returns, and tax treatment—actual results vary substantially from projections. Refinancing benefits depend on rate differential, closing costs, loan term remaining, and time to break-even. Credit score impacts on rates represent typical scenarios—individual pricing adjustments vary by complete credit profile and lender. Consult qualified mortgage professionals, real estate agents, attorneys, and tax advisors for personalized guidance matching individual situations and goals. Focus on conservative affordability assessment and maintaining emergency reserves rather than maximizing approval amounts creating financial vulnerability. Advertisements or sponsored content may appear within or alongside this content. All information presented independently for educational purposes only.
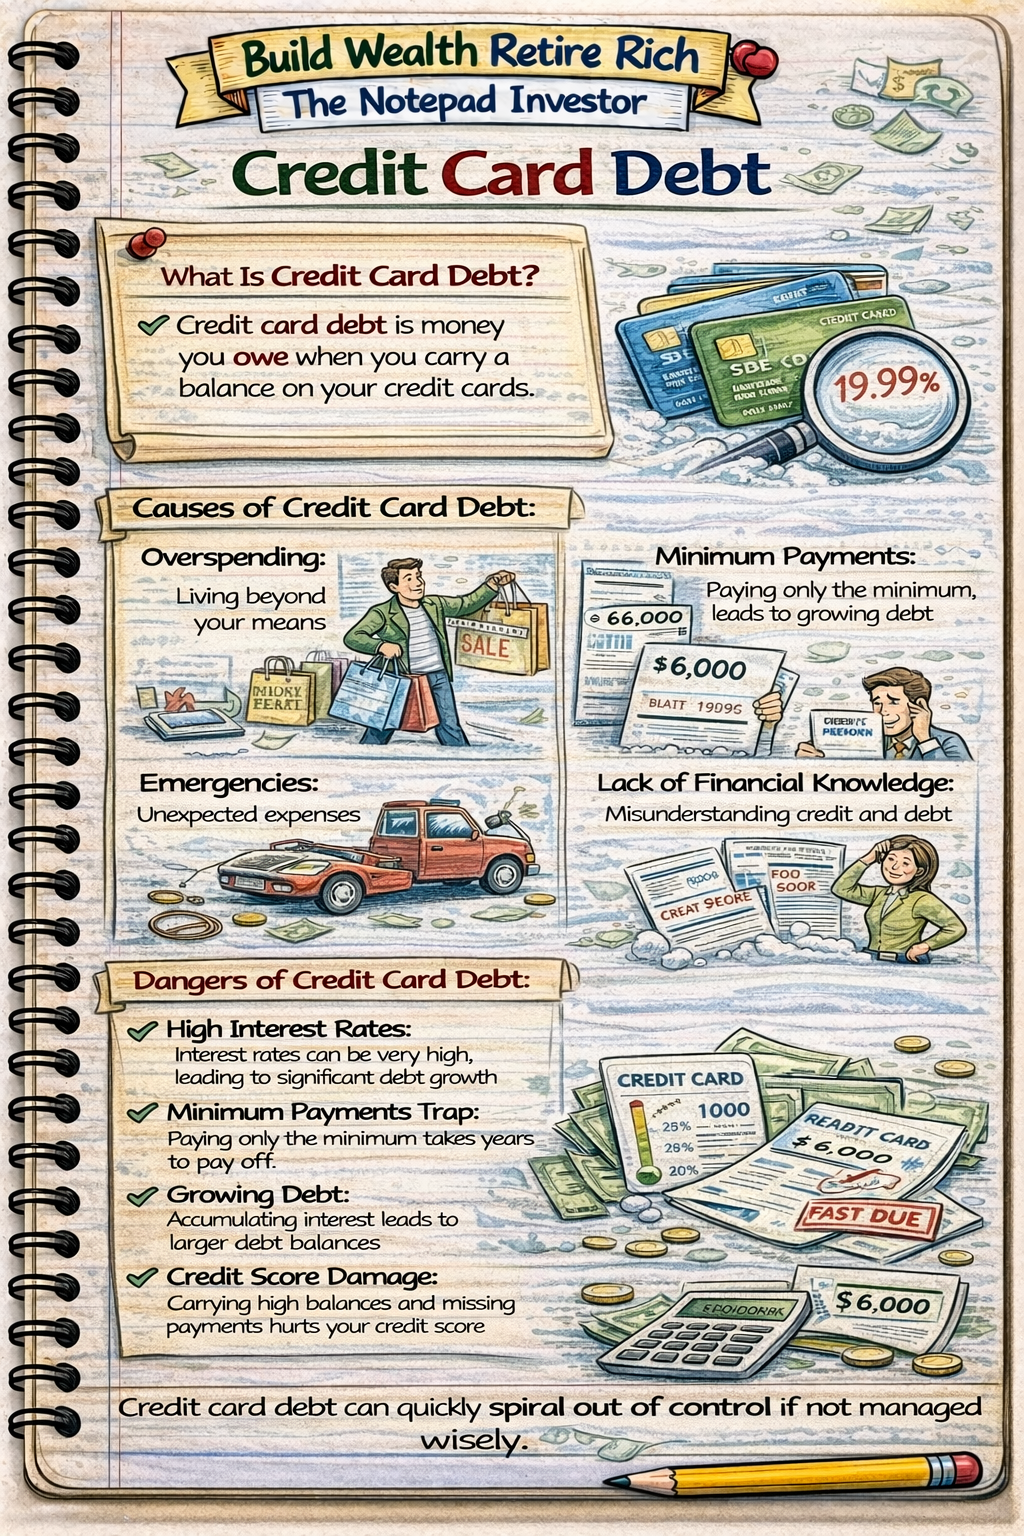
  • 5.3 Student Loans Explained: What Every Borrower Must Know

    5.3 Student Loans Explained: What Every Borrower Must Know

    Student loans are borrowed funds specifically designated for education expenses including tuition, fees, books, housing, and living costs during college or graduate school—creating obligation to repay principal plus interest after graduation or leaving school, with repayment terms, interest rates, and borrower protections varying significantly between federal loans offering fixed rates (4-7% typical), income-driven repayment options, and potential forgiveness programs versus private loans through banks requiring credit checks, offering variable rates (7-14% typical), and providing fewer protections making federal borrowing generally preferable despite lower borrowing limits. Representing $1.7+ trillion national debt burden affecting 43+ million Americans, student loans enable education access impossible for most through cash payment alone—bachelor’s degree costing $40,000-$100,000+ at public universities and $120,000-$200,000+ at private institutions requires borrowing for majority of students, with appropriate loan usage financing high-ROI degrees generating $500,000-$2,000,000 additional lifetime earnings justifying debt costs while excessive borrowing for low-earning majors creates financial burdens consuming 20-40% of post-graduation income for decades making strategic borrowing decisions, realistic earning potential evaluation, and loan type understanding essential for education financing aligned with career goals rather than emotional college choice creating impossible repayment situations destroying financial futures through student debt exceeding earning capacity.

    Notebook sketch explaining personal finance

    This article is designed for anyone considering student loans for self or dependents, current borrowers wanting repayment optimization, or those confused by federal versus private options and repayment strategies. You do not need financial expertise to understand student loans—fundamental concepts accessible through clear explanations of loan types, application processes, repayment options, and strategic considerations, though requires honest degree ROI evaluation distinguishing between passion pursuits and practical earning potential, realistic cost assessment comparing schools and financing options, and disciplined borrowing limiting debt to amounts sustainable on expected post-graduation income preventing common trap of following dreams to expensive institutions for low-earning degrees creating six-figure debt with five-figure salaries making repayment mathematically impossible without parent support or income-driven forgiveness relying on taxpayers subsidizing poor borrowing decisions.

    Understanding student loans matters because single education financing decision determines whether degree investment produces positive or negative lifetime financial return, federal versus private loan choice creates $20,000-50,000+ difference in total repayment costs through interest rates and repayment flexibility, and strategic borrowing enables career advancement through education while irresponsible borrowing destroys financial futures through impossible debt burdens—while student-loan-literate individuals maximize federal borrowing before private, limit debt to 1x first-year salary maintaining affordable payments, and choose degrees with clear employment paths yielding incomes justifying debt costs, creating dramatically different outcomes where strategic borrowers achieve 10-40x ROI through increased lifetime earnings versus irresponsible borrowers struggling with payments consuming 30%+ of income for decades preventing wealth accumulation, homeownership, and financial security through education debt exceeding benefits received.

    Educational disclaimer: This article provides general educational information about student loans. Individual loan terms, eligibility, interest rates, and appropriate borrowing amounts vary based on circumstances including credit, income, school choice, and degree pursued. Federal student loan programs and repayment options subject to legislative changes. This is not financial advice or recommendation of specific borrowing amounts or schools. Consult qualified financial aid advisors and education professionals for personalized guidance. Student loan debt carries serious long-term financial implications requiring careful consideration before borrowing.

    Federal vs Private Student Loans

    Federal Student Loans (Preferred Option)

    Key characteristics:

    • Funded by U.S. Department of Education
    • Fixed interest rates set by Congress annually
    • No credit check required (except PLUS loans)
    • Income-driven repayment plans available
    • Potential loan forgiveness programs
    • Deferment and forbearance options during hardship
    • Death and disability discharge provisions

    Federal loan types:

    Direct Subsidized Loans (undergraduates with financial need):

    • Government pays interest while in school (minimum half-time enrollment)
    • Annual limits: $3,500-$5,500 depending on year in school
    • Interest rate: 5.50% for 2024-2025 academic year (fixed)
    • Best federal option due to subsidized interest

    Direct Unsubsidized Loans (all students regardless of need):

    • Interest accrues from disbursement (even during school)
    • Annual limits: $5,500-$7,500 undergrad, $20,500 graduate
    • Interest rate: 5.50% undergrad, 7.05% graduate (2024-2025)
    • Most common federal loan type

    Direct PLUS Loans (parents and graduate students):

    • Parent PLUS: Parents borrow for dependent undergraduates
    • Grad PLUS: Graduate students borrow additional funds
    • Credit check required (adverse credit disqualifies)
    • Interest rate: 8.05% (2024-2025)
    • Origination fee: 4.228%
    • No aggregate limit (borrow up to cost of attendance)

    Annual federal borrowing limits (dependent undergraduates):

    • Freshman: $5,500 ($3,500 subsidized, $2,000 unsubsidized)
    • Sophomore: $6,500 ($4,500 subsidized, $2,000 unsubsidized)
    • Junior/Senior: $7,500 ($5,500 subsidized, $2,000 unsubsidized)
    • Aggregate limit: $31,000 total ($23,000 subsidized)

    Private Student Loans (Last Resort)

    Key characteristics:

    • Issued by banks, credit unions, online lenders
    • Variable or fixed interest rates based on creditworthiness
    • Credit check required (cosigner often needed for students)
    • No income-driven repayment or forgiveness options
    • Limited deferment/forbearance (lender discretion)
    • No death or disability discharge typically

    Private loan interest rates:

    • Excellent credit (750+): 4-7% variable, 5-8% fixed
    • Good credit (700-749): 7-10% variable, 8-11% fixed
    • Fair credit (650-699): 10-12% variable, 11-13% fixed
    • Poor credit: Often requires cosigner or denied
    • Rates adjust with market (variable) creating payment uncertainty

    Federal vs Private Comparison

    $30,000 borrowed over 4 years, 10-year repayment:

    Federal unsubsidized at 6.5% fixed:

    • Monthly payment: $341
    • Total paid: $40,920
    • Total interest: $10,920
    • Income-driven option if needed: Yes
    • Forgiveness eligible: Yes (Public Service after 120 payments)

    Private at 9% variable (starts, could increase):

    • Monthly payment: $380
    • Total paid: $45,600 (if rate stays 9%, increases if rates rise)
    • Total interest: $15,600
    • Income-driven option: No
    • Forgiveness eligible: No
    • Rate increase risk: Yes (could reach 12%+ = $430 monthly)

    Cost difference: $4,680 more expensive for private loan, plus flexibility loss

    Strategic Borrowing Priority

    Recommended borrowing sequence:

    • 1. Federal Direct Subsidized Loans (if eligible) – Best option, government pays interest during school
    • 2. Federal Direct Unsubsidized Loans – Fixed rates, repayment flexibility, forgiveness options
    • 3. Scholarships and grants (free money, prioritize aggressive searching)
    • 4. Work-study and part-time employment (earn while learning)
    • 5. Parent PLUS Loans (if parents willing and able, higher rates but federal protections)
    • 6. Private student loans – ONLY after exhausting all federal options
    Advertisement

    Financial Wellness Planner

    How Much to Borrow: The ROI Calculation

    The Critical Question: Debt vs Expected Income

    Golden rule of student loan borrowing:

    • Total student loan debt should not exceed first-year expected salary
    • Example: Expect $50,000 starting salary → Borrow maximum $50,000 total
    • Ensures manageable 10% of gross income payment on standard 10-year plan
    • Exceeding this ratio creates unsustainable burden requiring income-driven plans

    Calculation example:

    • Degree: Bachelor’s in Computer Science
    • Expected starting salary: $75,000 (research median for field)
    • Maximum recommended debt: $75,000
    • Payment on standard 10-year plan at 6%: $832 monthly
    • Payment as percentage of gross income: 13% ($832 ÷ $6,250 monthly gross)
    • Manageable within typical budget (under 15% threshold)

    Degree ROI by Field

    High-ROI degrees (debt-to-income under 1x easily achievable):

    Engineering:

    • Median starting salary: $70,000-$80,000
    • Recommended maximum debt: $70,000-$80,000
    • Lifetime earnings premium: $1.5-$2M vs high school diploma
    • ROI: 20:1+ (borrow $60,000, earn $1.2M extra over career)

    Nursing (BSN):

    • Median starting salary: $60,000-$70,000
    • Recommended maximum debt: $60,000
    • Lifetime earnings premium: $1M+
    • ROI: 15:1+ plus job security and advancement

    Computer Science:

    • Median starting salary: $75,000-$85,000
    • Recommended maximum debt: $75,000
    • Lifetime earnings premium: $1.5-$2.5M
    • ROI: 20-30:1

    Accounting/Finance:

    • Median starting salary: $55,000-$65,000
    • Recommended maximum debt: $55,000
    • Lifetime earnings premium: $900,000-$1.2M
    • ROI: 15-20:1

    Low-ROI degrees (difficult to maintain debt-to-income under 1x):

    Psychology (BA):

    • Median starting salary: $35,000-$40,000
    • Recommended maximum debt: $35,000 (difficult to achieve at many schools)
    • Lifetime earnings premium: Limited without graduate degree
    • Warning: $60,000 debt common but creates 60%+ debt-to-income ratio

    Liberal Arts/Humanities:

    • Median starting salary: $32,000-$38,000
    • Recommended maximum debt: $32,000
    • Reality: Private school costs create $80,000-$120,000 debt typical
    • Outcome: 2.5-3.5x debt-to-income ratio creating financial crisis

    Fine Arts:

    • Median starting salary: $30,000-$35,000
    • Recommended maximum debt: $30,000 maximum
    • Challenge: Often requires expensive schools creating $100,000+ debt
    • Outcome: 3-4x debt-to-income ratio, likely default or forbearance

    Real-World ROI Examples

    Positive ROI example:

    • Degree: Bachelor’s in Mechanical Engineering from state university
    • Total cost: $80,000 (tuition, fees, books over 4 years)
    • Scholarships/grants: $20,000
    • Family contribution: $15,000
    • Work earnings: $10,000
    • Student loans: $35,000 (stayed under starting salary expectation)
    • Starting salary: $72,000
    • Loan payment: $398 monthly (10-year plan at 5%)
    • Payment as % of income: 6.6% (very manageable)
    • Salary without degree: $35,000 (high school diploma manufacturing work)
    • Income differential: $37,000 annually
    • Lifetime benefit: $1.48M additional earnings over 40-year career
    • ROI: 42:1 ($1.48M benefit vs $35,000 debt)

    Negative ROI example:

    • Degree: Bachelor’s in Art History from private university
    • Total cost: $200,000 (expensive private school)
    • Scholarships/grants: $40,000
    • Family contribution: $30,000
    • Work earnings: $8,000
    • Student loans: $122,000 (3.5x starting salary expectation)
    • Starting salary: $35,000 (museum assistant, retail management)
    • Standard 10-year payment: $1,390 monthly (unaffordable = 47% of gross)
    • Actual plan: Income-driven repayment $200 monthly (balance growing through insufficient payment)
    • 25-year timeline: Balance grows to $180,000, forgiven with tax bomb, paid $60,000 over 25 years
    • Salary without degree: $32,000 (similar retail work possible without degree)
    • Income differential: $3,000 annually (minimal benefit)
    • Lifetime “benefit”: $120,000 additional earnings over 40 years
    • Cost: $60,000 paid + $50,000 forgiveness tax burden = $110,000
    • Net result: Paid $110,000 for $120,000 benefit = Minimal ROI, 25 years financial stress

    Repayment Plans and Options

    Standard Repayment Plan

    How it works:

    • Fixed monthly payment over 10 years
    • Automatic plan if no alternative selected
    • Minimizes total interest paid
    • Highest monthly payment but shortest timeline

    Example:

    • Debt: $40,000 at 6% APR
    • Monthly payment: $444
    • Total paid: $53,280
    • Total interest: $13,280

    Graduated Repayment Plan

    How it works:

    • Payments start lower, increase every 2 years
    • 10-year term total
    • Designed for borrowers expecting income growth
    • Higher total interest than standard plan

    Example (same $40,000):

    • Years 1-2: $250 monthly
    • Years 3-4: $350 monthly
    • Years 5-6: $450 monthly
    • Years 7-8: $600 monthly
    • Years 9-10: $750 monthly
    • Total paid: $57,000
    • Total interest: $17,000 (vs $13,280 standard)
    • Extra cost: $3,720 for payment flexibility

    Income-Driven Repayment Plans

    Four main types:

    1. SAVE Plan (Saving on a Valuable Education, newest):

    • Payment: 10% of discretionary income (income above 225% poverty line)
    • Forgiveness: 20 years undergraduate, 25 years graduate
    • Interest subsidy: Government covers unpaid interest preventing balance growth
    • Best income-driven option for most borrowers

    2. PAYE (Pay As You Earn):

    • Payment: 10% of discretionary income
    • Forgiveness: 20 years
    • Eligibility: New borrowers after Oct 1, 2007

    3. IBR (Income-Based Repayment):

    • Payment: 10-15% of discretionary income depending on loan date
    • Forgiveness: 20-25 years
    • Available to most federal borrowers

    4. ICR (Income-Contingent Repayment):

    • Payment: Lesser of 20% of discretionary income or fixed 12-year plan amount
    • Forgiveness: 25 years
    • Least favorable income-driven option

    Income-driven example:

    • Debt: $60,000 at 6%
    • Income: $40,000
    • Poverty line (single): $15,000 (approximate)
    • 225% poverty line: $33,750
    • Discretionary income: $40,000 – $33,750 = $6,250
    • SAVE payment: $6,250 × 10% ÷ 12 months = $52 monthly
    • Standard payment would be: $666 monthly (unaffordable)
    • Benefit: Manageable payment during low-earning years
    • Drawback: Balance grows from insufficient payment, 20-year timeline

    Public Service Loan Forgiveness (PSLF)

    Eligibility requirements:

    • Work full-time for qualifying employer (government, 501(c)(3) nonprofit)
    • Make 120 qualifying payments (10 years) under income-driven plan
    • Federal Direct Loans only (consolidate if needed)
    • Remaining balance forgiven tax-free after 120 payments

    PSLF strategic example:

    • Degree: Master’s in Social Work, $80,000 debt
    • Job: Nonprofit mental health center, $48,000 salary
    • Plan: SAVE income-driven, $200 monthly payment
    • 10 years: Paid $24,000 total ($200 × 120 months)
    • Balance after 10 years: $85,000 (grew through insufficient payments)
    • Forgiven: $85,000 tax-free through PSLF
    • Total cost: $24,000 for $80,000 education (effective 70% discount)
    • Alternative without PSLF: $90,000+ paid over 20-25 years
    • Savings: $66,000 through strategic PSLF qualification
    Advertisement
    Reserved space for in-content ad

    Strategic Student Loan Management

    While In School

    Minimize borrowing strategies:

    • Choose in-state public university (60-70% less expensive than private)
    • Live at home or off-campus (saves $10,000-$15,000 annually vs dorms)
    • Work part-time 10-20 hours weekly ($5,000-$10,000 annually)
    • Apply aggressively for scholarships (thousands available, most unclaimed)
    • Complete degree in 4 years maximum (extra year = $20,000-$30,000+ additional debt)
    • Take AP/CLEP credits reducing required courses
    • Start at community college transferring junior year (save $20,000-$40,000)

    Interest minimization for unsubsidized loans:

    • Pay interest while in school preventing capitalization
    • Example: $20,000 unsubsidized at 6% over 4 years
    • Interest accrual: $100 monthly
    • If unpaid: $4,800 interest capitalizes (adds to principal) = $24,800 balance at graduation
    • If paid monthly: $20,000 balance at graduation, saved $4,800 future interest
    • Even partial payments help: $50 monthly reduces capitalization by $2,400

    After Graduation

    Aggressive payoff strategy (when affordable):

    • Pay more than minimum attacking principal
    • Specify “apply to principal” not future payments when sending extra
    • Target highest interest rate loans first (avalanche method)
    • Refinance if excellent credit and stable income (lose federal protections, weigh carefully)

    Payoff acceleration example:

    • Debt: $35,000 at 6%
    • Standard payment: $389 monthly, 10 years, $11,680 interest
    • Aggressive $600 monthly: 6.5 years, $7,000 interest
    • Savings: $4,680 interest plus 3.5 years faster

    Income-driven strategy (when necessary):

    • Enroll in SAVE or PAYE during low-earning years
    • Recertify income annually (required for plan continuation)
    • Track PSLF qualifying payments if eligible
    • Understand forgiveness creates taxable income (except PSLF)

    Refinancing Considerations

    When refinancing makes sense:

    • Excellent credit score (740+)
    • Stable high income (debt-to-income under 20%)
    • Current federal rate over 7% and can refinance to under 5%
    • No intention to use income-driven plans or PSLF
    • Emergency fund established (6+ months expenses)

    Refinancing example:

    • Current: $50,000 federal at 7%, $581 monthly, 10 years remaining
    • Refinance: $50,000 private at 4.5%, $519 monthly, 10 years
    • Monthly savings: $62
    • Total savings: $7,440 over 10 years
    • Trade-off: Lose income-driven repayment, forbearance flexibility, forgiveness eligibility

    When refinancing risky:

    • Job instability or income uncertainty
    • Planning PSLF pursuit
    • May need income-driven plans future
    • Federal protections valuable (deferment, forbearance)
    • Interest savings minimal (under 1.5% reduction)

    Avoiding Default

    Default consequences:

    • Entire balance becomes immediately due
    • Wages garnished up to 15% without court order
    • Tax refunds seized
    • Social Security benefits garnished (if receiving)
    • Credit score destroyed (drops 100+ points)
    • Collection costs added to balance (up to 25%)
    • Federal employment ineligible
    • Professional licenses jeopardized in some states

    Prevention strategies if struggling:

    • Contact servicer IMMEDIATELY when payment difficulty arises
    • Switch to income-driven repayment (payment as low as $0 if very low income)
    • Request deferment or forbearance (temporary payment pause, interest accrues)
    • Consolidate defaulted loans into new Direct Consolidation Loan
    • Rehabilitation program (9 on-time payments restores good standing)

    Making the College Decision

    Cost vs Value Analysis

    Compare total 4-year costs:

    In-state public university:

    • Tuition: $10,000 annually
    • Room/board: $12,000 annually
    • Books/fees: $2,000 annually
    • Total annual: $24,000
    • 4-year total: $96,000

    Private university:

    • Tuition: $50,000 annually
    • Room/board: $15,000 annually
    • Books/fees: $2,000 annually
    • Total annual: $67,000
    • 4-year total: $268,000

    Cost difference: $172,000

    The critical question: Does private school create $172,000 additional lifetime value?

    Same degree earning potential:

    • Computer Science degree: $80,000 starting salary from either school
    • Employers care about degree, skills, experience—rarely care about specific school for most majors
    • ROI comparison: Public $96,000 investment = 1.2:1 cost-to-income. Private $268,000 = 3.4:1 cost-to-income
    • Verdict: Public university superior financial choice for same career outcome

    Different earning potential (rare exception):

    • Ivy League or elite school opening doors to investment banking ($150,000+ starting)
    • Top law school enabling BigLaw ($200,000+ starting)
    • Elite connections network creating opportunity premium
    • May justify higher cost IF pursuing these specific high-paying career paths

    Alternative Education Paths

    Community college → 4-year transfer:

    • 2 years community college: $6,000 tuition ($3,000 annually)
    • 2 years state university: $40,000 ($20,000 annually including room/board)
    • Total: $46,000 for bachelor’s degree
    • Same diploma as 4-year attendee
    • Savings: $50,000 versus 4 years at state school

    Trade schools and certificates:

    • Electrician, plumber, HVAC: $5,000-$15,000 training
    • Earning potential: $50,000-$80,000 with experience
    • No student debt burden
    • Start earning 18-24 months vs 4+ years

    Employer-sponsored education:

    • Major companies (Starbucks, Amazon, Walmart, UPS) offer tuition assistance
    • Work part-time while attending school debt-free
    • Takes longer but zero debt
    Advertisement
    Reserved space for in-content ad

    Why Understanding Student Loans Matters

    Without understanding student loans, individuals borrow blindly following emotional college choices creating six-figure debt for degrees yielding five-figure salaries making repayment impossible, choose private loans losing federal protections and paying $20,000-50,000 extra in interest, and miss strategic repayment options like PSLF potentially forgiving $50,000-100,000+ debt—while student-loan-literate individuals limit borrowing to 1x expected first-year salary ensuring manageable payments, maximize federal loans before private capturing lower rates and protections, and strategically pursue high-ROI degrees in engineering, nursing, computer science generating $1-2 million additional lifetime earnings justifying education costs, creating dramatically different outcomes where strategic borrowers achieve positive 10-40x ROI through education enabling career advancement versus irresponsible borrowers struggling with payments consuming 30-40% of income for decades preventing homeownership, retirement savings, and financial security through education debt exceeding benefits impossible to escape without default, forbearance, or 20-25 year forgiveness programs subsidizing poor borrowing decisions.

    Understanding student loans enables individuals to:

    • Calculate appropriate borrowing limits through debt-to-income ROI analysis
    • Distinguish between federal and private loans maximizing favorable terms
    • Evaluate degree earning potential determining sustainable debt levels
    • Navigate repayment options matching income and career paths strategically
    • Pursue PSLF when eligible potentially saving $50,000-100,000+
    • Make informed school choices weighing costs versus career outcomes
    • Avoid default consequences through proactive servicer communication and plan changes

    Student loan knowledge transforms education financing from emotional college dreams into strategic career investment evaluating costs, expected returns, and repayment sustainability enabling wealth-building through appropriate education debt versus financial destruction through excessive borrowing for low-earning degrees impossible without understanding loan types, repayment mechanics, and degree ROI analysis.

    Common Misunderstandings

    Many people assume all college degrees equally valuable justifying any borrowing amount. In reality, degree ROI varies dramatically—engineering generating $1.5-2M lifetime earnings premium versus psychology BA creating $200,000-300,000 differential, making $60,000 debt excellent investment for engineering (paid back in 3-4 years from income differential) versus potentially devastating burden for psychology requiring 15-20 years repayment on lower income, proving degree field fundamentally determines whether student debt strategic investment or destructive burden requiring honest earning potential evaluation not assumption that any bachelor’s degree justifies unlimited borrowing based on generic “college graduates earn more” statistics obscuring massive variation by major.

    Another common misconception is private student loans offer better rates than federal. In practice, federal rates (currently 5.50-8.05%) compare favorably to private loans requiring excellent credit (4-7% variable best-case, 8-13% typical), plus federal loans provide income-driven repayment, forbearance flexibility, potential PSLF forgiveness, and death/disability discharge worth $10,000-50,000+ in option value making federal loans superior even at slightly higher interest rates through protections impossible to replicate with private loans lacking safety nets creating default risk when income disrupted, proving federal borrowing should always be maximized before considering private loans despite marketing suggesting private loans competitive.

    Some believe student loan debt dischargeable through bankruptcy like credit cards. However, student loans nearly impossible to discharge requiring “undue hardship” standard met only in extreme circumstances (permanent disability, decades of unsuccessful repayment attempts, zero prospect of future income) with under 1% of bankruptcy filers achieving student loan discharge, proving student debt follows borrowers for life unlike dischargeable consumer debt making student loan decisions permanent requiring careful consideration before borrowing versus false security believing bankruptcy provides escape route from excessive education debt.

    How Student Loan Understanding Fits Into Financial Success

    Student loan understanding enables strategic education financing creating 10-40x ROI through increased lifetime earnings, prevents financial destruction through excessive borrowing for low-earning degrees, and maximizes federal loan benefits through appropriate repayment plan selection—making student debt literacy essential component of career development requiring realistic degree ROI evaluation, disciplined borrowing limits maintaining debt under 1x first-year salary, and strategic repayment approach matching income trajectory, transforming student loans from feared burden or reckless spending into calculated investment enabling career advancement when borrowed appropriately for high-earning degrees versus creating impossible repayment situations when excessive debt finances passion majors yielding insufficient income justifying costs impossible without understanding degree earning potential, loan type differences, and repayment mechanics enabling informed education financing decisions.

    For example, two high school seniors both age 18 considering college. Student A passionate about art history, emotionally attached to prestigious private university costing $60,000 annually ($240,000 total). Receives $10,000 annual scholarship, parents contribute $10,000 annually, borrows $40,000 annually in student loans (federal maxed, remainder private) totaling $160,000 debt upon graduation. Graduates age 22 with Bachelor’s in Art History, finds museum assistant position paying $34,000 annually. Student loan payment on standard 10-year plan: $1,845 monthly (unaffordable, 65% of gross income). Switches to income-driven repayment: $150 monthly but balance grows through insufficient payment. After 10 years age 32: Paid $18,000 total, balance grown to $195,000, still 15 years remaining on 25-year forgiveness timeline, career advanced to $42,000 (minimal growth), cannot afford home purchase (student debt prevents mortgage approval despite $30,000 saved), cannot save for retirement (payments plus living expenses consume income). After 25 years age 47: Paid $45,000 total ($150 × 300 months), $200,000 forgiven creating $70,000 tax liability (forgiveness treated as income), total education cost $115,000 for degree enabling $34,000-$48,000 career versus $30,000-$35,000 without degree, marginal lifetime benefit $200,000-$300,000 consumed by education costs and opportunity costs making net financial outcome negative. Student B researches degree earning potential, discovers engineering median starting salary $75,000, chooses in-state public university $25,000 annually total cost ($100,000 over 4 years). Receives $8,000 annual scholarship, parents contribute $10,000 annually, works part-time earning $5,000 annually, borrows $7,000 annually federal loans totaling $28,000 debt upon graduation (staying well under 1x starting salary guideline). Graduates age 22 with Bachelor’s in Mechanical Engineering, accepts position paying $74,000. Student loan payment standard 10-year: $318 monthly (comfortable, 5.2% of gross income). Aggressively pays $600 monthly eliminating debt by age 27 (5 years), total paid $32,600 ($28,000 + $4,600 interest). Age 32: Debt-free, salary advanced to $95,000, purchased home age 28 (excellent credit, manageable debt-to-income enabled mortgage), building equity $60,000, retirement accounts $85,000. Age 47: Home equity $250,000, retirement savings $780,000, total net worth $1.2M+ from strategic degree choice enabling high income. Difference: Student A’s poor student loan understanding through excessive borrowing for low-earning degree created $115,000 education cost for minimal career benefit requiring 25 years repayment preventing wealth building, Student B’s student debt literacy through limited borrowing for high-ROI degree created $32,600 education investment yielding $1.2M+ net worth by age 47 ($1.5M additional lifetime earnings from engineering vs art history path) demonstrating $1.3M+ wealth difference from understanding degree ROI, appropriate borrowing limits, and loan type optimization enabling career advancement through strategic education debt versus financial destruction through passion-based borrowing exceeding earning potential.

    Student loan understanding separates strategic education investors achieving dramatic ROI through high-earning degrees from financially-burdened passion pursuers struggling with debt exceeding career earning potential, requiring honest degree evaluation, disciplined borrowing limits, and federal loan maximization creating measurable wealth differences impossible without student debt literacy.

    Recent Updates and Trends

    In recent years, SAVE plan introduced (2023) replacing REPAYE offering improved terms including interest subsidy preventing balance growth and income-driven payments based on 225% poverty line versus 150% creating lower payments for most borrowers, though plans subject to legal challenges and political changes requiring monitoring of program availability and terms before relying on long-term forgiveness expectations.

    Student loan forgiveness debates have intensified with proposed broad cancellation programs facing legal challenges, though actual forgiveness remains limited to existing programs (PSLF, income-driven forgiveness after 20-25 years, disability discharge) making responsible borrowing essential rather than assuming future cancellation will eliminate debt through political action creating false security encouraging irresponsible borrowing.

    Income-driven repayment enrollment has surged with 40%+ of federal borrowers now using IDR plans versus 10-year standard repayment, indicating borrowers struggling with debt burdens exceeding original affordability expectations though creating concerns about program costs and sustainability as balances grow through insufficient payments requiring eventual forgiveness subsidized by taxpayers.

    College costs have continued rising faster than inflation with average tuition increasing 3-5% annually outpacing wage growth, making strategic school choice and borrowing discipline increasingly critical as even public universities approach $30,000-35,000 annual total costs creating $120,000-140,000 debt exposure for students borrowing full amounts without family contribution or scholarships.

    Fundamental student loan principles remain timeless: borrow only for high-ROI degrees justifying debt through increased earnings, limit total debt to 1x first-year expected salary ensuring manageable payments, maximize federal loans before private capturing protections and repayment flexibility, and pursue PSLF when eligible potentially saving $50,000-100,000+—regardless of forgiveness debates, plan changes, cost increases, or enrollment trends, understanding degree earning potential, appropriate borrowing limits, and strategic loan type selection produces superior outcomes through informed education financing enabling career advancement without financial destruction impossible without student debt literacy evaluating ROI before borrowing.

    3 Things You Can Do Today

    Ready to optimize student loan strategy? Here are three simple steps you can take right now:

    1. Research median starting salaries for degree being pursued calculating maximum recommended borrowing using 1x income rule – Specific degree consideration: Note exact major (Computer Science, Nursing, Psychology, Business, etc.). Research median starting salary: Visit Bureau of Labor Statistics (BLS.gov), PayScale.com, or university career services, find median NOT average (median more representative eliminating outliers). Example research: Bachelor’s in Accounting median starting salary $58,000, Bachelor’s in English median $38,000, Bachelor’s in Engineering median $75,000. Calculate maximum recommended debt: 1x first-year salary rule ensuring payments stay under 10-13% gross income on standard 10-year plan. Example calculations: Accounting degree → Maximum $58,000 total debt (payment $660 monthly = 11% of $58,000 income, manageable). English degree → Maximum $38,000 total debt (payment $432 monthly = 11% of $38,000 income, manageable but lower borrowing limit). Engineering degree → Maximum $75,000 total debt (payment $853 monthly = 11% of $75,000 income, manageable). Compare to actual borrowing needed: Calculate 4-year total cost (tuition, room/board, fees), subtract scholarships/grants, subtract family contribution, subtract expected work earnings = needed student loans. Example: Engineering at state school $100,000 total cost, $15,000 scholarships, $20,000 family, $10,000 work = $55,000 needed loans (under $75,000 maximum, APPROVED). Art History at private school $240,000 cost, $40,000 scholarships, $30,000 family, $8,000 work = $162,000 needed loans for degree with $35,000 median salary (4.6x income ratio, DANGER – unaffordable, requires school change or major change). Takes 30 minutes research creating concrete borrowing limit preventing excessive debt impossible to repay on realistic post-graduation income.

    2. If currently borrowing or planning to borrow, commit to maximizing federal loans before any private loans creating $20,000-50,000 savings through protections – Current or upcoming borrowing: List all needed educational funding. Federal loan priority sequence: (1) Complete FAFSA application annually (required for all federal aid), (2) Accept all Direct Subsidized Loans offered (government pays interest during school, best option), (3) Accept necessary Direct Unsubsidized Loans (interest accrues but federal protections valuable), (4) Consider federal Parent PLUS if parents willing (8% rate but federal safety nets), (5) Private loans ONLY after exhausting federal options. Annual federal limits review: Dependent undergrad maxes at $7,500 annually junior/senior year, $31,000 aggregate—if need exceeds, evaluate if school choice affordable or requires lower-cost alternative. Example federal maximization: Year 1 need $15,000, federal offers $5,500 → Accept $5,500 federal, reduce need to $9,500 through work/family before considering private. Year 2 need $18,000, federal offers $6,500 → Accept $6,500 federal, reduce need to $11,500. Year 3-4 need $20,000 each, federal offers $7,500 each → Accept $7,500 federal annually, total $27,000 federal over 4 years, remaining $23,000 need ($11,500 + $12,500 + $12,500) filled through work/family/small private if absolutely necessary. Benefits of federal maximization: $27,000 at fixed 6% with income-driven options versus private at 9-12% variable without protections, saves $8,000-15,000 in interest plus option value of federal repayment flexibility worth $10,000-30,000 if income disrupted. Critical commitment: Never accept private loans until federal completely exhausted, contact financial aid office requesting maximum federal eligibility before shopping private lenders. Takes 1 hour annually (FAFSA completion plus federal loan acceptance) creating $20,000-50,000 value through optimal loan type selection.

    3. If currently in repayment, evaluate current plan versus alternatives calculating potential interest savings or payment relief through plan optimization – Current repayment status: Note total balance, interest rate(s), current monthly payment, current plan type (standard, graduated, income-driven). Calculate current path: Use studentaid.gov loan simulator entering balance and rate, shows total paid on current plan, years to payoff, total interest. Example current situation: $45,000 balance at 6%, standard 10-year plan, $500 monthly, total paid $60,000, interest $15,000. Evaluate alternatives: Aggressive payoff—If income allows, what if pay $750 monthly? Payoff in 6.7 years, total paid $55,800, saves $4,200 interest. Income-driven—If payment straining budget, what if switch to SAVE plan? $150 monthly based on $40,000 income, balance grows initially but manageable during low-earning years, switch back to standard when income increases. PSLF pursuit—If employed by government or nonprofit, enroll in income-driven plan certifying employment annually, track toward 120 qualifying payments potentially forgiving $30,000-60,000 remaining balance. Refinancing evaluation—If excellent credit (740+), stable high income, current rate over 7%, can refinance to under 5% saving thousands BUT lose federal protections (only refinance if certain won’t need income-driven plans or forbearance). Example refinance: $45,000 at 7% refinance to 4.5% = Save $3,600 over remaining term but lose safety nets. Action decision tree: Comfortable payment + stable income = Aggressive payoff OR refinance if rate gap 2%+. Struggling with payment = Immediate switch to income-driven plan preventing default. Public service career = Enroll in PSLF-qualifying plan immediately, certify employment annually. Contact servicer: Call or log in online, can change repayment plans anytime, takes 10-20 minutes application, effective next month. Takes 20 minutes evaluation creating $3,000-60,000 potential savings through plan optimization or payment relief preventing default impossible when continuing unsuitable repayment plan without exploring alternatives.

    These actions create student loan mastery within 90 minutes—researched degree earning potential establishing appropriate borrowing limit preventing excessive debt ($50,000-100,000 potential savings avoiding unaffordable major/school combinations), committed to federal loan maximization creating $20,000-50,000 value through optimal loan type selection, and evaluated repayment plan optimization potentially saving $3,000-60,000 or preventing default—transforming student loans from feared burden or reckless tool into strategic education financing enabling career advancement through informed borrowing decisions aligned with earning potential impossible without understanding degree ROI, loan type differences, and repayment mechanics.

    Quick FAQ

    How much student loan debt is too much?
    Rule of thumb: Total student debt should not exceed first-year expected salary in chosen career field ensuring manageable 10-13% of gross income payment on standard 10-year repayment plan. Example appropriate: $55,000 debt for nursing degree with $60,000 starting salary (0.92:1 ratio), payment $626 monthly = 12.5% of $60,000 income (manageable within typical budget). Example excessive: $80,000 debt for psychology degree with $38,000 starting salary (2.1:1 ratio), payment $910 monthly = 29% of $38,000 income (unsustainable, requires income-driven plans with balance growth). Calculation: Research median starting salary for specific degree (not generic “college graduate” statistics obscuring major differences), use as maximum borrowing limit, compare to needed loans after scholarships/family/work, if exceeds limit choose different school or reconsider major. Warning signs of too much debt: Ratio exceeds 1.5x starting salary, standard payment would exceed 15% gross income, considering low-earning major at expensive school, total debt approaching $100,000 for bachelor’s degree. Reality: Under $30,000 total debt generally manageable regardless of major, $30,000-60,000 manageable for moderate-to-high earning degrees, $60,000-80,000 requires high-earning degree justification, over $80,000 bachelor’s debt red flag requiring exceptional degree ROI or school reconsideration.

    Should I use federal or private student loans?
    ALWAYS maximize federal loans before considering private due to superior protections worth $10,000-50,000+ in option value: Federal advantages—Fixed interest rates (5.50-8.05% current), income-driven repayment plans reducing payments to $0-10% of discretionary income during low-earning years, PSLF eligibility potentially forgiving $50,000-100,000+ for public service careers, deferment/forbearance during hardship, death and disability discharge protecting family from debt, no credit check required (except PLUS loans). Private disadvantages—Variable rates (can increase dramatically, 7-14% typical), credit check required often needing cosigner for students, no income-driven plans (payment fixed regardless of income hardship), no forgiveness programs, limited deferment/forbearance at lender discretion, cosigner remains liable if borrower dies. Cost comparison: $30,000 federal at 6% = $333 monthly 10 years, income-driven safety net if needed. $30,000 private at 9% variable = $380 monthly minimum, no safety net if income drops. Strategy: Accept all offered federal loans first, exhaust $31,000 dependent undergrad limit and $57,500 independent limit before considering private, evaluate if additional private borrowing signals unaffordable school requiring less expensive alternative. Exception: Refinancing existing federal loans to private AFTER graduation if excellent credit, stable high income, certain won’t need federal protections—but this converts federal to private permanently losing safety nets. Never bypass federal loans for private during school regardless of seemingly lower private rates advertised—federal protections worth more than interest rate differential.

    What is Public Service Loan Forgiveness and how do I qualify?
    PSLF forgives remaining federal Direct Loan balance tax-free after 120 qualifying monthly payments (10 years) while working full-time for qualifying employer: Qualifying employers—Federal, state, local, tribal government (any position), 501(c)(3) nonprofit organizations, other nonprofits providing public services (healthcare, education, public safety, law, early childhood education, public interest law, public service for individuals with disabilities/elderly, library, school-based services). NON-qualifying: For-profit companies (even if public-facing), labor unions, partisan political organizations, most 501(c)(4) organizations. Qualifying payments—Must be under income-driven repayment plan (SAVE, PAYE, IBR, ICR) or 10-year standard plan, full payment amount for that plan, made within 15 days of due date, while employed full-time at qualifying employer. Process: Enroll in income-driven plan, submit Employment Certification Form annually confirming employer qualifies and payments count toward 120, after 120 payments submit PSLF application for forgiveness. Strategic example: $75,000 law school debt, nonprofit legal aid attorney $52,000 salary, SAVE plan $300 monthly, after 10 years paid $36,000, balance grown to $85,000, forgiven tax-free saving $49,000. Requirements: Federal Direct Loans only (consolidate FFEL or Perkins loans if needed), must remain in qualifying employment full-time entire 10 years, must recertify income annually for income-driven plan, must submit employment certification to track progress. Common mistakes: Wrong loan type (FFEL or Perkins don’t qualify without consolidation), wrong repayment plan (extended, graduated don’t qualify), wrong employer (thinking any nonprofit qualifies when only certain types do), not certifying employment annually (cannot retroactively verify). Takes initial 20 minutes enrollment plus 10 minutes annually certification creating potential $40,000-120,000 forgiveness for public service careers making PSLF highly valuable for qualifying borrowers.

    Can I discharge student loans in bankruptcy?
    Extremely difficult, requiring “undue hardship” standard met in under 1% of bankruptcy cases making student loans effectively non-dischargeable unlike credit cards or medical debt: Undue hardship test (varies by jurisdiction but generally requires all three)—(1) Cannot maintain minimal standard of living for self and dependents if forced to repay loans, (2) Additional circumstances indicating hardship will persist for significant portion of repayment period, (3) Made good faith efforts to repay loans before seeking discharge. Examples rarely meeting standard: Temporary unemployment (not permanent hardship), moderate income insufficient to pay loans comfortably (courts expect sacrifice), choosing low-paying career after expensive education (self-imposed hardship). Examples sometimes meeting standard: Permanent total disability preventing any employment, severe chronic illness preventing work with no prospect of improvement, elderly borrower with no income or assets and no prospect of future income. Reality: Courts view education as conferring lasting benefit justifying repayment regardless of hardship, bankruptcy judges extremely reluctant to discharge absent catastrophic permanent circumstances. Successful discharge rate: Under 1% of bankruptcy filers even attempt adversary proceeding required for student loan discharge, under 20% of those attempting succeed, total discharge rate under 0.1% of borrowers. Better alternatives than bankruptcy: Income-driven repayment plans reducing payments to $0 if income very low, PSLF forgiveness for public service, disability discharge for total and permanent disability, negotiating settlement if in default (sometimes accept 40-60% of balance). Key insight: Student loans follow borrowers for life making borrowing decisions permanent unlike dischargeable consumer debt—requires careful degree and amount evaluation before borrowing rather than assuming bankruptcy provides escape route from excessive education debt.

    Should I pay off student loans early or invest the money?
    Depends on interest rate versus investment return expectations plus consideration of federal loan protections: GENERALLY pay student loans early when—Interest rate exceeds 7% (guaranteed savings likely beats market risk-adjusted returns), private loans without income-driven safety nets (eliminate risk), approaching major purchase requiring clean debt-to-income (mortgage application), loans create significant stress regardless of math (psychological value). GENERALLY invest instead when—Interest rate under 5% (market returns likely exceed guaranteed savings), federal loans with income-driven/PSLF options (protections valuable), decades until retirement (time for compounding), comfortable debt-to-income for goals (loans not blocking homeownership), emergency fund established (investing beyond safety net). Example comparison: $30,000 student loans at 4.5% versus invest at 8% expected. Pay loans: Save $5,400 interest over 10 years (guaranteed). Invest: Grow to $65,000 in 10 years at 8% = $35,000 net gain versus loan payoff. Math favors investing by $30,000. Alternative: $30,000 loans at 8% versus invest. Pay loans: Save $9,600 interest (guaranteed high return). Invest: Might grow to $65,000 but paying 8% interest meanwhile negating returns. Math favors debt payoff. Federal loan special consideration: If pursuing PSLF, minimum payments optimal maximizing forgiveness (paying extra reduces eventual forgiveness). If using income-driven plan, extra payments reduce total cost but forfeiting forgiveness option. Balance approach: Split extra cash 50/50 between debt payoff and investing if interest rate 5-7% range providing guaranteed returns plus market exposure. Rule of thumb: Aggressively pay loans over 7%, invest if loans under 5%, case-by-case 5-7% range based on circumstances. Always maintain 3-6 month emergency fund before aggressive payoff or investing—liquidity prevents forced borrowing in crisis.

    Explore More in Money Basics

    Disclosure

    This article provides general educational information about student loans and education financing. Individual loan terms, eligibility requirements, interest rates, repayment options, and appropriate borrowing amounts vary significantly based on circumstances including credit, income, school choice, degree pursued, and lender. Federal student loan programs, interest rates, borrowing limits, and repayment plans subject to legislative changes and administrative modifications. This is not financial advice, recommendation of specific borrowing amounts, guarantee of loan approval, or endorsement of particular schools or degree programs. Salary expectations and ROI projections represent median data and hypothetical scenarios—actual earnings vary substantially based on individual performance, job market conditions, location, and economic factors. PSLF and income-driven forgiveness programs have specific eligibility requirements and are subject to program changes, legal challenges, and potential elimination. Loan forgiveness may create taxable income (except PSLF). Refinancing federal loans to private permanently eliminates federal protections and repayment flexibility. Default consequences serious including wage garnishment, tax refund seizure, credit damage, and collection costs. Bankruptcy discharge of student loans extremely rare requiring undue hardship standard rarely met. Consult qualified financial aid advisors, student loan counselors, and education professionals for personalized guidance matching individual circumstances and goals. Focus on realistic degree earning potential evaluation and disciplined borrowing limits rather than assuming any college degree justifies unlimited debt or future forgiveness will eliminate obligations. Advertisements or sponsored content may appear within or alongside this content. All information presented independently for educational purposes only.

  • 5.2 Good Debt vs Bad Debt: What You Should Keep and What to Avoid

    5.2 Good Debt vs Bad Debt: What You Should Keep and What to Avoid

    Good debt finances appreciating assets or income-generating investments where borrowed funds create value exceeding interest costs through equity building, earning capacity increases, or revenue generation—typically characterized by lower interest rates (under 8%), secured collateral enabling favorable terms, and tangible wealth-building outcomes measurable over time such as home equity accumulation, degree-enabled salary increases, or business profit growth. Bad debt funds consumption, depreciating purchases, or routine expenses through high-interest borrowing (over 15%) creating obligations without corresponding value—characterized by financing vacations, dining, entertainment, or lifestyle spending through credit cards, payday loans, or predatory personal loans where interest costs often exceed original purchase values while assets consumed or depreciated create zero lasting benefit making total costs pure wealth destruction through compound interest and opportunity costs. The fundamental distinction separates strategic leverage enabling major purchases impossible through cash-only approaches while building long-term wealth from irresponsible consumption borrowing creating perpetual payment obligations preventing wealth accumulation—though context matters enormously as same debt type can be good or bad depending on interest rates, repayment terms, asset characteristics, and whether borrowed funds enable wealth creation or merely facilitate overspending beyond sustainable income levels.

    Notebook sketch explaining personal finance

    This article is designed for anyone evaluating borrowing decisions, individuals wanting framework distinguishing strategic from destructive debt, or those confused by conflicting advice about debt usage. You do not need financial expertise to understand good versus bad debt—core principles accessible through clear examples and decision frameworks, though requires honest self-assessment distinguishing between genuine needs and wants, essential investments and discretionary consumption, and realistic repayment capacity versus optimistic assumptions about future income enabling informed borrowing aligned with long-term wealth building rather than short-term gratification creating long-term financial burden through high-interest obligations exceeding benefits received.

    Understanding good versus bad debt matters because single borrowing decision can either enable wealth accumulation through strategic leverage or create financial destruction through high-interest consumption, lifetime borrowing costs often totaling $200,000-500,000 making debt literacy essential for wealth optimization, and appropriate debt usage separates middle-class stagnation from millionaire wealth building when leverage applied strategically—while good-debt-literate individuals build home equity through mortgages, increase earning capacity through education loans, and maintain excellent credit enabling optimal rates, bad-debt users accumulate credit card balances for lifestyle maintenance, pay thousands in unnecessary interest for consumed purchases, and perpetuate cycles preventing wealth building through payment obligations consuming discretionary income that could otherwise compound through investments creating dramatically different lifetime financial outcomes from identical starting points.

    Educational disclaimer: This article provides general educational information about debt evaluation frameworks. Individual borrowing situations, appropriate debt types, and optimal strategies vary significantly based on circumstances including income, assets, goals, and risk tolerance. “Good debt” terminology represents strategic borrowing concept not guarantee of positive outcomes—all debt carries risks. This is not financial advice or recommendation of specific borrowing actions. Consult qualified financial professionals for personalized guidance matching individual situations.

    Defining Good Debt vs Bad Debt

    Good Debt Characteristics

    Core criteria for good debt:

    • Finances appreciating assets: Purchases increasing in value over time (real estate typically)
    • Generates income or increases earning capacity: Education, business investments, rental properties
    • Lower interest rates: Typically under 8% APR (secured debt, prime rates)
    • Value created exceeds interest costs: Benefits outweigh borrowing expenses measurably
    • Strategic necessity: Enables essential purchases impractical through cash-only approach
    • Comfortable repayment: Payments sustainable within budget without financial strain

    Common good debt examples:

    • Mortgages for primary residence (building equity, avoiding rent)
    • Student loans for high-ROI degrees (engineering, medicine, law increasing lifetime earnings)
    • Business loans generating revenue exceeding borrowing costs
    • Real estate investment loans for rental properties creating cash flow
    • Strategic auto loans enabling employment (low rates, necessary transportation)

    Bad Debt Characteristics

    Core criteria for bad debt:

    • Finances consumption: Purchases consumed without lasting value (dining, entertainment, vacations)
    • Depreciating assets at high rates: Rapidly losing value items financed expensively
    • High interest rates: Typically over 15% APR (credit cards, payday loans, predatory lending)
    • Cost exceeds benefits: Interest and fees outweigh value received from purchase
    • Routine expense coverage: Indicates budget mismatch not strategic leverage
    • Strained repayment: Payments create financial stress or require sacrifice of essentials

    Common bad debt examples:

    • Credit card balances for lifestyle spending (vacations, dining, shopping)
    • Payday loans for routine expenses (groceries, utilities indicating budget gap)
    • High-interest auto loans for luxury vehicles (12%+ on depreciating assets)
    • Personal loans for consumption (weddings, home theater systems, non-essentials)
    • Store financing for furniture, electronics, appliances at 20%+ APR

    The Gray Area: Context-Dependent Debt

    Debt that can be good OR bad depending on circumstances:

    Auto loans:

    • Good: $18,000 reliable vehicle at 5% enabling $45,000 job (essential transportation)
    • Bad: $60,000 luxury SUV at 12% for status when $20,000 sedan adequate (lifestyle inflation)

    Home equity borrowing:

    • Good: HELOC at 7% funding kitchen renovation adding $30,000 home value for $20,000 cost
    • Bad: HELOC at 8% funding $40,000 vacation risking home foreclosure for consumed experience

    Credit cards:

    • Good: Emergency $1,200 car repair on 0% promotional card, paid off within 6 months enabling job continuation
    • Bad: $5,000 shopping and dining over 6 months at 22% APR paid over 3+ years costing $6,500+ total

    Student loans:

    • Good: $30,000 for engineering degree increasing income from $35,000 to $75,000 (paid back in 3 years from differential)
    • Bad: $80,000 for art history degree leading to $32,000 retail job (payments consume 25% of income for 20+ years)
    Advertisement

    Financial Wellness Planner

    Good Debt Examples in Detail

    Mortgages (Prime Example of Good Debt)

    Why mortgages are typically good debt:

    • Homes appreciate historically 3-5% annually on average
    • Builds equity through principal payments and appreciation
    • Alternative is rent (builds landlord’s equity not yours)
    • Tax benefits (mortgage interest deduction for some taxpayers)
    • Fixed housing costs (vs rent increases)
    • Low interest rates (6-8% typical for prime borrowers)

    Comprehensive mortgage example:

    • Purchase: $300,000 home, $60,000 down (20%), $240,000 mortgage
    • Terms: 30 years, 6.5% APR
    • Monthly payment: $1,517 (principal + interest)
    • Total paid over 30 years: $546,120
    • Total interest: $306,120 ($546,120 – $240,000)
    • Home value after 30 years: $729,000 (3.5% annual appreciation)
    • Equity accumulated: $729,000 (all principal paid, appreciation)
    • Net wealth created: $729,000 home minus $60,000 down minus $306,120 interest = $362,880 net gain

    Rent alternative comparison:

    • Rent comparable home: $2,000 monthly
    • Total rent over 30 years: $720,000 ($2,000 × 360 months)
    • Equity built: $0 (rent builds landlord’s wealth)
    • Net wealth: -$720,000 (pure expense)

    Total difference: $1,082,880 wealth swing (mortgage equity $362,880 vs rent -$720,000)

    When mortgages become questionable:

    • Payment exceeds 28-30% of gross income (strained affordability)
    • Minimal down payment creating high loan-to-value ratio
    • Adjustable rates in rising rate environment
    • Home purchase in declining market or unsustainable price bubble
    • Short holding period (under 5 years, transaction costs exceed benefits)

    Education Loans for High-ROI Degrees

    Why education loans can be good debt:

    • Degree increases lifetime earning capacity
    • Income differential exceeds debt repayment costs
    • Career opportunities unavailable without degree
    • Lower interest rates (federal 4-7%, private 7-12%)
    • Income-driven repayment options for federal loans

    High-ROI education example:

    • Degree: Bachelor’s in Nursing, $40,000 total student loans
    • Without degree income: $30,000 annually (retail, service work)
    • With degree income: $75,000 annually (registered nurse)
    • Income differential: $45,000 annually
    • Loan payment: $430 monthly (10-year standard repayment at 5%)
    • Annual debt service: $5,160
    • Net benefit year 1: $45,000 – $5,160 = $39,840 additional income after loan payment
    • Payback period: Debt paid in full year 10
    • Lifetime benefit (40-year career): $1.8 million additional earnings ($45,000 × 40 years)
    • ROI: 45:1 return ($1.8M benefit vs $40K debt)

    When student loans become bad debt:

    • Low-earning degree (median income under $40,000)
    • Excessive debt (over 1x expected first-year salary)
    • For-profit institutions with poor outcomes
    • Degree completion unlikely (borrowing without finishing)
    • Private loans at high rates (over 10%) when federal available

    Low-ROI education example (bad debt):

    • Degree: Bachelor’s in Liberal Arts, $80,000 total student loans
    • Income: $38,000 annually (similar to no degree alternatives)
    • Loan payment: $920 monthly (10-year repayment)
    • Annual debt service: $11,040
    • Debt service as percentage of gross income: 29% (unsustainable burden)
    • Income-driven repayment: $200 monthly but extends to 20-25 years
    • Total paid over 20 years: $48,000+ (debt growing through interest)
    • Net benefit: Minimal income increase versus debt burden

    Business Loans for Revenue Generation

    Why business loans can be good debt:

    • Investment in revenue-generating assets or capabilities
    • Returns exceed borrowing costs
    • Enables business growth impossible from cash flow alone
    • Deductible interest expense reduces effective cost

    Productive business loan example:

    • Loan: $50,000 at 8% for equipment purchase
    • Equipment enables new product line
    • Additional revenue: $40,000 annually
    • Additional expenses: $15,000 annually (materials, labor)
    • Additional profit: $25,000 annually
    • Loan payment: $607 monthly ($7,284 annually)
    • Net benefit year 1: $25,000 profit – $7,284 debt service = $17,716
    • Payback: Loan paid in 7 years, equipment continues generating profit years 8+
    • 10-year total: $250,000 revenue – $150,000 expenses – $50,000 equipment = $50,000 net gain from $50,000 investment

    Investment Property Loans

    Why rental property loans can be good debt:

    • Tenants pay mortgage through rent
    • Property appreciates building equity
    • Tax benefits (depreciation, expense deductions)
    • Positive cash flow when managed properly
    • Leverage multiplies returns (control $300,000 asset with $60,000 down)

    Investment property example:

    • Purchase: $250,000 rental property, $50,000 down, $200,000 mortgage at 7%
    • Monthly mortgage: $1,331
    • Rental income: $2,000 monthly
    • Expenses: $500 monthly (taxes, insurance, maintenance reserve, management)
    • Cash flow: $2,000 – $1,331 – $500 = $169 monthly positive
    • Annual cash flow: $2,028
    • Principal paydown: $3,500 annually (year 1)
    • Appreciation: $8,750 annually (3.5%)
    • Total annual return: $14,278 on $50,000 investment = 28.5% return
    • After 10 years: Equity $100,000+, cash flow $24,000+, property worth $350,000+

    Bad Debt Examples in Detail

    Credit Card Debt for Consumption

    Why credit card consumption debt is bad:

    • High interest rates (18-25% typical)
    • Finances items consumed without lasting value
    • Minimum payments create perpetual debt
    • Total costs often double purchase prices
    • Opportunity cost prevents wealth building

    Lifestyle credit card debt example:

    • Accumulated purchases: $8,000 over 1 year (dining $2,500, shopping $3,000, entertainment $1,500, vacation $1,000)
    • APR: 20%
    • Minimum payment: $200 monthly (2.5% of balance)
    • Payoff timeline: 6 years 3 months
    • Total interest: $7,200
    • Total paid: $15,200 for $8,000 consumed purchases
    • Items remaining: Zero (vacation consumed, clothing worn out, meals digested)
    • Net result: -$15,200 for temporary enjoyment, $7,200 pure interest waste

    Alternative scenario (saved instead of borrowed):

    • Delayed gratification: Save $200 monthly for 40 months
    • Total saved: $8,000
    • Purchase same items cash: $8,000 cost
    • Interest paid: $0
    • Time cost: 40 months vs immediate but paid for 75 months on credit
    • Savings: $7,200 avoided interest

    Payday Loans for Routine Expenses

    Why payday loans represent bad debt:

    • Extremely high APRs (300-400% typical)
    • Covers routine expenses indicating budget failure
    • Short terms create reborrow cycle
    • Fees accumulate rapidly
    • Perpetuates financial crisis instead of solving

    Payday loan cycle example:

    • Initial need: $500 for groceries and utilities
    • Payday loan: $500 borrowed, $75 fee (15% for 2 weeks = 391% APR)
    • Due amount: $575 in 2 weeks
    • Next paycheck: Cannot afford $575, renews with another $75 fee
    • Cycle repeats: Every 2 weeks pays $75 fee, still owes $500 principal
    • After 6 months (13 renewals): Paid $975 in fees, still owes $500
    • Total to escape: $1,475 paid for $500 borrowed
    • Effective cost: 195% of borrowed amount

    High-Interest Auto Loans for Luxury

    Why luxury auto debt often bad:

    • Rapid depreciation (30-40% in 3 years typical)
    • High interest rates for subprime borrowers (12-20%)
    • Long terms (72-84 months) underwater quickly
    • Lifestyle inflation not wealth building
    • Alternative adequate vehicles available cheaper

    Luxury auto loan example:

    • Vehicle: $50,000 luxury SUV
    • Loan: $45,000 (10% down), 72 months, 14% APR
    • Monthly payment: $891
    • Total paid: $64,152
    • Total interest: $19,152
    • Vehicle value after 6 years: $15,000 (70% depreciation)
    • Net result: Paid $64,152 ($5,000 down + $59,152 payments) for asset worth $15,000, lost $49,152

    Reasonable alternative:

    • Vehicle: $22,000 reliable sedan
    • Loan: $20,000 (10% down), 60 months, 6% APR
    • Monthly payment: $387
    • Total paid: $25,220
    • Total interest: $3,220
    • Vehicle value after 5 years: $10,000
    • Monthly savings: $504 ($891 – $387)
    • Invest savings $504 monthly for 6 years at 8%: $47,800
    • Net difference: $47,800 investment + $10,000 car = $57,800 versus $15,000 car on luxury path = $42,800 better position

    Personal Loans for Consumption

    Wedding financed with personal loan example:

    • Wedding cost: $30,000
    • Personal loan: $30,000 at 12% APR, 60 months
    • Monthly payment: $668
    • Total paid: $40,080
    • Total interest: $10,080
    • Asset remaining: $0 (event consumed)
    • Marriage outcome: 50% end in divorce (potential $40,080 paid for failed union)
    • Net result: $40,080 for single day, zero tangible assets

    Alternative:

    • Modest $10,000 wedding paid cash from savings
    • Invest $668 monthly for 5 years at 7%: $47,500
    • Down payment fund: $47,500 available for home purchase year 6
    • Net difference: $47,500 home down payment vs $0 remaining from lavish wedding
    Advertisement
    Reserved space for in-content ad

    Decision Framework: Evaluating Borrowing Opportunities

    The 7-Question Test

    Question 1: What am I buying?

    • Good indicators: Home, education, business asset, essential reliable transportation
    • Bad indicators: Vacation, dining, entertainment, luxury items, routine expenses
    • Decision impact: Asset type fundamentally determines good vs bad classification

    Question 2: Will this appreciate, depreciate, or be consumed?

    • Appreciate: Real estate (typically), certain business assets → Supports good debt
    • Depreciate slowly: Vehicles (if necessary), durable goods → Neutral to questionable
    • Depreciate rapidly: Electronics, furniture, vehicles (luxury) → Bad debt territory
    • Consumed: Experiences, food, entertainment → Always bad debt

    Question 3: What’s the interest rate?

    • Under 5%: Excellent, likely strategic borrowing opportunity
    • 5-8%: Reasonable for mortgages, good for other secured debt
    • 8-15%: Questionable unless essential, evaluate carefully
    • 15-25%: Bad debt territory, avoid unless true emergency
    • Over 25%: Predatory, almost never justifiable

    Question 4: Will this generate income or increase my earning capacity?

    • Yes: Strong good debt indicator (education, business investment, rental property)
    • Indirectly: Consider carefully (reliable car enabling higher-paying job)
    • No: Must meet other criteria to justify (primary residence builds equity)

    Question 5: Can I comfortably afford the payments?

    • Test: Payment under 10% of gross income for single debt, all debt under 36% total
    • Comfortable: Payment sustainable without sacrificing essentials or savings
    • Stretching: Requires sacrifice of other goals, red flag
    • Unaffordable: Disrupts basic needs, absolutely avoid

    Question 6: What happens if I save and wait instead?

    • Significant consequences: Job loss, health deterioration, income opportunity missed → May justify borrowing
    • Mere inconvenience: Temporary discomfort, delayed gratification → Save instead
    • Nothing critical: Want not need → Definitely save instead

    Question 7: Will this create value exceeding the total cost including interest?

    • Calculate: Total payments (principal + all interest) vs expected value created
    • Positive ROI: Home equity, income increase, business profit exceeding debt costs → Good debt
    • Negative ROI: Total paid exceeds any measurable benefit → Bad debt

    Applying the Framework

    Example 1: $300,000 mortgage evaluation

    • Q1 – What buying? Primary residence
    • Q2 – Appreciate/depreciate? Appreciates 3-4% annually typical
    • Q3 – Interest rate? 6.5% (reasonable)
    • Q4 – Generate income? No, but builds equity and avoids rent
    • Q5 – Affordable? Payment 25% of gross income (within 28% guideline)
    • Q6 – If wait? Continue paying rent building landlord’s equity
    • Q7 – Value exceeds cost? Equity $400,000+ in 30 years vs $306,000 interest = net positive
    • Verdict: GOOD DEBT (meets multiple criteria, strategic wealth building)

    Example 2: $5,000 vacation on credit card evaluation

    • Q1 – What buying? Vacation experience (consumption)
    • Q2 – Appreciate/depreciate? Consumed, zero residual value
    • Q3 – Interest rate? 20% (high)
    • Q4 – Generate income? No
    • Q5 – Affordable? Requires 3+ years minimum payments (stretching)
    • Q6 – If wait? Save 10 months, take same vacation debt-free
    • Q7 – Value exceeds cost? Pay $6,500+ for $5,000 vacation, memories only lasting value
    • Verdict: BAD DEBT (fails most criteria, pure consumption at high cost)

    Example 3: $40,000 engineering degree evaluation

    • Q1 – What buying? Bachelor’s degree in high-demand field
    • Q2 – Appreciate/depreciate? Increases earning capacity permanently
    • Q3 – Interest rate? 5% federal loans (low)
    • Q4 – Generate income? Yes, $35,000 → $75,000 salary increase
    • Q5 – Affordable? $430 monthly on $75,000 income = 6.8% (comfortable)
    • Q6 – If wait? Delay career start, lose years of higher earning
    • Q7 – Value exceeds cost? $1.6M lifetime additional earnings vs $40K debt = 40:1 ROI
    • Verdict: GOOD DEBT (strong income generation, positive ROI, affordable)

    The Interest Rate Threshold

    Rate Guidelines for Good vs Bad Classification

    Excellent rates (Under 5%):

    • Often worth considering even for borderline purchases
    • Interest cost low enough that inflation partially offsets
    • May be worth maintaining debt while investing elsewhere
    • Examples: Some mortgages, top-tier auto loans, federal student loans

    Good rates (5-8%):

    • Acceptable for productive debt (homes, education, business)
    • Reasonable cost for strategic leverage
    • Aggressive payoff optional, maintaining debt acceptable if invest wisely
    • Examples: Most mortgages, good credit auto loans, credit union personal loans

    Questionable rates (8-15%):

    • Only justifiable for essential needs or clear income generation
    • Aggressive payoff recommended
    • Avoid for discretionary purchases
    • Examples: Average credit cards (if paid off monthly acceptable), some auto loans, business lines of credit

    Bad rates (15-25%):

    • Almost never justifiable except true emergencies
    • Immediate aggressive payoff essential
    • Indicates lack of better options (credit issues)
    • Examples: High-rate credit cards, subprime auto loans, some personal loans

    Predatory rates (Over 25%):

    • Never justifiable under normal circumstances
    • Creates debt traps impossible to escape
    • Seek alternatives at any cost
    • Examples: Payday loans, title loans, rent-to-own arrangements

    Rate Impact on Good vs Bad Classification

    Same purchase, different rates:

    $25,000 auto loan scenario:

    • At 4% (60 months): Payment $460, total paid $27,600, interest $2,600 (10% of principal) = Acceptable for necessary vehicle
    • At 12% (60 months): Payment $557, total paid $33,420, interest $8,420 (34% of principal) = Questionable, strong candidate for aggressive payoff
    • At 20% (60 months): Payment $662, total paid $39,720, interest $14,720 (59% of principal) = Bad debt even for necessary vehicle, seek alternatives

    Key insight: High rates transform otherwise reasonable purchases into bad debt through excessive interest costs

    Advertisement
    Reserved space for in-content ad

    Why Understanding Good vs Bad Debt Matters

    Without distinguishing good from bad debt, individuals treat all borrowing identically missing strategic leverage opportunities enabling wealth building through homeownership and education, accumulate high-interest consumption debt destroying wealth through compound interest on depreciating purchases, and make emotionally-driven borrowing decisions lacking framework evaluating long-term costs versus benefits—while good-debt-literate individuals build substantial home equity through strategic mortgages, invest in income-increasing education yielding 10-40x returns, and avoid lifestyle debt freeing cash flow for wealth-building investments, creating dramatically different lifetime financial outcomes where strategic debt users achieve millionaire status through appropriate leverage while bad-debt accumulators remain paycheck-to-paycheck despite identical incomes through interest payments consuming discretionary income preventing wealth accumulation impossible without understanding fundamental good versus bad debt distinctions.

    Understanding good versus bad debt enables individuals to:

    • Make strategic borrowing decisions aligned with long-term wealth building
    • Calculate total costs including interest revealing true expense of purchases
    • Recognize when debt enables wealth creation versus merely facilitating consumption
    • Evaluate interest rates determining acceptable versus destructive borrowing costs
    • Apply decision frameworks distinguishing needs from wants and essentials from luxuries
    • Build substantial wealth through appropriate leverage (home equity, income generation)
    • Avoid wealth destruction through consumption borrowing creating obligations without value

    Good-versus-bad-debt knowledge transforms borrowing from feared taboo or unexamined habit into strategic wealth-building tool when applied appropriately to appreciating assets and income generation while avoided for consumption and depreciating purchases creating measured outcomes impossible without framework distinguishing strategic from destructive debt usage.

    Common Misunderstandings

    Many people assume all debt inherently bad requiring complete avoidance. In reality, strategic “good debt” enables major wealth-building purchases impossible through cash-only approaches—homeownership builds $200,000-500,000 equity over 30 years impossible for most through saving alone, education loans generate 10-40x returns through increased lifetime earnings, and business loans create revenue streams exceeding borrowing costs, proving appropriate leverage accelerates wealth building making complete debt avoidance counterproductive despite common debt-aversion advice treating all borrowing identically without distinguishing strategic from destructive usage.

    Another common misconception is low interest rates automatically make debt “good.” However, 0% financing for furniture, electronics, or vehicles doesn’t transform consumption into productive investment—borrowed money still finances rapidly depreciating or consumed purchases creating obligations without corresponding wealth building regardless of rate, proving interest rate only one factor among many with asset type and purpose equally important determining good versus bad classification making context examination essential beyond simply evaluating APR percentages.

    Some believe student loans always represent “good debt” investment in future. In practice, education ROI varies dramatically—$30,000 engineering debt enabling $40,000 income increase produces positive ROI within years while $80,000 liberal arts debt leading to $35,000 retail job creates burden consuming 25%+ of income for decades, proving degree field, debt amount relative to expected earnings, and completion likelihood all critical factors determining whether education loans strategic investment or destructive burden making blanket “student loans are good debt” advice oversimplified without ROI analysis and realistic earning potential evaluation.

    How Good vs Bad Debt Understanding Fits Into Financial Success

    Good versus bad debt understanding separates strategic wealth builders leveraging appropriate borrowing from wealth destroyers accumulating consumption debt, enables $200,000-500,000+ home equity accumulation impossible for most through saving alone, and creates framework preventing lifestyle debt consuming discretionary income that could otherwise compound through investments—making debt classification literacy essential component of financial success requiring strategic borrowing for appreciating assets and income generation while avoiding consumption borrowing for depreciating purchases and lifestyle maintenance, transforming debt from universal enemy into selective tool enabling major wealth-building purchases when applied appropriately versus creating financial destruction through high-interest obligations without corresponding value creation impossible without distinguishing strategic productive debt from destructive consumption borrowing.

    For example, two 25-year-olds both earning $50,000 with similar spending patterns. Person A treats all debt as bad, avoids borrowing entirely using only cash and debit. Saves diligently accumulating $20,000 by age 28. Wants to buy home but denied mortgage—no credit history despite cash reserves and stable job. Continues renting $1,500 monthly. Age 35: Still renting despite $50,000 saved (insufficient for purchase plus denied financing), spent $126,000 on rent over 10 years building landlord’s wealth not own. Drives $5,000 cash-purchased vehicles needing constant repairs, $2,500 annually in maintenance. Zero credit card rewards despite $30,000 annual spending. Age 45: Paid $306,000 in rent over 20 years, owns aging vehicle, $80,000 saved but never qualified for mortgage due to credit invisibility, no home equity wealth. Person B understands good versus bad debt distinction, uses strategic borrowing while avoiding consumption debt. Age 25: Opens credit card using for routine spending paying full balance monthly building credit (zero interest, earns 2% cash back = $600 annually). Age 28: Excellent 760+ credit score, $20,000 saved, approved for $250,000 mortgage 6.5% with $20,000 down. Monthly payment $1,452 (similar to rent). Finances reliable $22,000 vehicle at 5% ($415 monthly) versus buying unreliable cash car. Age 35: Home worth $325,000 with $70,000 equity ($35,000 principal paid + $35,000 appreciation), total paid $122,472 in mortgage payments but owns appreciating asset, reliable vehicles through strategic financing saving repair costs. Age 45: Home worth $450,000 with $180,000 equity ($100,000 principal + $80,000 appreciation), total paid $313,344 in mortgage but owns $450,000 asset (net $136,656 wealth from $20,000 initial), earned $12,000 credit card rewards ($600 × 20 years), reliable transportation enabling career advancement to $75,000 income. Difference from Person A: Person B’s good debt literacy created $396,656 wealth difference ($136,656 home equity profit + $126,000 avoided rent payments + $12,000 rewards + $80,000 savings + $42,000 less in vehicle maintenance) versus Person A’s $80,000 saved minus continued rent expense creating dramatically different net worth from understanding strategic debt usage for appreciating assets while avoiding consumption borrowing—both started identical positions and spending levels, Person B achieved homeownership and substantial wealth through appropriate leverage while Person A remained financially stagnant through blanket debt avoidance preventing access to wealth-building opportunities requiring credit.

    Good-versus-bad-debt understanding separates millionaire wealth builders leveraging appreciating assets from paycheck-to-paycheck strugglers accumulating consumption debt or missing strategic opportunities through blanket debt avoidance, requiring framework distinguishing productive from destructive borrowing enabling informed decisions maximizing wealth while minimizing financial destruction.

    Recent Updates and Trends

    In recent years, student loan debt has exceeded $1.7 trillion nationally creating policy debates around forgiveness and income-driven repayment, though fundamental education ROI principles unchanged requiring degree earning potential evaluation versus debt incurred making some student loans excellent investments while others create unsustainable burdens depending on field of study and total borrowing relative to expected income.

    Housing affordability challenges have intensified in many markets with median home prices reaching 5-7x median household incomes versus historical 3-4x, though home equity building through mortgage paydown and appreciation still produces superior wealth outcomes versus renting long-term despite higher entry barriers requiring larger down payments and higher income thresholds for qualification.

    Buy-now-pay-later services have proliferated offering 0% short-term financing as consumption debt enabler, though free interest doesn’t transform discretionary spending into productive investment—fundamentally remains consumption borrowing risking overspending beyond capacity despite convenient payment splitting and zero interest marketing obscuring cash flow impacts.

    Interest rates have fluctuated with Federal Reserve policy affecting good-versus-bad thresholds marginally—what constituted “good rate” at 3% mortgages differs from 7% environment, though fundamental principles persist that lower rates better and borrowing for appreciating assets superior to consumption regardless of specific rate environment requiring context-adjusted evaluation.

    Fundamental good-versus-bad-debt principles remain timeless: productive debt finances appreciating assets or income generation creating value exceeding interest costs, destructive debt funds consumption or depreciating purchases through high-interest borrowing creating obligations without corresponding wealth, interest rates critically impact classification transforming reasonable into destructive through excessive costs, and strategic debt usage enables major purchases and wealth building impossible through cash-only approaches—regardless of policy debates, housing affordability challenges, fintech innovation, or rate environment fluctuations, understanding asset type, purpose, interest cost, and value creation versus destruction produces superior borrowing decisions through framework distinguishing strategic wealth-building leverage from destructive consumption borrowing impossible without good-versus-bad classification literacy.

    3 Things You Can Do Today

    Ready to optimize debt strategy? Here are three simple steps you can take right now:

    1. Categorize every current debt as good or bad using the 7-question framework creating strategic action plan – List all current debts: Credit cards (balances, APRs, what purchased), auto loans (terms, what purchased), student loans (degree, income impact), mortgage, personal loans. Apply framework to each: (1) What bought? (2) Appreciates, depreciates, or consumed? (3) Interest rate? (4) Generates income or increases earning? (5) Affordable payments? (6) Consequences if had saved instead? (7) Value exceeds total cost? Categorize results: GOOD DEBT list (mortgages on primary residence building equity, student loans for degrees increasing income, business loans generating revenue exceeding costs, low-rate auto loans for necessary transportation). BAD DEBT list (credit card balances for consumption at 18%+, payday loans, high-rate personal loans for discretionary spending, luxury auto loans over 12%). GRAY AREA list (context-dependent requiring evaluation). Create action priorities: GOOD DEBT—maintain scheduled payments, consider investing extra funds if rates under 5%, protect through on-time payments. BAD DEBT—aggressive elimination, debt avalanche method attacking highest APR first, temporary spending freeze redirecting all discretionary to payoff, consider balance transfers to 0% promotional rates. Example categorization outcomes: Mortgage $180,000 at 6% = GOOD (scheduled payments continue). Credit cards $6,000 at 22% = BAD (attack aggressively $400 monthly eliminating in 17 months saving $1,800 interest versus minimums). Auto $12,000 at 14% = BORDERLINE BAD (accelerate to $350 monthly versus $280 minimum). Takes 30 minutes creating strategic debt management approach distinguishing wealth-building from wealth-destroying obligations enabling appropriate action impossible when treating all debt identically.

    2. Before any new borrowing, complete the 7-question evaluation determining good versus bad classification and alternatives – Upcoming borrowing consideration: Note specific purchase, amount, proposed terms (APR, payment, total cost including interest). Apply comprehensive framework: Question 1—What am I buying specifically? (Home, education, vehicle, vacation, furniture, etc.). Question 2—Will this appreciate, depreciate slowly, depreciate rapidly, or be consumed? (Research typical outcomes). Question 3—What’s the interest rate and how does it compare to benchmarks? (Under 5% excellent, 5-8% good, 8-15% questionable, 15-25% bad, over 25% predatory). Question 4—Will this generate income or measurably increase my earning capacity? (Quantify expected impact). Question 5—Can I comfortably afford payments without sacrificing essentials or other financial goals? (Calculate as percentage of gross income, all debt ideally under 36%). Question 6—What happens if I save and wait 6-18 months instead? (Job loss/health crisis/major consequence OR mere inconvenience/delayed gratification?). Question 7—Will total value created exceed total cost including all interest? (Calculate ROI: home equity gain, income increase, business profit versus total payments). Score results: 5-7 yes answers with appreciation/income generation = GOOD DEBT potentially justified. 2-4 yes answers or high rate = QUESTIONABLE requiring careful consideration. 0-1 yes answers with consumption/high rate = BAD DEBT avoid if possible. Example evaluation: $30,000 education loan for nursing degree at 5% enabling $35,000 to $70,000 income increase = Scores 6/7 yes (not consumption, appreciates through income, 5% reasonable, generates $35K additional income, $322 monthly affordable on $70K, delay costs years of higher earning, lifetime benefit $1.4M exceeds $36K total cost) = GOOD DEBT green light. $4,000 vacation on credit card at 20% paid over 3 years = Scores 0/7 yes (consumption, consumed, 20% high, no income, stretches budget, delay merely inconvenient, $5,200 total paid for $4,000 consumed) = BAD DEBT avoid. Takes 15 minutes preventing thousands in bad debt while enabling appropriate good debt impossible when borrowing reactively without systematic evaluation.

    3. Calculate wealth difference between strategic good debt usage and all-debt avoidance or bad-debt accumulation revealing lifetime impact – Create three 30-year scenarios comparing outcomes: SCENARIO A (Strategic Good Debt)—Age 25 establish credit through card paid in full monthly ($600 annual rewards), age 28 purchase $250,000 home $50,000 down 6.5% mortgage ($1,485 monthly), home worth $650,000 age 58 (3.5% appreciation), equity $500,000+ (principal paid plus appreciation), rewards $18,000 over 30 years. Total wealth age 58: $500,000 home equity + $18,000 rewards + investments from career advancement = $650,000+ net worth. SCENARIO B (All-Debt Avoidance)—Age 25 avoid all borrowing including credit cards, save cash only, age 28 have $50,000 saved but denied mortgage (no credit), continue renting $1,800 monthly, age 58 paid $648,000 in rent over 30 years, no home equity, no rewards, savings $150,000 through disciplined saving. Total wealth age 58: $150,000 saved, zero home equity, zero rewards = $150,000 net worth. SCENARIO C (Bad Debt Accumulation)—Age 25 credit card debt for lifestyle $8,000 at 20% maintained through minimums, age 28 subprime mortgage attempt denied (credit damage), continues renting plus credit card debt, age 40 still $12,000 credit card debt cycling, paid $50,000+ in interest over 30 years, age 58 paid $648,000 rent plus $50,000 interest, minimal savings $40,000. Total wealth age 58: $40,000 saved, zero equity = $40,000 net worth. Wealth difference: Scenario A $650,000 versus Scenario B $150,000 = $500,000 wealth difference from strategic good debt versus avoidance despite equal earning and base spending. Scenario A $650,000 versus Scenario C $40,000 = $610,000 wealth difference from strategic good debt versus bad debt accumulation. Key insight: Strategic good debt creates $500,000-600,000+ additional wealth versus either blanket avoidance or bad debt patterns from understanding leverage appropriately applied to appreciating assets while avoiding consumption borrowing. Takes 20 minutes calculating lifetime impact creating visceral understanding of good-versus-bad distinction impossible through abstract concepts alone requiring quantified comparison revealing massive outcome differences from informed debt decisions.

    These actions create good-versus-bad-debt mastery within 90 minutes—categorized current debts enabling strategic management approach ($2,000+ typical savings from appropriate prioritization), established systematic evaluation framework preventing future bad debt thousands in avoided interest, and calculated wealth impact revealing $500,000+ lifetime difference motivating strategic debt decisions—transforming debt from undifferentiated obligation or universal enemy into understood tool enabling wealth building through appropriate leverage while avoiding wealth destruction through consumption borrowing impossible without classification framework distinguishing strategic from destructive debt usage.

    Advertisement
    Reserved space for in-content ad

    Quick FAQ

    Is a mortgage always good debt?
    Usually but not automatically—mortgages generally good debt when: (1) Home purchased as primary residence building equity versus rent alternative, (2) Price affordable with payment under 28-30% gross income, (3) Reasonable down payment (10-20%+) creating equity buffer, (4) Market stable or appreciating (not bubble), (5) Planning 5+ year occupancy allowing appreciation and transaction cost recovery. Mortgages become questionable or bad when: Payment exceeds 30% income creating financial strain, minimal down payment (under 5%) creating underwater risk, speculation on flipping short-term (transaction costs exceed benefits), declining market purchasing near peak, adjustable rates in rising rate environment creating payment shock risk. Example good mortgage: $250,000 home, $50,000 down, 6.5% fixed, payment $1,264 = 20% of $75,000 income, stable market, 10+ year planned occupancy = Builds $200,000+ equity over 30 years versus $540,000 rent paid. Example questionable mortgage: $400,000 home, $8,000 down (2%), 7% adjustable, payment $2,620 = 42% of $75,000 income, hot market near peak, 3-year flip plan = Underwater if market corrects, payment unsustainable, transaction costs exceed appreciation in short term. Context determines classification making automatic “mortgages are good debt” oversimplified without evaluating specific terms and circumstances.

    Are student loans good debt or bad debt?
    Depends entirely on degree ROI and debt amount relative to earning potential: GOOD when: Degree in high-earning field (engineering, nursing, computer science, accounting median $60,000-$80,000+), debt under 1x first-year expected salary ($40,000 debt for $45,000 starting salary acceptable), federal loans at reasonable rates (4-7%), clear employment path in degree field, high completion likelihood at reputable institution. Example good: $35,000 for engineering degree enabling $35,000 → $70,000 income increase, $377 monthly payment on $70,000 income = 6.4% (comfortable), debt paid in 10 years, lifetime benefit $1.4M additional earnings = 40:1 ROI. BAD when: Degree in low-earning field (median under $40,000), debt exceeds 1.5-2x first-year salary ($80,000 debt for $35,000 career), high-interest private loans (over 10%), uncertain employment in field, for-profit institution with poor outcomes, completion unlikely. Example bad: $75,000 for general studies degree leading to $32,000 retail management, $862 monthly payment = 32% of gross income (unsustainable), requires income-driven repayment extending to 20 years with growing balance through interest, lifetime struggling with debt burden versus benefit. Critical evaluation: Research median salaries in degree field, calculate debt-to-income ratio, evaluate federal versus private loan mix, assess employment rates and career paths for graduates—making informed decision requires honest ROI analysis not assumption that all education automatically good investment.

    Can credit cards be good debt?
    Only under specific usage creating zero interest costs: GOOD usage—Charge routine spending, pay FULL balance every month by due date avoiding interest entirely, earn 1-5% cash back rewards ($300-$600+ annually on $30,000 spending), build credit history through on-time payments, leverage superior fraud protection and purchase benefits. Total cost: $0 interest (grace period maintained), net benefit from rewards and protections. BAD usage—Carry balances paying interest ($5,000 average balance at 20% APR = $1,000 annual interest), minimum payments creating perpetual debt (15+ years payoff, interest exceeding principal), finance consumption through credit (vacations, dining, shopping paid over years). Total cost: Thousands in interest negating any rewards. Key distinction: Credit cards themselves neutral tools—strategic disciplined usage (pay in full monthly) creates net benefits through rewards without costs making “good,” while irresponsible usage (carrying balances) creates wealth destruction through high interest making “bad.” Same card, same person, different behavior creates opposite outcomes. Recommendation: Use credit cards ONLY if committed to full monthly payment discipline, otherwise stick to debit cards preventing debt accumulation through forced spending within means until discipline established.

    What if I need to borrow but can only get high interest rates?
    Indicates challenging credit situation requiring careful evaluation: Options ranked best to worst: (1) Improve credit first if possible delaying borrowing 6-12 months—often increases score enough for better rates saving thousands (example: 640 score to 700 score reduces auto loan from 14% to 7% saving $6,000 on $20,000 loan). (2) Credit union personal loans or payday alternative loans (28% max vs 200-400% payday loans) if emergency truly cannot wait. (3) Secured loans offering lower rates through collateral (home equity if homeowner, secured credit card if building credit). (4) Payment plans with creditors often zero interest better than any loan (medical bills, utilities, rent). (5) Side income generating cash avoiding borrowing entirely (DoorDash, selling items, overtime). AVOID: Payday loans (300-400% APR), title loans (200-300% risking vehicle), rent-to-own (effective 100%+ APR), cash advances (25-30% no grace period). If must borrow at high rate: Smallest amount possible, shortest term sustainable, immediate aggressive payoff plan, address root cause preventing future need (budget gaps, lack of emergency fund). Example: $1,000 emergency, only qualify for 18% personal loan—borrow $1,000, make $200 monthly payments (6 months payoff), total cost $1,057 ($57 interest). Simultaneously build $1,000 emergency fund over next 6 months preventing future high-rate borrowing. Better than payday loan costing $150-300 in fees for same $1,000. Reality check: High rates signal credit issues or predatory targeting—focus on credit improvement and emergency fund building making future borrowing unnecessary or enabling better rates through improved creditworthiness.

    Should I pay off good debt early or invest the money instead?
    Depends on debt interest rate versus investment return expectations creating mathematical decision: GENERALLY pay off debt early when: Interest rate exceeds 7-8% (guaranteed return through interest savings typically beats market risk-adjusted returns), debt creates emotional stress regardless of math (psychological benefit valuable), approaching retirement wanting debt-free status (risk reduction priority), variable rate debt in rising rate environment. GENERALLY invest instead when: Interest rate under 5% (market returns likely exceed guaranteed savings), mortgage under 4% especially (inflation partially offsets, tax deduction further reduces effective cost), decades until retirement (time for compounding), comfortable with debt psychologically, emergency fund established (investing beyond safety net not instead of). Example comparison: $20,000 extra available, $20,000 mortgage balance at 4% versus invest at 8% expected. Pay mortgage: Save $4,000 interest over remaining term (guaranteed). Invest: Grow to $43,000 in 20 years at 8% = $23,000 net gain versus mortgage payoff. Math favors investing by $19,000. Alternative: $20,000 credit card debt at 18% versus invest. Pay credit card: Save $18,000+ interest (guaranteed, high return). Invest: Might grow to $43,000 but paying 18% debt interest meanwhile (math favors debt payoff). Rule of thumb: Pay off debt over 7-8% aggressively, invest if debt under 5%, case-by-case evaluation 5-7% range based on risk tolerance and psychological factors. Always maintain emergency fund before aggressive debt payoff or investing—liquidity prevents forced borrowing in crisis.

    Explore More in Money Basics

    Disclosure

    This article provides general educational information about debt evaluation frameworks and strategic borrowing concepts. Individual debt situations, appropriate borrowing decisions, and optimal strategies vary significantly based on circumstances including income, assets, credit, goals, and risk tolerance. “Good debt” and “bad debt” represent conceptual frameworks not guarantees of outcomes—all debt carries risks including potential default, credit damage, financial stress, and asset loss. This is not financial advice, recommendation of specific borrowing actions, or guarantee that any debt will produce positive outcomes. ROI examples and wealth projections represent hypothetical scenarios with assumptions about appreciation, income growth, and market returns—actual results vary and may differ substantially from examples. Home appreciation rates vary by market and time period. Education ROI depends on degree completion, field selection, job market conditions, and individual career trajectory. Business loan returns depend on business success. Consult qualified financial professionals for personalized guidance matching individual circumstances. Interest rate thresholds (good vs bad classifications) represent general guidelines not absolute rules—individual situations may warrant different evaluations. Tax implications vary by individual circumstances. Some “good debt” examples like mortgages and rental properties involve significant risks including market downturns, job loss, or property damage. Student loan examples assume degree completion and employment in field—dropout or career change alters outcomes. Debt-to-income ratios and affordability calculations represent general guidelines—individual budgets vary. Advertisements or sponsored content may appear within or alongside this content. All information presented independently for educational purposes only.

  • 5.1 What Is Debt? Understanding How Borrowing Really Works

    5.1 What Is Debt? Understanding How Borrowing Really Works

    Debt is money owed to another party—typically a lender, creditor, or service provider—creating legal obligation to repay borrowed funds plus interest or fees within specified timeframes according to agreed-upon terms establishing payment schedules, interest rates, collateral requirements, and consequences for non-payment. Ranging from mortgages enabling homeownership through 30-year loans to credit card balances accumulated through everyday purchases, debt represents temporary access to purchasing power beyond current cash resources enabling major acquisitions impossible through savings alone while creating future financial obligations reducing available income through required payments. Understanding debt requires distinguishing between productive debt financing appreciating assets or income-generating investments (mortgages, student loans for high-earning degrees, business loans) versus destructive debt funding consumption or depreciating purchases through high-interest borrowing (credit card balances for vacations, payday loans for routine expenses), recognizing that debt itself is neutral tool—neither inherently good nor bad—with outcomes determined by interest rates, repayment terms, borrower discipline, and whether borrowed funds create value exceeding borrowing costs making strategic debt use wealth-building while irresponsible borrowing creates financial destruction through interest accumulation and payment burdens exceeding benefits received.

    Notebook sketch explaining personal finance

    This article is designed for anyone wanting comprehensive debt understanding, individuals deciding whether to borrow for major purchases, or those confused by debt terminology and implications. You do not need financial expertise to understand debt fundamentals—basic concepts accessible through clear explanations of borrowing mechanics, types, costs, and strategic considerations, though requires honest assessment of borrowing motivations distinguishing between needs and wants, genuine inability to save versus impatience for immediate gratification, and productive investments versus consumption spending creating obligations without corresponding value, enabling informed borrowing decisions aligned with long-term financial goals rather than reactive emotional borrowing creating regret and financial stress when repayment obligations strain budgets unexpectedly.

    Understanding what debt is matters because modern financial life frequently requires borrowing for homeownership, education, and reliable transportation making debt literacy essential for successful major purchases, high-interest consumer debt represents single largest obstacle to wealth building for most Americans through compound interest and opportunity costs, and strategic debt usage enables leveraging appreciating assets while avoiding wealth destruction through consumption borrowing—while debt-literate individuals distinguish between productive and destructive borrowing making informed decisions aligned with wealth building, understand true costs through total interest calculation revealing lifetime borrowing expenses, and maintain discipline ensuring debt serves financial goals rather than creating perpetual payment obligations preventing wealth accumulation through interest costs exceeding investment returns or salary growth.

    Educational disclaimer: This article provides general educational information about debt concepts and types. Individual debt situations, appropriate borrowing decisions, and optimal strategies vary significantly based on circumstances including income, assets, goals, and risk tolerance. This is not financial advice or recommendation of specific borrowing actions. Debt carries risks including potential loss of collateral, credit damage, and financial stress from payment obligations. Consult qualified financial professionals for personalized guidance matching individual situations and goals.

    Debt Fundamentals

    Core Definition and Mechanics

    What debt represents:

    • Legal obligation to repay borrowed money
    • Contract between borrower (debtor) and lender (creditor)
    • Access to resources now in exchange for future repayment
    • Transfer of purchasing power from future to present

    Basic debt transaction:

    • Step 1: Borrower requests loan (example: $20,000 auto loan)
    • Step 2: Lender evaluates creditworthiness and approves terms
    • Step 3: Funds disbursed to borrower or directly to seller
    • Step 4: Borrower makes scheduled payments (principal + interest)
    • Step 5: Debt satisfied when full amount plus interest repaid

    Key components of any debt:

    • Principal: Original amount borrowed ($20,000 in auto loan example)
    • Interest: Cost of borrowing expressed as APR (6% typical for good credit)
    • Term: Repayment timeframe (60 months = 5 years common for autos)
    • Payment: Regular installment amount ($387 monthly example)
    • Total cost: Principal + all interest ($23,200 total = $20,000 + $3,200 interest)

    Why Debt Exists

    Borrower benefits:

    • Access to major purchases before saving full amount (homes, education)
    • Emergency funding when cash reserves insufficient
    • Investment in appreciating assets or income generation
    • Cash flow smoothing during income fluctuations
    • Leverage for wealth building through strategic borrowing

    Lender benefits:

    • Interest income on deployed capital
    • Risk-adjusted returns based on borrower creditworthiness
    • Economic growth facilitation through credit availability

    Economic benefits broadly:

    • Enables home ownership democratization
    • Facilitates higher education access
    • Supports business creation and expansion
    • Drives consumption and economic activity

    Secured vs Unsecured Debt

    Secured debt (collateral-backed):

    • Definition: Asset pledged guaranteeing repayment
    • Examples: Mortgages (home collateral), auto loans (vehicle collateral), home equity loans
    • Lender rights: Can seize collateral if borrower defaults
    • Interest rates: Lower (less lender risk through collateral)
    • Typical APRs: Mortgages 6-8%, auto loans 4-12%

    Unsecured debt (no collateral):

    • Definition: Based solely on borrower creditworthiness and promise to repay
    • Examples: Credit cards, personal loans, student loans, medical debt
    • Lender rights: No specific asset claim but can pursue collections and legal action
    • Interest rates: Higher (greater lender risk without collateral)
    • Typical APRs: Credit cards 15-25%, personal loans 8-18%

    Risk and cost relationship:

    • Secured debt less risky for lenders = lower rates for borrowers
    • Unsecured debt riskier for lenders = higher rates compensating risk
    • Borrower with collateral accesses cheaper borrowing
    • Default consequences differ: Collateral loss vs credit damage and collections
    Advertisement

    Financial Wellness Planner

    Types of Debt

    Revolving Debt

    Definition and characteristics:

    • Reusable credit line up to maximum limit
    • Borrow, repay, borrow again without reapplying
    • Variable payment based on balance (minimum payment structure)
    • Ongoing access as long as account open and in good standing

    Common revolving debt types:

    Credit cards:

    • Credit limit: $500-$50,000+ depending on creditworthiness
    • APR: 15-25% typical, up to 29.99% for poor credit
    • Grace period: 21-25 days if paid in full (no interest)
    • Minimum payment: 1-3% of balance

    Home Equity Lines of Credit (HELOCs):

    • Secured by home equity
    • Credit limit: Up to 85% of home equity typically
    • APR: 7-11% typical (lower than credit cards, secured)
    • Draw period: 10 years typically, then repayment period

    Personal lines of credit:

    • Unsecured revolving access
    • Limits: $1,000-$50,000
    • APR: 10-20% typical
    • Less common than credit cards or HELOCs

    Installment Debt

    Definition and characteristics:

    • Fixed loan amount borrowed once
    • Regular payments over set term until fully repaid
    • Closed-end (cannot reborrow after paying down)
    • Predictable payment schedule

    Common installment debt types:

    Mortgages:

    • Purpose: Home purchase or refinance
    • Amount: $100,000-$1,000,000+ depending on home value and income
    • Term: 15 or 30 years standard
    • APR: 6-8% currently (varies with credit and market)
    • Secured: Home as collateral
    • Example: $300,000, 30 years, 6.5% = $1,896 monthly, $682,632 total paid

    Auto loans:

    • Purpose: Vehicle purchase
    • Amount: $15,000-$50,000 typical
    • Term: 36-72 months common
    • APR: 4-12% depending on credit
    • Secured: Vehicle as collateral
    • Example: $25,000, 60 months, 6% = $483 monthly, $28,980 total paid

    Student loans:

    • Purpose: Education expenses
    • Amount: Varies by education cost ($30,000-$100,000+ total)
    • Term: 10-25 years
    • APR: Federal 4-7%, private 7-14%
    • Unsecured: No collateral but difficult to discharge in bankruptcy

    Personal loans:

    • Purpose: Debt consolidation, major purchases, emergencies
    • Amount: $1,000-$50,000 typical
    • Term: 12-60 months
    • APR: 8-36% depending on credit
    • Unsecured typically

    Open-End Debt

    Definition:

    • Balance must be paid in full each period
    • No option to carry balance (or limited)
    • Examples: Charge cards (American Express traditional), utility bills, cell phone service

    Productive vs Destructive Debt

    Productive Debt Characteristics

    Productive debt finances:

    • Appreciating assets: Real estate typically increasing in value over time
    • Income generation: Education increasing earning capacity, business investments
    • Essential needs: Reliable transportation enabling employment
    • Value exceeding cost: Benefits outweigh interest and fees paid

    Examples of productive debt:

    Mortgage for primary residence:

    • Home appreciates: $300,000 purchase becomes $450,000 in 15 years typical
    • Builds equity: $150,000+ equity from payments plus appreciation
    • Tax benefits: Mortgage interest deduction (for some taxpayers)
    • Alternative cost: Rent payments building landlord’s equity not yours
    • Net result: Wealth building through homeownership despite interest costs

    Student loans for high-ROI education:

    • Investment: $40,000 in student loans for engineering degree
    • Income increase: $35,000 without degree → $75,000 with degree
    • Differential: $40,000 extra annually
    • Payback: Debt paid in 2-3 years from income differential
    • Lifetime value: $1.5 million+ additional earnings over career
    • ROI: 37:1 return on education investment

    Business loan for expansion:

    • Borrow: $50,000 to purchase equipment enabling new product line
    • Revenue increase: $30,000 annually from new capabilities
    • Loan cost: $8,000 interest over 3-year term
    • Net benefit: $90,000 revenue over 3 years minus $8,000 interest = $82,000 net gain

    Destructive Debt Characteristics

    Destructive debt finances:

    • Consumption: Purchases consumed without lasting value (vacations, dining, entertainment)
    • Depreciating assets: Items losing value rapidly (vehicles financed at high rates, electronics)
    • Routine expenses: Using debt to cover regular living costs indicating budget mismatch
    • Cost exceeding value: Interest and fees outweigh benefits received

    Examples of destructive debt:

    Credit card debt for lifestyle spending:

    • Charges: $5,000 vacation, dining, shopping over 6 months
    • Minimum payments: $125 monthly at 18% APR
    • Payoff: 15+ years if minimum-only payments
    • Total cost: $11,000+ paid for $5,000 of consumed purchases
    • Net result: $6,000+ wasted in interest for items long-forgotten

    Payday loan for routine expenses:

    • Borrow: $300 for groceries (budget gap)
    • Fee: $45 (15% for 2 weeks = 391% APR)
    • Renewal cycle: Cannot repay, renews 10 times over 5 months
    • Total cost: $450 in fees plus $300 principal = $750 for $300 groceries
    • Net result: 150% markup on routine expenses perpetuating crisis

    High-rate auto loan for depreciating vehicle:

    • Purchase: $30,000 vehicle at 18% APR (subprime), 72 months
    • Payment: $621 monthly
    • Total paid: $44,712
    • Vehicle value after 6 years: $8,000 (rapid depreciation)
    • Net result: Paid $44,712 for asset worth $8,000, lost $36,712

    Gray Area: Context-Dependent Debt

    Debt that can be productive OR destructive depending on terms and usage:

    Auto loan (can be either):

    • Productive: Reliable $20,000 vehicle at 5% enabling $45,000 job (transportation essential)
    • Destructive: Luxury $60,000 vehicle at 12% for status when $20,000 vehicle adequate

    Home equity borrowing (can be either):

    • Productive: HELOC funding necessary home repairs preventing larger damage or home addition increasing property value
    • Destructive: HELOC funding vacation or luxury purchases risking foreclosure for consumption

    Credit cards (can be either):

    • Productive: Emergency car repair on credit, paid off within 3 months enabling job continuation
    • Destructive: Routine spending accumulating balances paid over years at 20% APR
    Advertisement
    Reserved space for in-content ad

    True Cost of Debt

    Beyond the Sticker Price

    Total cost calculation:

    • Purchase price (principal borrowed)
    • Plus all interest over full term
    • Plus all fees (origination, late fees, prepayment penalties)
    • Equals total amount paid

    Example comprehensive calculation:

    $250,000 home purchase:

    • Down payment: $50,000 (20%)
    • Mortgage: $200,000 at 6.5%, 30 years
    • Monthly payment: $1,264
    • Total payments: $455,040 ($1,264 × 360 months)
    • Total interest: $255,040 ($455,040 – $200,000 principal)
    • True cost of $250,000 home: $305,040 ($50,000 down + $255,040 interest)
    • Interest represents 127% of principal borrowed

    Opportunity Cost

    What else could the money have done?

    Example opportunity cost analysis:

    • $400 monthly car payment over 5 years = $24,000 total
    • Alternative: Invest $400 monthly in index fund at 8% annual return
    • After 5 years investment value: $29,500
    • After 30 years (continuing same $400): $545,000
    • Opportunity cost of car payment: $545,000 potential retirement wealth forfeited

    Debt payment vs investment trade-off:

    • Every dollar to debt payment cannot be invested
    • High-interest debt (over 7-8%) typically worth paying aggressively
    • Low-interest debt (under 4-5%) may be worth carrying while investing
    • Break-even point: Debt APR vs investment return comparison

    Impact on Financial Flexibility

    Debt obligations reduce options:

    • Required monthly payments reduce discretionary income
    • Job changes complicated by debt obligations
    • Emergency response limited by existing payment burdens
    • Debt-to-income ratio affects future borrowing capacity

    Example flexibility impact:

    • Income: $5,000 monthly
    • Debt payments: $2,500 (mortgage, car, student loans, credit cards)
    • Remaining: $2,500 for all other expenses and savings (50% of income consumed by debt)
    • Job opportunity: Lower-stress position at $4,500 monthly
    • Cannot accept: $2,500 debt payments on $4,500 income leaves only $2,000 (insufficient)
    • High debt burden reduces career flexibility and emergency resilience

    Debt and Credit Scores

    How Debt Affects Credit

    Credit score factors related to debt:

    Payment history (35% of FICO score):

    • On-time debt payments build credit
    • Late payments damage scores severely (60-110 point drop)
    • Missed payments, collections, charge-offs create major damage

    Amounts owed (30% of score):

    • Credit utilization on revolving debt (credit cards)
    • Total debt amounts relative to limits
    • High balances damage scores even with on-time payments

    Length of credit history (15%):

    • Older debt accounts (if managed well) help scores
    • Average account age calculation

    Credit mix (10%):

    • Variety of debt types (revolving and installment) beneficial
    • Shows diverse credit management capability

    Strategic Debt for Credit Building

    Using debt to build credit:

    • Small credit card balance paid in full monthly (builds history without interest)
    • Installment loan (auto, small personal loan) creating payment history
    • Credit builder loan specifically designed for credit establishment

    Credit building vs wealth building trade-off:

    • Can build credit without paying interest (strategic card use, paid in full)
    • Paying interest solely for credit building generally inadvisable
    • Exception: Small credit builder loan ($300-1,000) with minimal interest acceptable for credit establishment
    Advertisement
    Reserved space for in-content ad

    When to Borrow vs When to Save

    Appropriate Borrowing Scenarios

    When debt makes sense:

    • Home purchase: Appreciation potential and rent alternative make mortgage worthwhile despite interest
    • High-ROI education: Earning capacity increase justifies student loan costs
    • Reliable transportation: Essential vehicle enabling employment when saving delays job access
    • Business investment: Revenue generation exceeding borrowing costs
    • True emergencies: Medical crisis, essential home repairs preventing larger damage

    Decision framework:

    • Is purchase truly necessary or discretionary want?
    • Does asset appreciate or generate income exceeding interest costs?
    • What happens if don’t borrow? (Job loss, health crisis, or mere inconvenience?)
    • Are interest rates reasonable (under 8-10% generally)?
    • Can I comfortably afford payments within budget?

    When Saving Preferable to Borrowing

    Save instead of borrow when:

    • Discretionary purchases: Vacations, entertainment, luxury items
    • Rapidly depreciating items: Electronics, furniture, vehicles (unless necessity)
    • Timeline permits: Can delay purchase to save without significant consequences
    • High interest rates: Borrowing costs exceeding 15-20% APR
    • Uncertain repayment: Income instability making payments risky

    Delayed gratification benefits:

    • Zero interest costs (saves hundreds to thousands)
    • Appreciation during saving period (investment returns)
    • Better purchase decisions (time reduces impulse buying)
    • Negotiating power (cash buyers command discounts)

    Example comparison:

    • Purchase: $3,000 furniture set
    • Borrow option: Store financing 24% APR, 12 months = $3,425 total cost
    • Save option: Save $250 monthly for 12 months, invest at 5% = $3,078 saved, buy cash, $347 cheaper than financing

    Why Understanding Debt Matters

    Without understanding what debt is, individuals borrow reactively without calculating true costs revealing interest often doubling purchase prices, fail to distinguish between productive debt enabling wealth building and destructive debt destroying it through consumption borrowing, and miss strategic opportunities using leverage appropriately while avoiding predatory high-interest traps—while debt-literate individuals make informed borrowing decisions aligned with long-term wealth building, understand total cost calculations revealing lifetime interest expenses, and maintain discipline ensuring debt serves financial goals rather than creating perpetual payment obligations preventing wealth accumulation through interest costs exceeding benefits received, enabling strategic debt usage maximizing leverage benefits while avoiding destructive borrowing patterns creating financial stress and opportunity costs impossible to recover from without behavior changes addressing root spending versus income mismatches.

    Understanding what debt is enables individuals to:

    • Distinguish between productive and destructive borrowing making strategic decisions
    • Calculate true costs including total interest revealing lifetime expenses
    • Recognize when borrowing appropriate versus when saving preferable
    • Understand secured versus unsecured debt implications for rates and risks
    • Identify revolving versus installment debt managing each type appropriately
    • Evaluate opportunity costs of debt payments versus investment alternatives
    • Make informed decisions about debt timing, amounts, and terms aligned with goals

    Debt knowledge transforms borrowing from reactive emotional decisions into strategic informed choices evaluating costs, benefits, alternatives, and long-term implications enabling wealth building through appropriate leverage while avoiding wealth destruction through consumption borrowing impossible without understanding debt fundamentals, types, costs, and strategic usage principles.

    Common Misunderstandings

    Many people assume all debt inherently bad requiring complete avoidance. In reality, strategic debt enables major purchases impossible through cash-only approaches (homeownership building wealth through equity, education increasing lifetime earnings), appropriate leverage accelerates wealth building when borrowing costs lower than investment returns, and modern financial life frequently requires debt for housing, transportation, and education, proving debt itself neutral tool with outcomes determined by interest rates, repayment terms, and whether borrowed funds create value exceeding costs rather than all debt representing financial irresponsibility requiring avoidance.

    Another common misconception is minimum payments represent responsible debt management. In practice, minimum payments deliberately designed to maximize lender profits through interest accumulation keeping balances persistent for decades—$5,000 credit card at 18% APR with minimums takes 15+ years and $6,000+ interest versus aggressive $300 monthly eliminating debt in 19 months with $580 interest, proving minimum payments create illusion of affordability while enriching issuers through compounding interest vastly exceeding principal reduction early in timeline making minimum-only approach responsible-appearing trap not sound strategy.

    Some believe carrying debt helps credit scores by “showing active credit use.” However, credit scores improve through on-time payments and low utilization regardless of whether balances paid in full or carried—carrying balances costs substantial interest ($1,000+ annually on $5,000 balance at 20% APR) with zero additional score benefit, proving strategic credit card use paying in full monthly builds credit identically to carrying balances but without interest waste based on misunderstanding of scoring factors rewarding payment history and utilization percentage not interest payment to creditors.

    How Debt Understanding Fits Into Financial Success

    Debt understanding enables strategic leverage distinguishing between wealth-building borrowing and wealth-destroying consumption, provides framework for calculating true costs revealing lifetime interest expenses, and creates discipline ensuring debt serves financial goals rather than creating perpetual obligations—making debt literacy essential component of comprehensive financial success requiring informed borrowing decisions evaluating costs versus benefits, realistic repayment planning ensuring payments sustainable within budget, and strategic usage maximizing productive debt while minimizing or eliminating destructive borrowing, transforming debt from feared topic or misused tool into understood instrument enabling major purchases and wealth building when used appropriately versus creating financial destruction through high-interest consumption borrowing exceeding repayment capacity.

    For example, two high school graduates both age 18 entering adult financial life. Person A views all debt as evil requiring complete avoidance, uses only cash and debit cards refusing any borrowing. Saves diligently, accumulates $15,000 by age 22. Wants to buy home but denied mortgage despite $15,000 saved—no credit history makes them “credit invisible” regardless of cash reserves and stable employment. Continues renting $1,200 monthly, age 35 still renting despite $60,000 saved (insufficient for home purchase in area, denied mortgage repeatedly). Meanwhile Person A drives $4,000 unreliable car purchased cash age 22, spends $3,000+ annually on repairs, eventually needs replacement age 28 paying $8,000 cash for another used vehicle. Zero credit card rewards earned over 17 years on same $30,000 annual spending Person B has. After 17 years age 35: Still renting ($244,800 paid in rent over 17 years building landlord’s equity), owns aging vehicle, $60,000 saved (disciplined) but no home equity wealth, never qualified for mortgage due to absent credit history. Person B understands debt as tool requiring strategic usage, opens secured credit card age 18 using for routine spending paying full balance monthly (builds credit, zero interest, earns 2% cash back = $600 annually). Age 22: Excellent 750+ credit score, approved for $20,000 auto loan at 5% buying reliable vehicle, $387 monthly for 60 months. Age 25: Approved for mortgage 6.5% rate buying $250,000 home with $15,000 down (identical savings as Person A), payment $1,485 monthly. Over 17 years: Built $100,000+ home equity ($50,000 principal payments + $50,000 appreciation), earned $10,200 credit card rewards ($600 × 17 years), owned reliable vehicles through strategic financing. Age 35: Home worth $400,000 with $150,000 equity, total paid $302,220 mortgage payments ($1,485 × 204 months) but owns asset worth $400,000, vehicles financed strategically saving repair costs versus Person A’s unreliable vehicles. Difference: Person B’s debt literacy created $250,000+ wealth difference ($150,000 home equity Person A lacks + $100,000 avoided rent versus mortgage principal comparison + $10,200 rewards) from strategic debt usage enabling homeownership, reliable transportation, and rewards capture versus Person A’s debt avoidance preventing wealth building despite equal savings discipline and spending levels—entire difference from understanding debt as neutral tool requiring strategic usage not inherent evil requiring complete avoidance.

    Debt understanding separates strategic leveragers building wealth through appropriate borrowing from either avoiders preventing wealth building through credit invisibility or misusers destroying wealth through high-interest consumption debt lacking framework for distinguishing productive from destructive borrowing or calculating true costs enabling informed decisions.

    Recent Updates and Trends

    In recent years, buy-now-pay-later services have proliferated offering point-of-sale installment debt as convenient financing alternative, though creating similar risks to traditional consumer debt through payment stacking and potential overspending beyond capacity despite 0% interest marketing obscuring cash flow impacts and late fee risks.

    Student loan debt has reached $1.7+ trillion nationally creating debt burden discussions around forgiveness programs and income-driven repayment plans, though fundamental education ROI principles remain unchanged requiring evaluation of degree earning potential versus debt incurred making strategic education borrowing wealth-building while excessive debt for low-earning majors creates financial burden exceeding benefits.

    Mortgage rates have fluctuated significantly with Federal Reserve policy changes affecting homeownership affordability, though fundamental home equity building principles persist making strategic mortgage debt wealth-building despite interest cost variations requiring appropriate price points and realistic repayment planning regardless of current rate environment.

    Credit card APRs have increased following Federal Reserve rate adjustments with average rates rising from 15-17% to 20-22%, though fundamental minimum payment mathematics unchanged requiring aggressive payoff regardless of specific APR making high balances increasingly expensive but not altering strategic approach of full monthly payments or aggressive payoff when balances carried.

    Fundamental debt principles remain timeless: productive debt finances appreciating assets or income generation justifying interest costs, destructive debt funds consumption creating obligations without corresponding value, total cost including interest vastly exceeds purchase price requiring calculation before borrowing, and strategic debt usage enables wealth building while irresponsible borrowing destroys it—regardless of product innovation, rate environment changes, debt burden discussions, or buy-now-pay-later proliferation, understanding debt fundamentals, calculating true costs, and distinguishing productive from destructive borrowing produces superior outcomes through informed strategic decisions impossible without debt literacy enabling appropriate leverage maximizing benefits while avoiding wealth destruction through consumption borrowing.

    3 Things You Can Do Today

    Ready to understand and optimize debt usage? Here are three simple steps you can take right now:

    1. Calculate total cost of every current debt revealing lifetime interest expenses beyond purchase prices – List all current debts: Credit cards (balances, APRs), auto loans (balance, APR, months remaining), student loans, personal loans, mortgage if applicable. Use online loan calculator for each entering: Balance, APR, current payment or term. Record shocking results: Total interest to be paid (often 50-150% of principal for credit cards), total amount will pay (principal + interest), years to payoff at current payment. Example revelations: $8,000 credit card at 20% APR paying $200 monthly = $2,400 interest over 5 years, $10,400 total paid. $25,000 auto loan at 8% = $4,200 interest over 60 months, $29,200 total paid. $200,000 mortgage at 6.5% = $255,000 interest over 30 years, $455,000 total paid for $200,000 borrowed. Sum total interest across all debts creating lifetime interest number (often $100,000-300,000 for typical household). Write totals making invisible costs visible: “Current debt path: $X total interest over Y years.” Creates awareness: Seeing “$150,000 lifetime interest” provides context for aggressive payoff decisions and future borrowing caution impossible without calculating true costs beyond minimum payment affordability. Takes 20 minutes per debt revealing actual costs driving strategic debt decisions.

    2. Categorize each debt as productive or destructive creating action priority and strategic framework – Review each debt evaluating: What did borrowed money purchase? (Asset, education, consumption). Does asset appreciate or generate income? (Home appreciates, education increases earnings, vacation consumed). What’s the interest rate? (Under 8% potentially productive, over 15% likely destructive). Create two lists: PRODUCTIVE DEBT (mortgages on primary residence, student loans for degree increasing income, business loans generating revenue, low-rate auto loans for reliable essential transportation). DESTRUCTIVE DEBT (credit card balances for vacations/dining/shopping, payday loans, high-rate personal loans for consumption, auto loans over 12% APR for luxury vehicles). Action plan: Productive debt—continue scheduled payments, consider accelerating highest-rate items but prioritize investing if rates under 5-6%. Destructive debt—aggressive elimination prioritizing highest APR, temporary spending freeze, debt avalanche method, consider balance transfers to 0% promotional rates. Example categorization and action: Mortgage $200,000 at 6.5% = PRODUCTIVE (building equity, continue normal payments). Credit cards $8,000 at 20% = DESTRUCTIVE (consumption, attack aggressively paying $500 monthly eliminating in 18 months). Auto $15,000 at 12% = BORDERLINE DESTRUCTIVE (high rate, accelerate to $400 monthly eliminating in 45 months instead of 60). Takes 15 minutes creating strategic framework distinguishing wealth-building from wealth-destroying debt enabling appropriate action.

    3. If considering new borrowing, calculate full cost and evaluate whether saving preferable to borrowing – Upcoming purchase or borrowing consideration: Note item cost, loan terms being considered (APR, term). Calculate total cost: Use loan calculator showing total interest plus principal. Example: $5,000 furniture, store financing 24% APR 24 months = $6,423 total ($1,423 interest). Compare saving alternative: Monthly payment would be $268, save $268 monthly instead for 18 months = $4,824 saved, buy cash, saves $1,599 versus financing plus 6-month delay. Decision framework questions: Is purchase essential or discretionary? (Furniture = want not need). What happens if delay 6-18 months saving? (Nothing terrible, temporary inconvenience only). Does asset appreciate or depreciate? (Furniture depreciates, worth $1,000 in 5 years). Can I comfortably afford payments or stretching budget? (Honest assessment). If answers = discretionary want + can delay + depreciates + stretching budget = SAVE instead of borrow. If answers = essential need + cannot delay + appreciates or generates income + comfortable payment = BORROW may be appropriate. Example appropriate borrowing: $20,000 vehicle essential for new job, cannot delay, reliable transportation generating $45,000 annual income, can afford $387 monthly at 6% = borrow makes sense (income enabled exceeds interest cost). Example inappropriate borrowing: $5,000 vacation, discretionary want, can delay saving, consumed experience, stretching budget at 18% APR = save instead (delaying 10 months saving $500 monthly costs zero interest versus $900+ financing). Takes 15 minutes evaluating each borrowing decision preventing thousands in unnecessary interest through strategic save-versus-borrow framework.

    These actions create debt literacy foundation within 60 minutes—calculated true lifetime costs revealing total interest expenses ($100,000+ typical awareness shock), categorized debts as productive or destructive creating strategic action framework distinguishing wealth building from destruction, and established save-versus-borrow decision framework preventing future high-interest consumption borrowing—transforming debt from mysterious feared topic or misused tool into understood strategic instrument enabling informed borrowing decisions maximizing productive leverage while minimizing or eliminating destructive consumption debt impossible without fundamental understanding of debt types, costs, and strategic usage principles.

    Advertisement
    Reserved space for in-content ad

    Quick FAQ

    Is all debt bad?
    No—debt neutral tool with outcomes determined by usage: Productive debt finances appreciating assets (homes building equity), income generation (education increasing earnings, business investments), or essential needs (reliable transportation enabling employment) creating value exceeding interest costs making strategic wealth-building. Destructive debt funds consumption (vacations, dining, entertainment), depreciating purchases (electronics, furniture through high-interest financing), or routine expenses indicating budget mismatch, creating obligations without corresponding value making wealth-destroying through interest waste. Critical factors: Interest rate (under 8% potentially productive, over 15% usually destructive), asset characteristics (appreciating vs depreciating), necessity (essential vs discretionary), repayment capacity (comfortable vs stretching budget). Examples: $200,000 mortgage at 6.5% for home appreciating to $400,000 building $150,000+ equity = GOOD debt despite $255,000 interest (equity gain exceeds cost). $5,000 credit card at 20% for vacation paid over 5 years costing $6,200+ total = BAD debt (consumed experience worth zero after trip, paid $1,200+ interest for memories). Context matters enormously—same debt type can be productive or destructive depending on terms, usage, and outcomes.

    What’s the difference between secured and unsecured debt?
    Secured debt backed by collateral (asset lender can seize if default), unsecured debt based solely on promise to repay creating different rates and risks: Secured characteristics—Requires pledging asset (home for mortgage, vehicle for auto loan), lender can repossess/foreclose if borrower defaults, lower interest rates (4-12% typical) due to reduced lender risk, larger loan amounts possible, easier qualification. Unsecured characteristics—No collateral required, based on creditworthiness only, higher interest rates (15-25% typical) compensating lender risk, collections and credit damage if default but no specific asset seizure, harder qualification typically. Examples secured: Mortgages (home collateral), auto loans (vehicle), HELOCs (home equity). Examples unsecured: Credit cards, personal loans, student loans, medical debt. Key difference: Default consequences—secured debt lose pledged asset (foreclosure, repossession), unsecured debt credit damage and potential lawsuits but no automatic asset loss. Strategic implication: Secured debt cheaper borrowing if comfortable risking collateral, unsecured more expensive but doesn’t risk losing home/car making appropriate for smaller amounts where asset risk unacceptable. Rate comparison example: $20,000 home equity loan (secured) at 7% versus $20,000 personal loan (unsecured) at 15%, total interest over 5 years: $3,761 secured versus $8,538 unsecured = $4,777 savings from collateralization but risking home if cannot repay versus higher cost but no home risk.

    How does debt affect my credit score?
    Debt affects 65% of FICO credit score through payment history (35%) and amounts owed (30%): Payment history impact—On-time debt payments build credit showing reliability, single 30-day late payment drops score 60-110 points, collections and charge-offs create major damage (100-150 point drops), payment history most important factor making perfect payments essential. Amounts owed impact—Credit utilization on revolving debt (credit cards) matters most, keeping balances under 30% of limits prevents score damage, under 10% optimal for maximum scores, high balances damage scores even with perfect payments (maxing cards drops scores 80-120 points). Credit age impact—Older debt accounts help average age calculation (15% of score), closing old accounts reduces history length damaging scores. Credit mix impact—Having both revolving (cards) and installment (loans) debt shows diverse management (10% of score). Strategic usage: Small credit card balance paid in full monthly builds excellent credit (perfect payment history, low utilization) without interest costs, installment loans like auto or personal loans add to credit mix, keeping old accounts open preserves history length. Example: $5,000 credit limit, keep balance under $500 (10% utilization), pay in full monthly = builds credit without cost. Total debt amount matters less than utilization percentage and payment history—someone with $200,000 mortgage paid on time has excellent credit, someone with $2,000 credit card maxed has poor credit despite lower total debt. Key: Use debt strategically for credit building (pay in full, low utilization, perfect payments) versus allowing debt to damage credit through high balances or late payments.

    Should I pay off debt or invest?
    Depends on debt interest rate versus investment return expectations creating mathematical decision: GENERALLY pay off debt early when—Interest rate exceeds 7-8% (guaranteed return through interest savings typically beats market risk-adjusted returns), debt creates emotional stress regardless of math (psychological benefit valuable), approaching retirement wanting debt-free status (risk reduction priority), variable rate debt in rising rate environment. GENERALLY invest instead when—Interest rate under 5% (market returns likely exceed guaranteed savings), mortgage under 4% especially (inflation partially offsets, tax deduction further reduces effective cost), decades until retirement (time for compounding), comfortable with debt psychologically, emergency fund established (investing beyond safety net not instead of). Example comparison: $20,000 extra available, $20,000 mortgage balance at 4% versus invest at 8% expected. Pay mortgage: Save $4,000 interest over remaining term (guaranteed). Invest: Grow to $43,000 in 20 years at 8% = $23,000 net gain versus mortgage payoff. Math favors investing by $19,000. Alternative: $20,000 credit card debt at 18% versus invest. Pay credit card: Save $18,000+ interest (guaranteed, high return). Invest: Might grow to $43,000 but paying 18% debt interest meanwhile (math favors debt payoff). Rule of thumb: Pay off debt over 7-8% aggressively, invest if debt under 5%, case-by-case evaluation 5-7% range based on risk tolerance and psychological factors. Always maintain emergency fund before aggressive debt payoff or investing—liquidity prevents forced borrowing in crisis.

    What’s the best way to get out of debt?
    Debt avalanche method (mathematical optimal) or debt snowball method (psychological optimal) combined with aggressive payment increase and spending discipline: Avalanche approach—List all debts from highest to lowest APR, pay minimums on all except highest APR, apply all extra payment to highest APR debt, when paid off attack next highest, minimizes total interest mathematically. Snowball approach—List debts smallest to largest balance (ignore APR), pay minimums on all except smallest, attack smallest balance aggressively, when eliminated roll payment to next smallest, creates quick wins and momentum. Example: $3,000 at 24%, $5,000 at 18%, $2,000 at 15%, available $600 monthly. Avalanche: Attack 24% first (minimums on others), mathematically optimal saving maximum interest. Snowball: Attack $2,000 first, quick win in 4 months, motivation boost, slightly more total interest but better psychological adherence for some. Implementation: Calculate minimum payments all debts, determine total available for debt payments (example: $600), allocate minimums to all, apply remainder to target debt chosen by method, increase payment amount through spending cuts or income increases creating faster progress. Acceleration strategies: Temporary spending freeze redirecting 100% discretionary income to debt, side income (DoorDash, overtime, selling items) applying entirely to debt, windfall capture (tax refunds, bonuses to principal), biweekly payments (26 half-payments = 13 full payments yearly). Timeline realistic expectations: $15,000 total debt, $600 monthly = 24-30 months debt-free depending on APRs and method, requires consistency and discipline. Critical: Address root cause (spending exceeds income) through budget or both methods perpetuate cycle versus treating symptom through aggressive payoff while continuing overspending creating new debt replacing old.

    Explore More in Money Basics

    Disclosure

    This article provides general educational information about debt concepts and types. Individual debt situations, appropriate borrowing decisions, and optimal strategies vary significantly based on circumstances including income, assets, credit, goals, and risk tolerance. “Good debt” and “productive debt” terminology represents conceptual frameworks not guarantees of outcomes—all debt carries risks including potential default, credit damage, financial stress, and asset loss. This is not financial advice, recommendation of specific borrowing actions, or guarantee that any debt will produce positive outcomes. Interest rate thresholds and debt classifications represent general guidelines not absolute rules—individual situations may warrant different evaluations. Home appreciation, investment returns, and income increases are not guaranteed and depend on numerous factors including market conditions, individual performance, and economic environment. Opportunity cost calculations contain assumptions about investment returns that may not materialize. Debt-to-income ratios and affordability calculations represent general guidelines—individual budgets vary. Some “productive debt” examples like mortgages involve significant risks including market downturns and potential foreclosure. Student loan outcomes depend on degree completion, field selection, and employment success. Consult qualified financial professionals, credit counselors, or debt advisors for personalized guidance matching individual circumstances. Focus on conservative borrowing within proven repayment capacity rather than maximizing debt amounts. Minimum payment dangers and debt avalanche/snowball methods represent general strategies—individual optimization depends on complete financial picture. Advertisements or sponsored content may appear within or alongside this content. All information presented independently for educational purposes only.